This blog post shows how to measure the performance of your web application using Lighthouse tool, and how to run such measurements on each pull request to make sure the performance does not drop.
- Example application
- Lighthouse in Chrome browser
- Reports
- Lighthouse CLI
- Set performance budget
- Lighthouse on CI
- Fail on low performance
- Lighthouse GitHub status checks
- Performance checks for pull requests
- See also
- Bonus 1: Run Chrome in Docker
- Bonus 2: Basic authentication
- Bonus 3: Local Lighthouse report
- Bonus 4: Post GitHub summary
- Bonus 5: Split autorun command
- Bonus 6: Reusable GitHub Actions module
Example application
I have prepared a small web page that loads and shows "Loaded" after one second. You can find the source code in the repo bahmutov/web-performance-example.
1 | <html> |
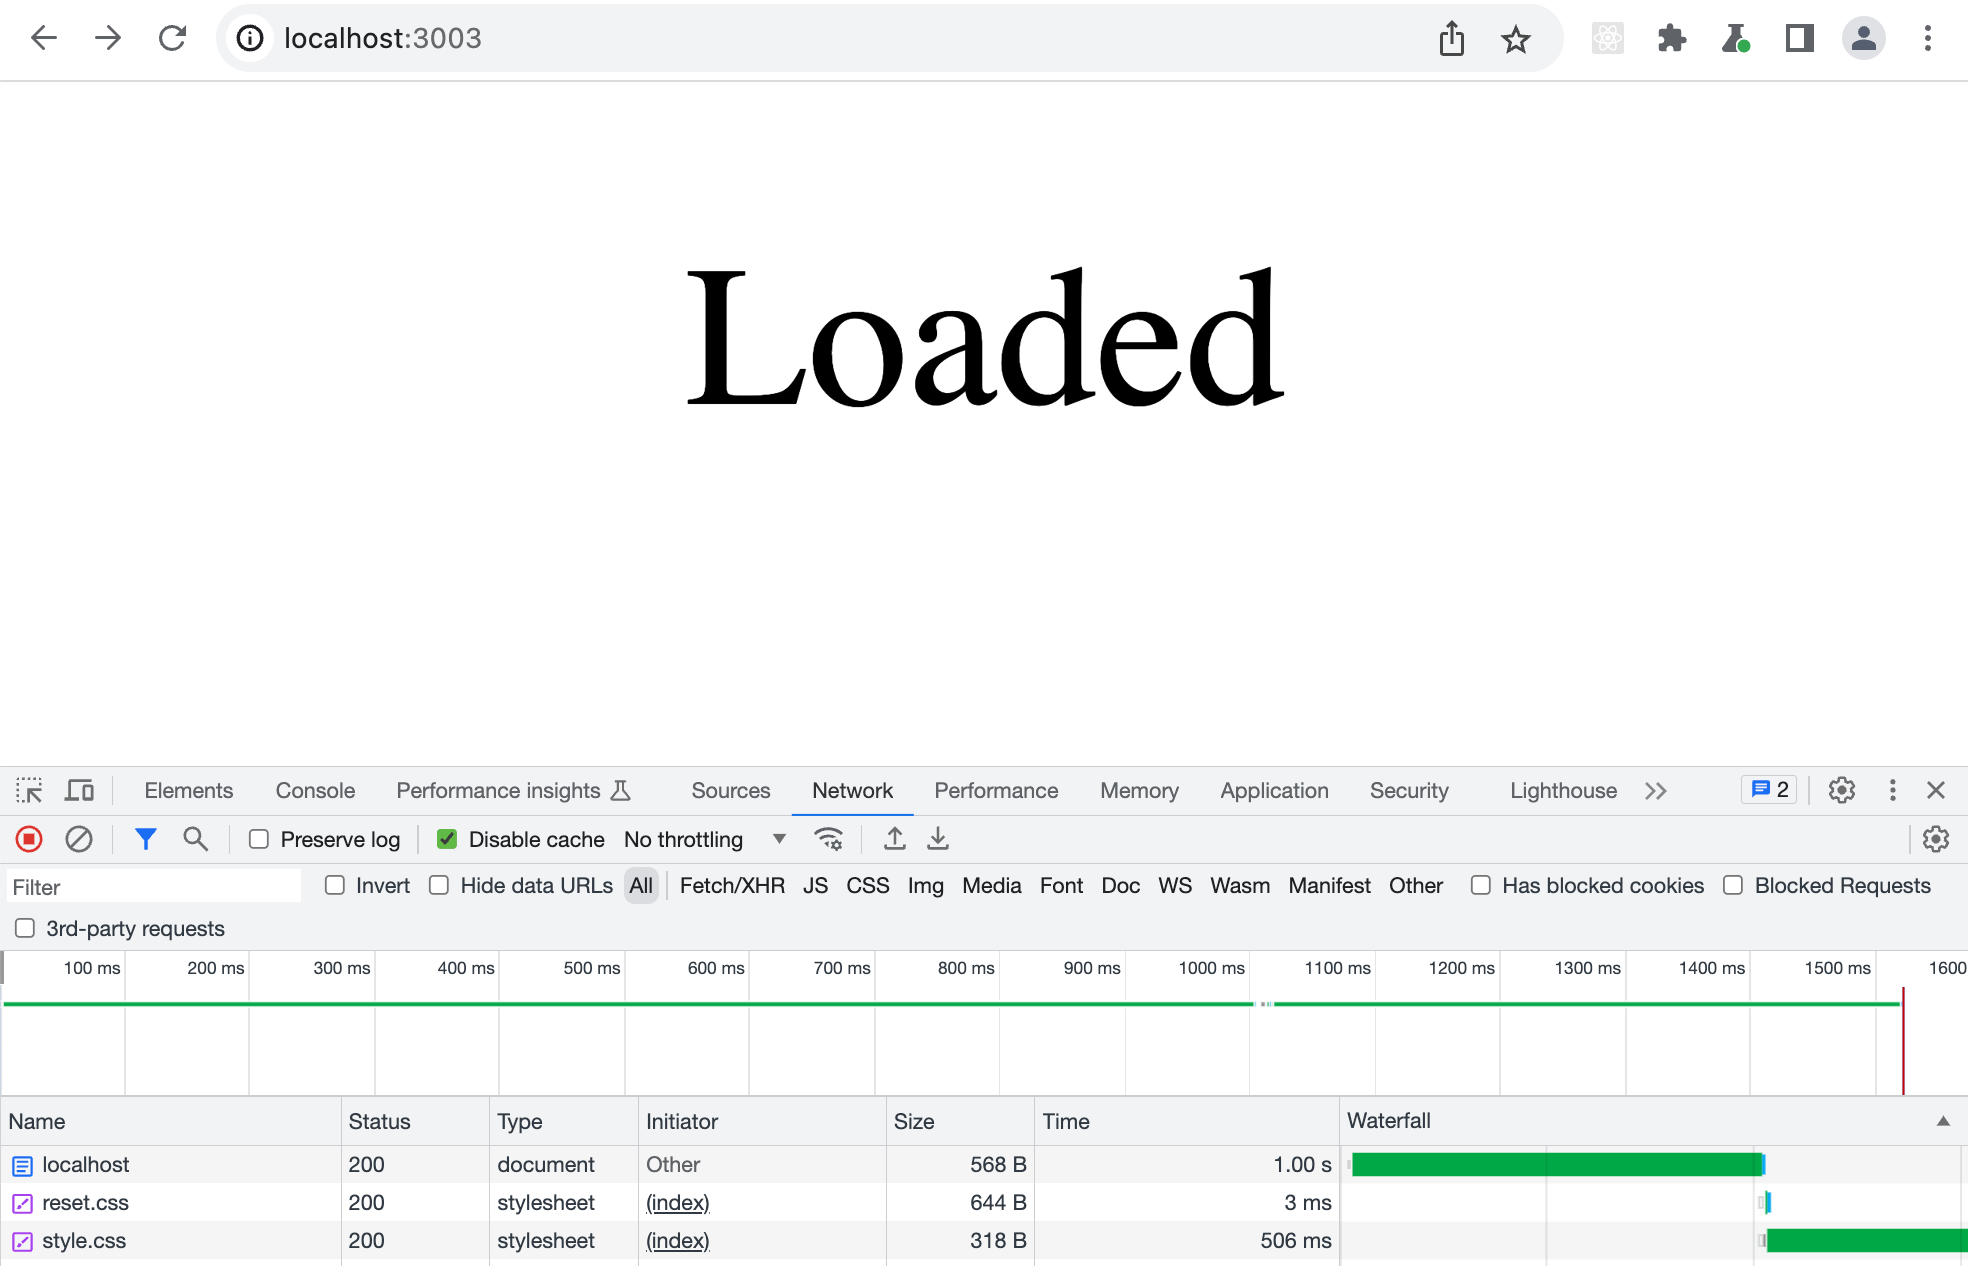
The server slows down the style.css and index.html on purpose
1 | fastify.get('/', (request, reply) => { |
The slowdown is clearly visible in the Network panel waterfall of resources.

How fast does this page load? Can we confirm it automatically?
Lighthouse in Chrome browser
The simplest way to measure how fast the site loads is by using the built-in Lighthouse panel in the Chrome browser's DevTools.
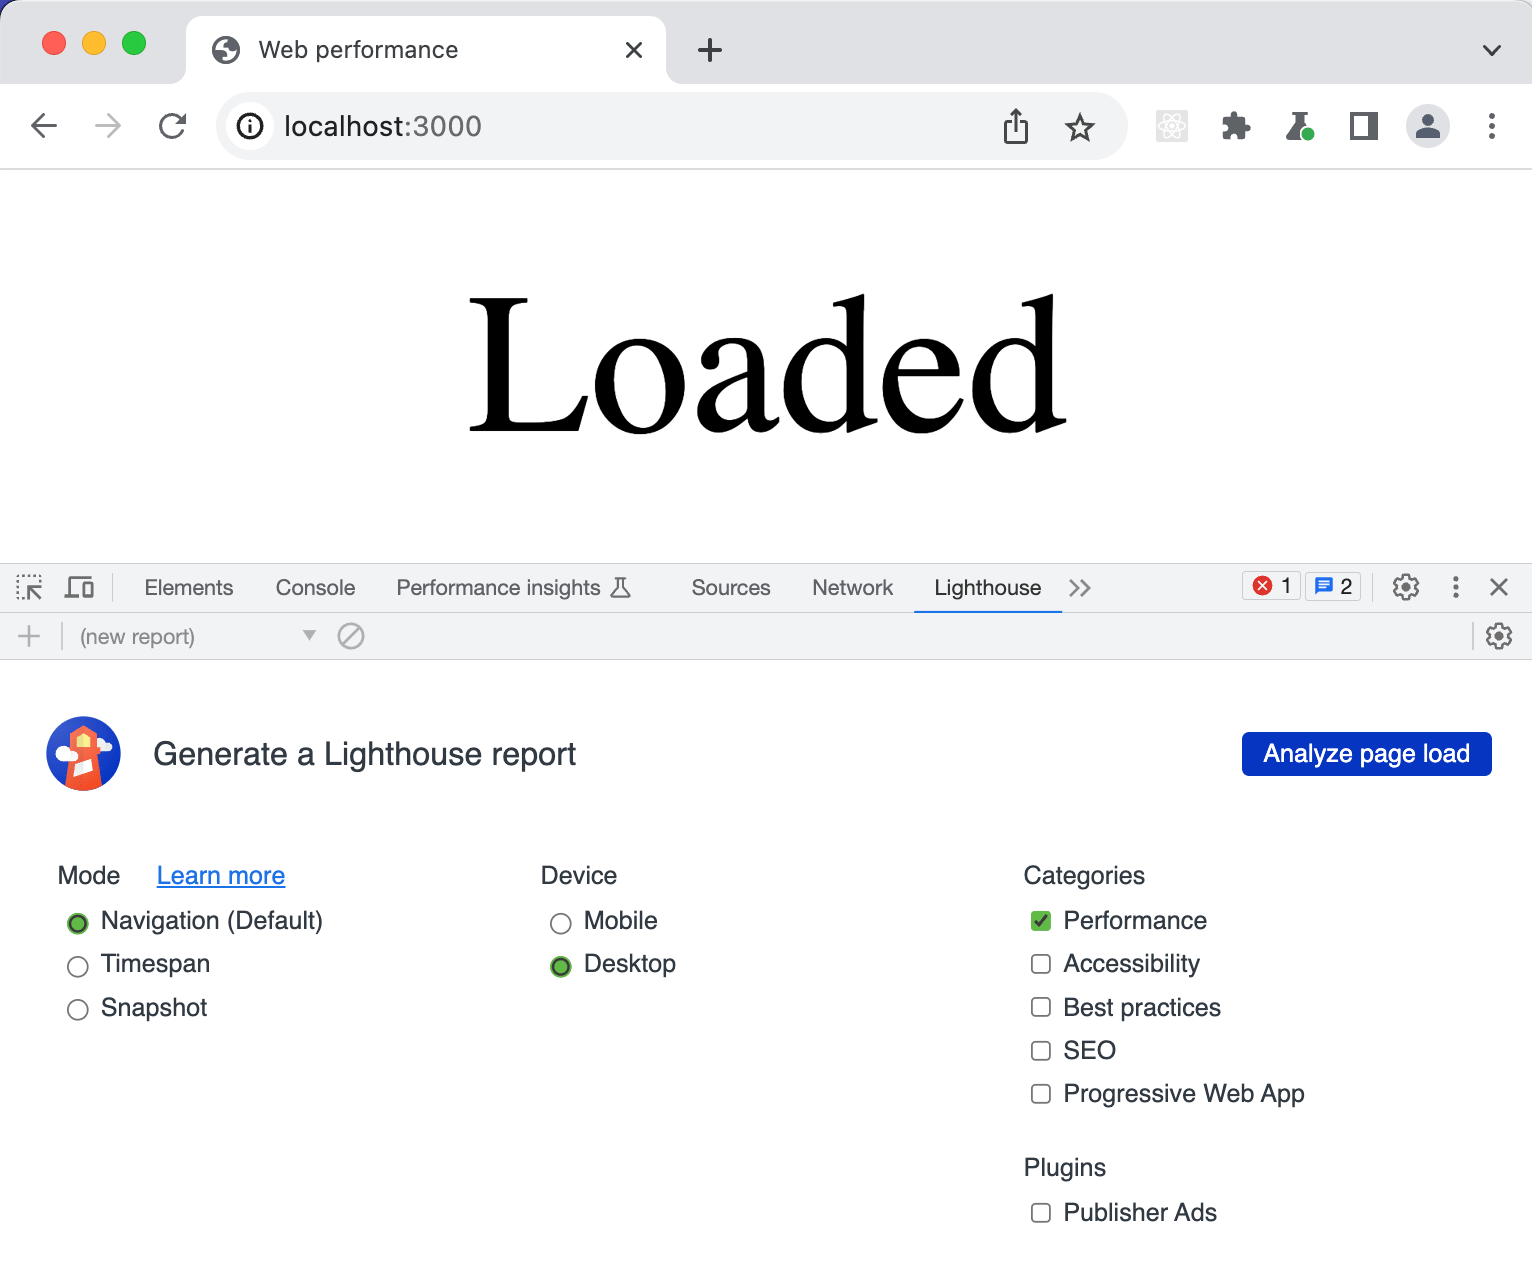
Once you click the "Analyze page load" button, the Lighthouse cranks for a few seconds, reloads the page, while measuring everything, and then shows its results and recommendations.
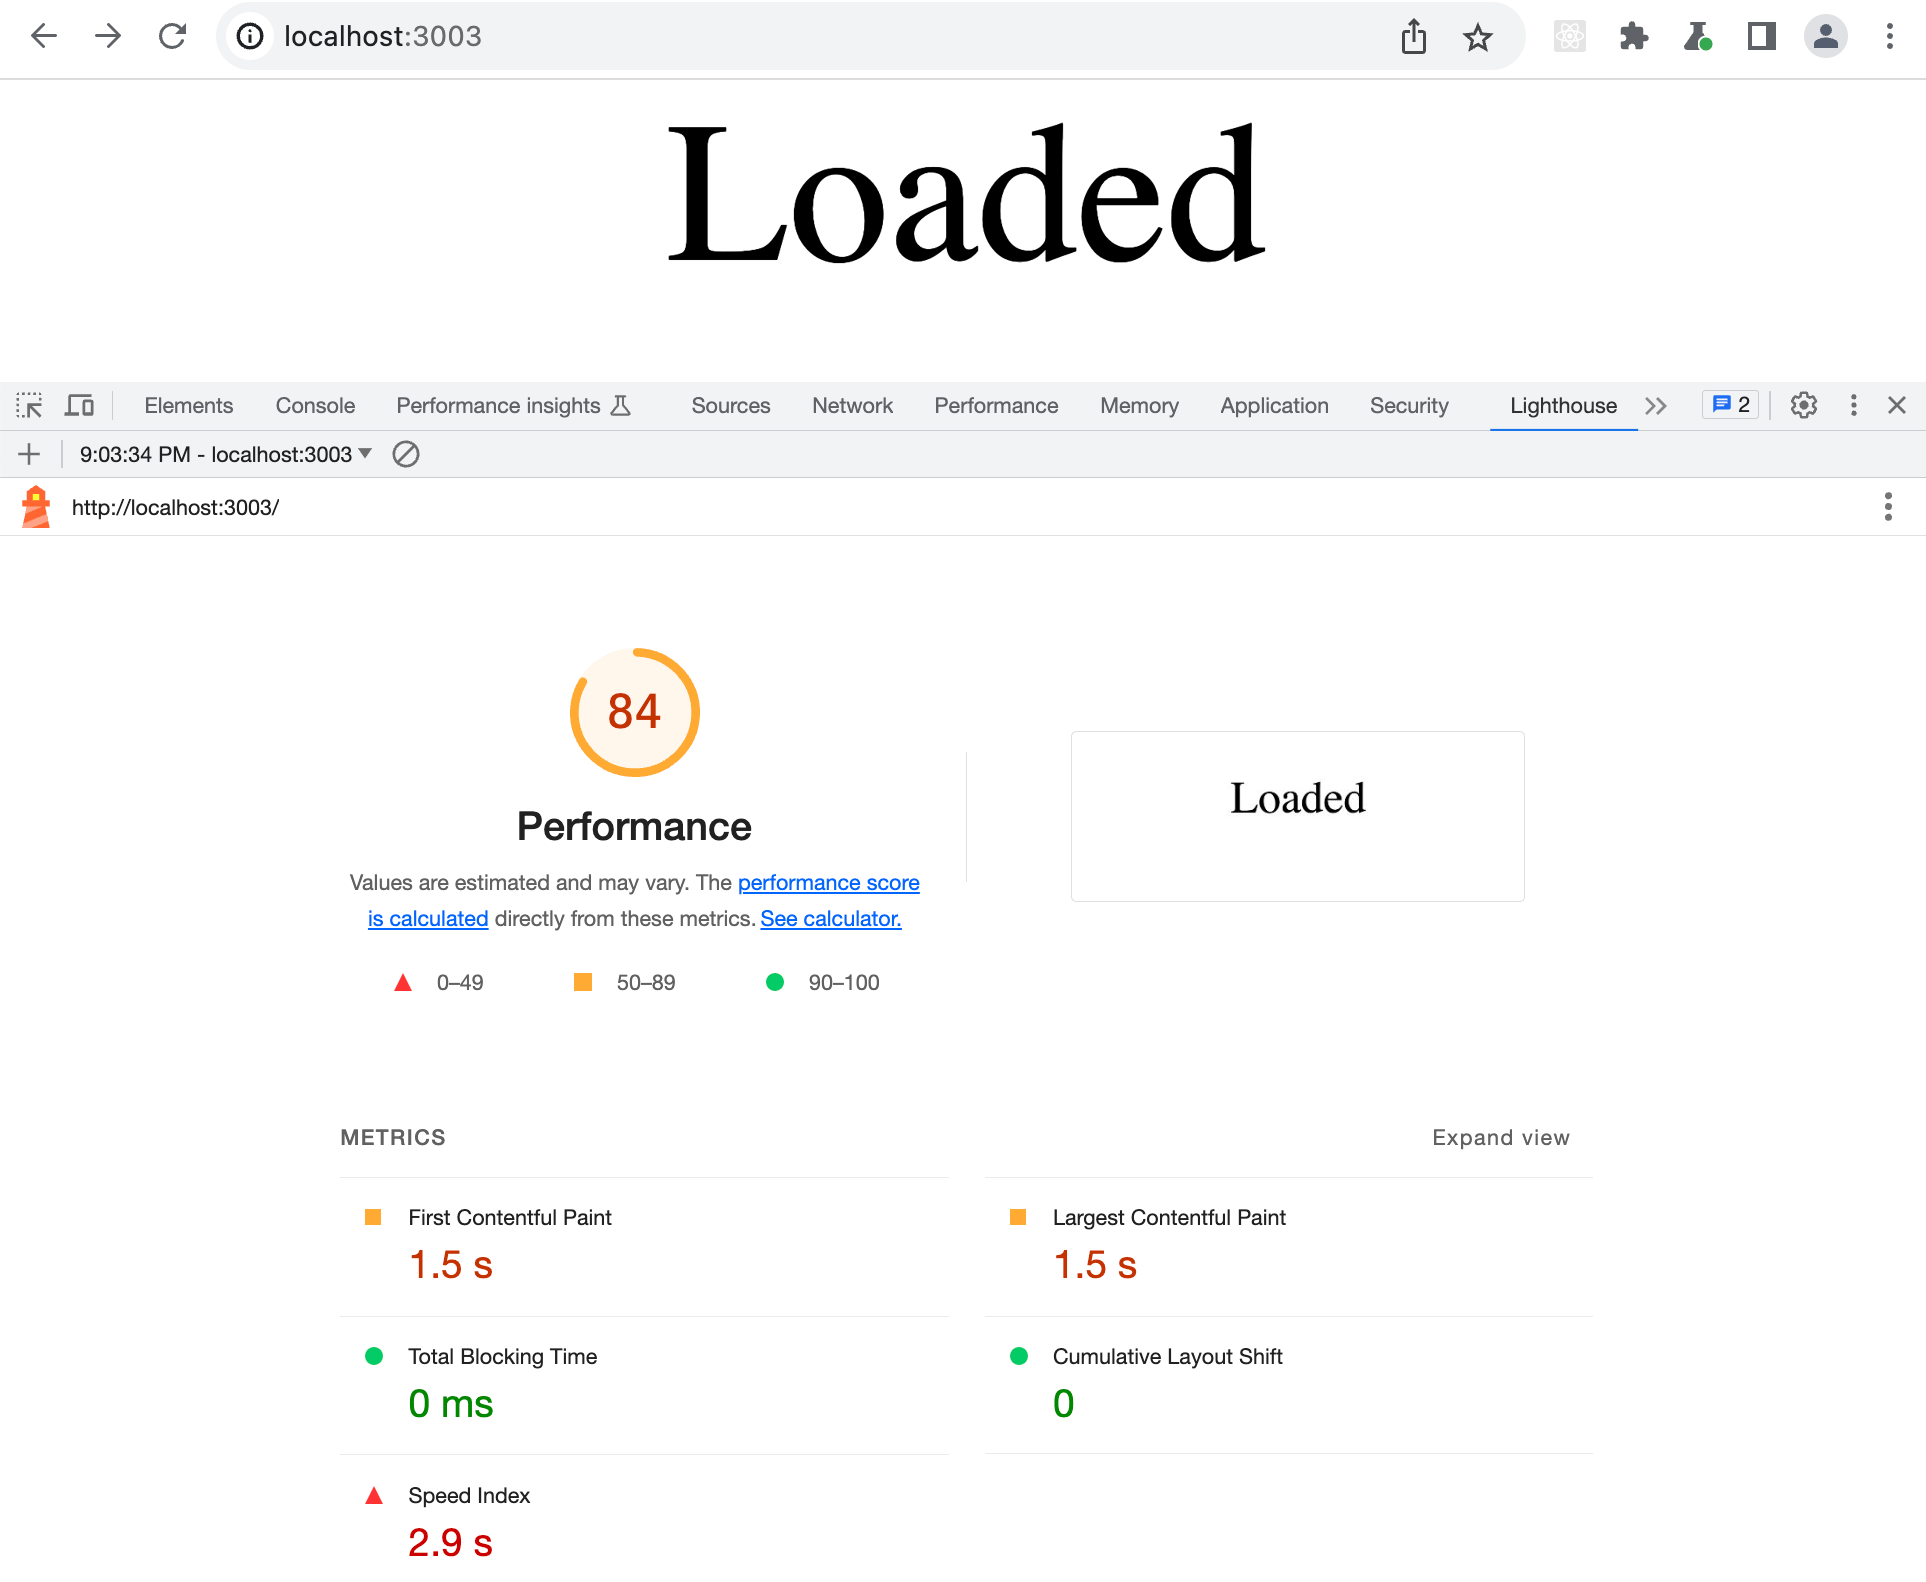
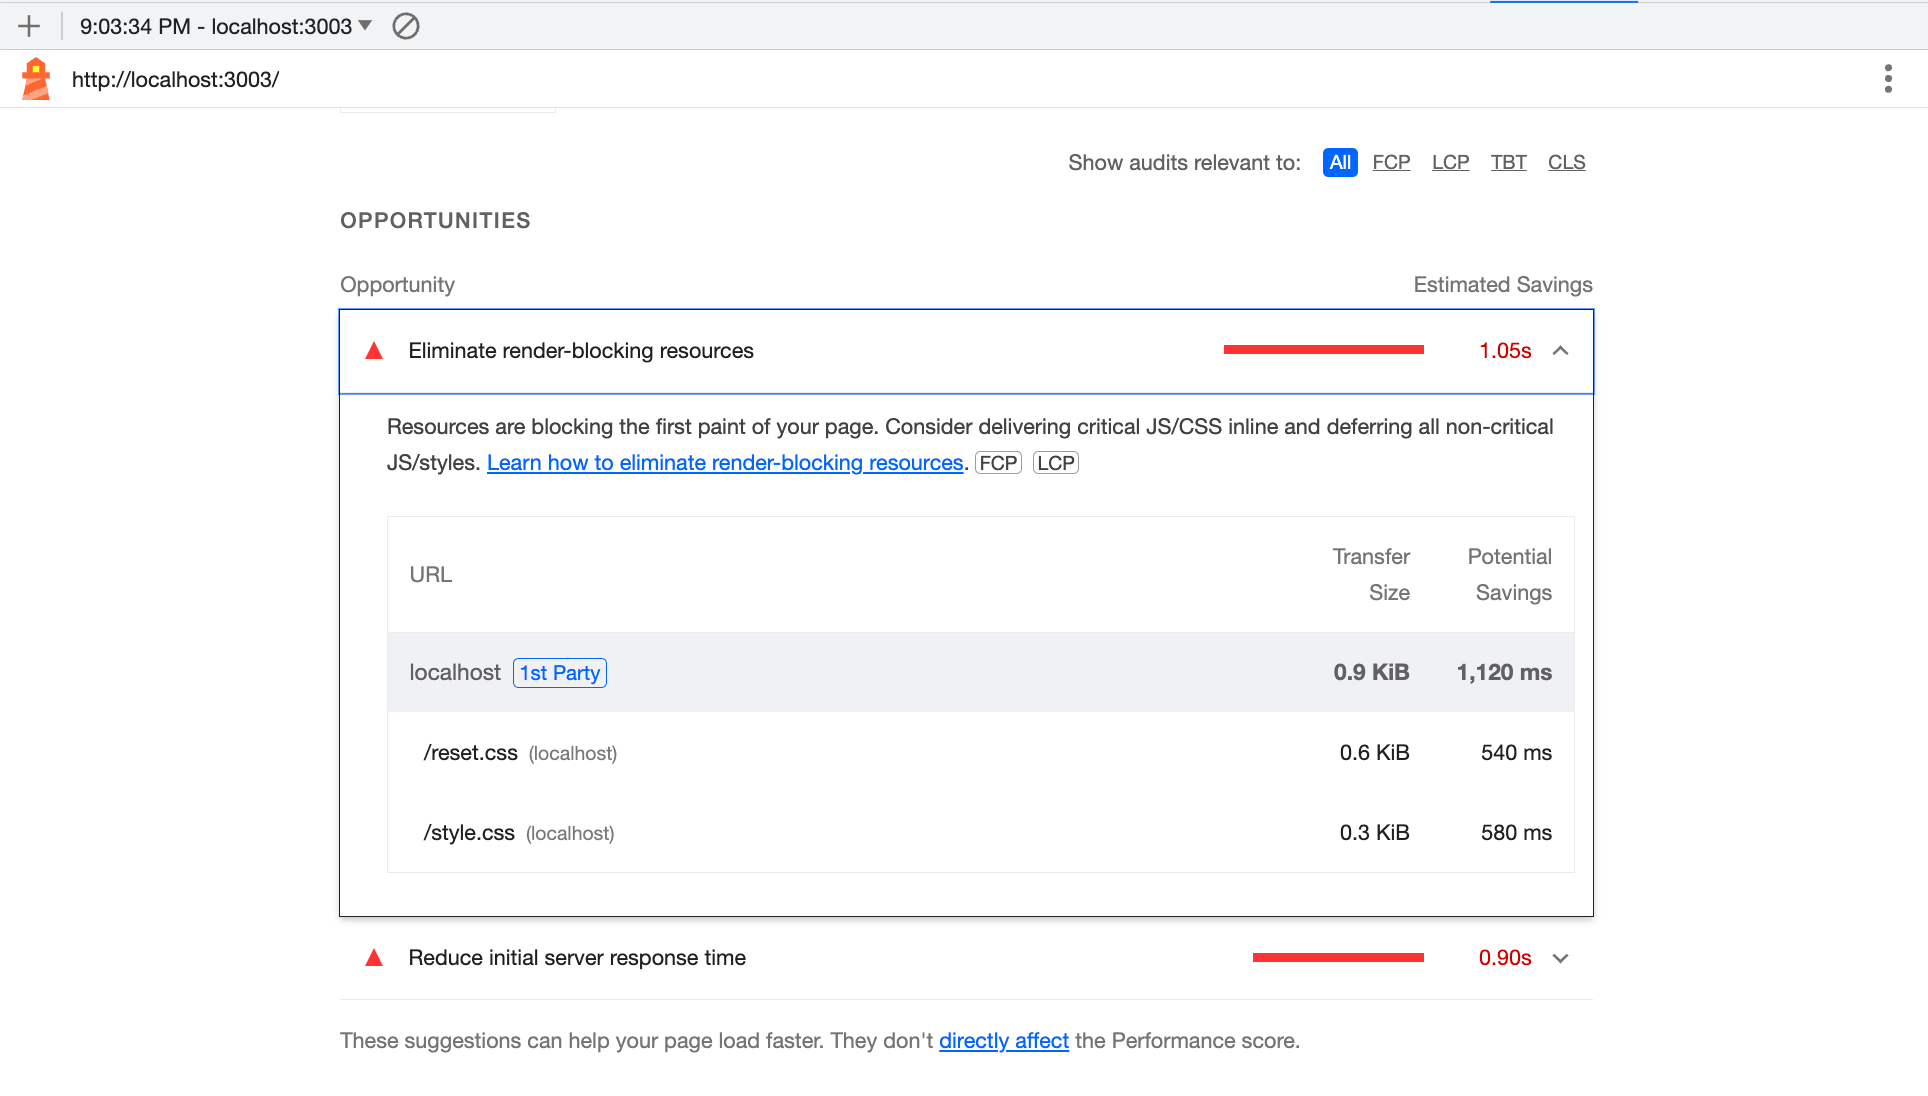
Notice how Lighthouse correctly found the bottlenecks in our page: the slow server taking too long to return the page and blocking CSS.
Reports
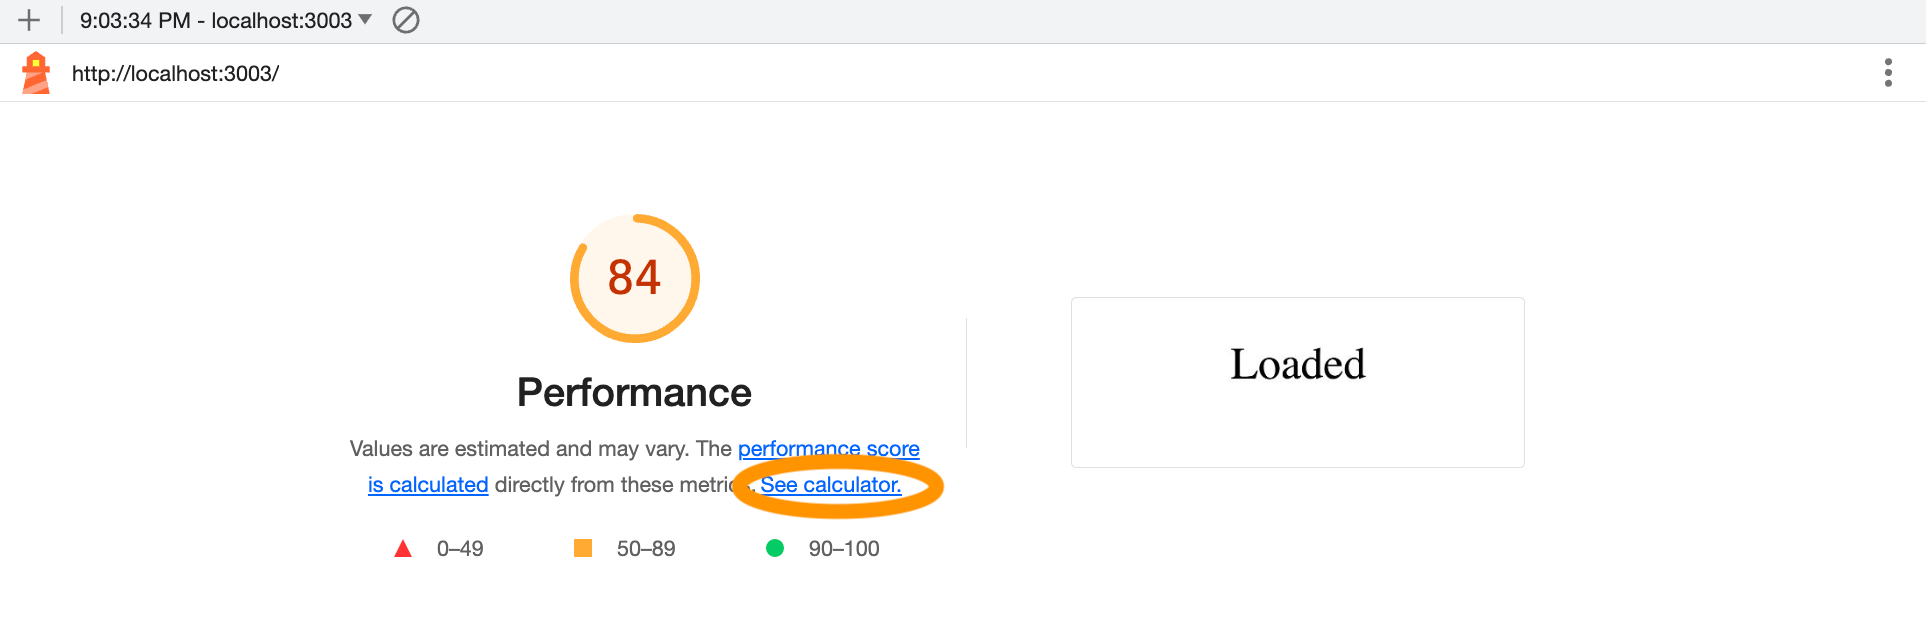
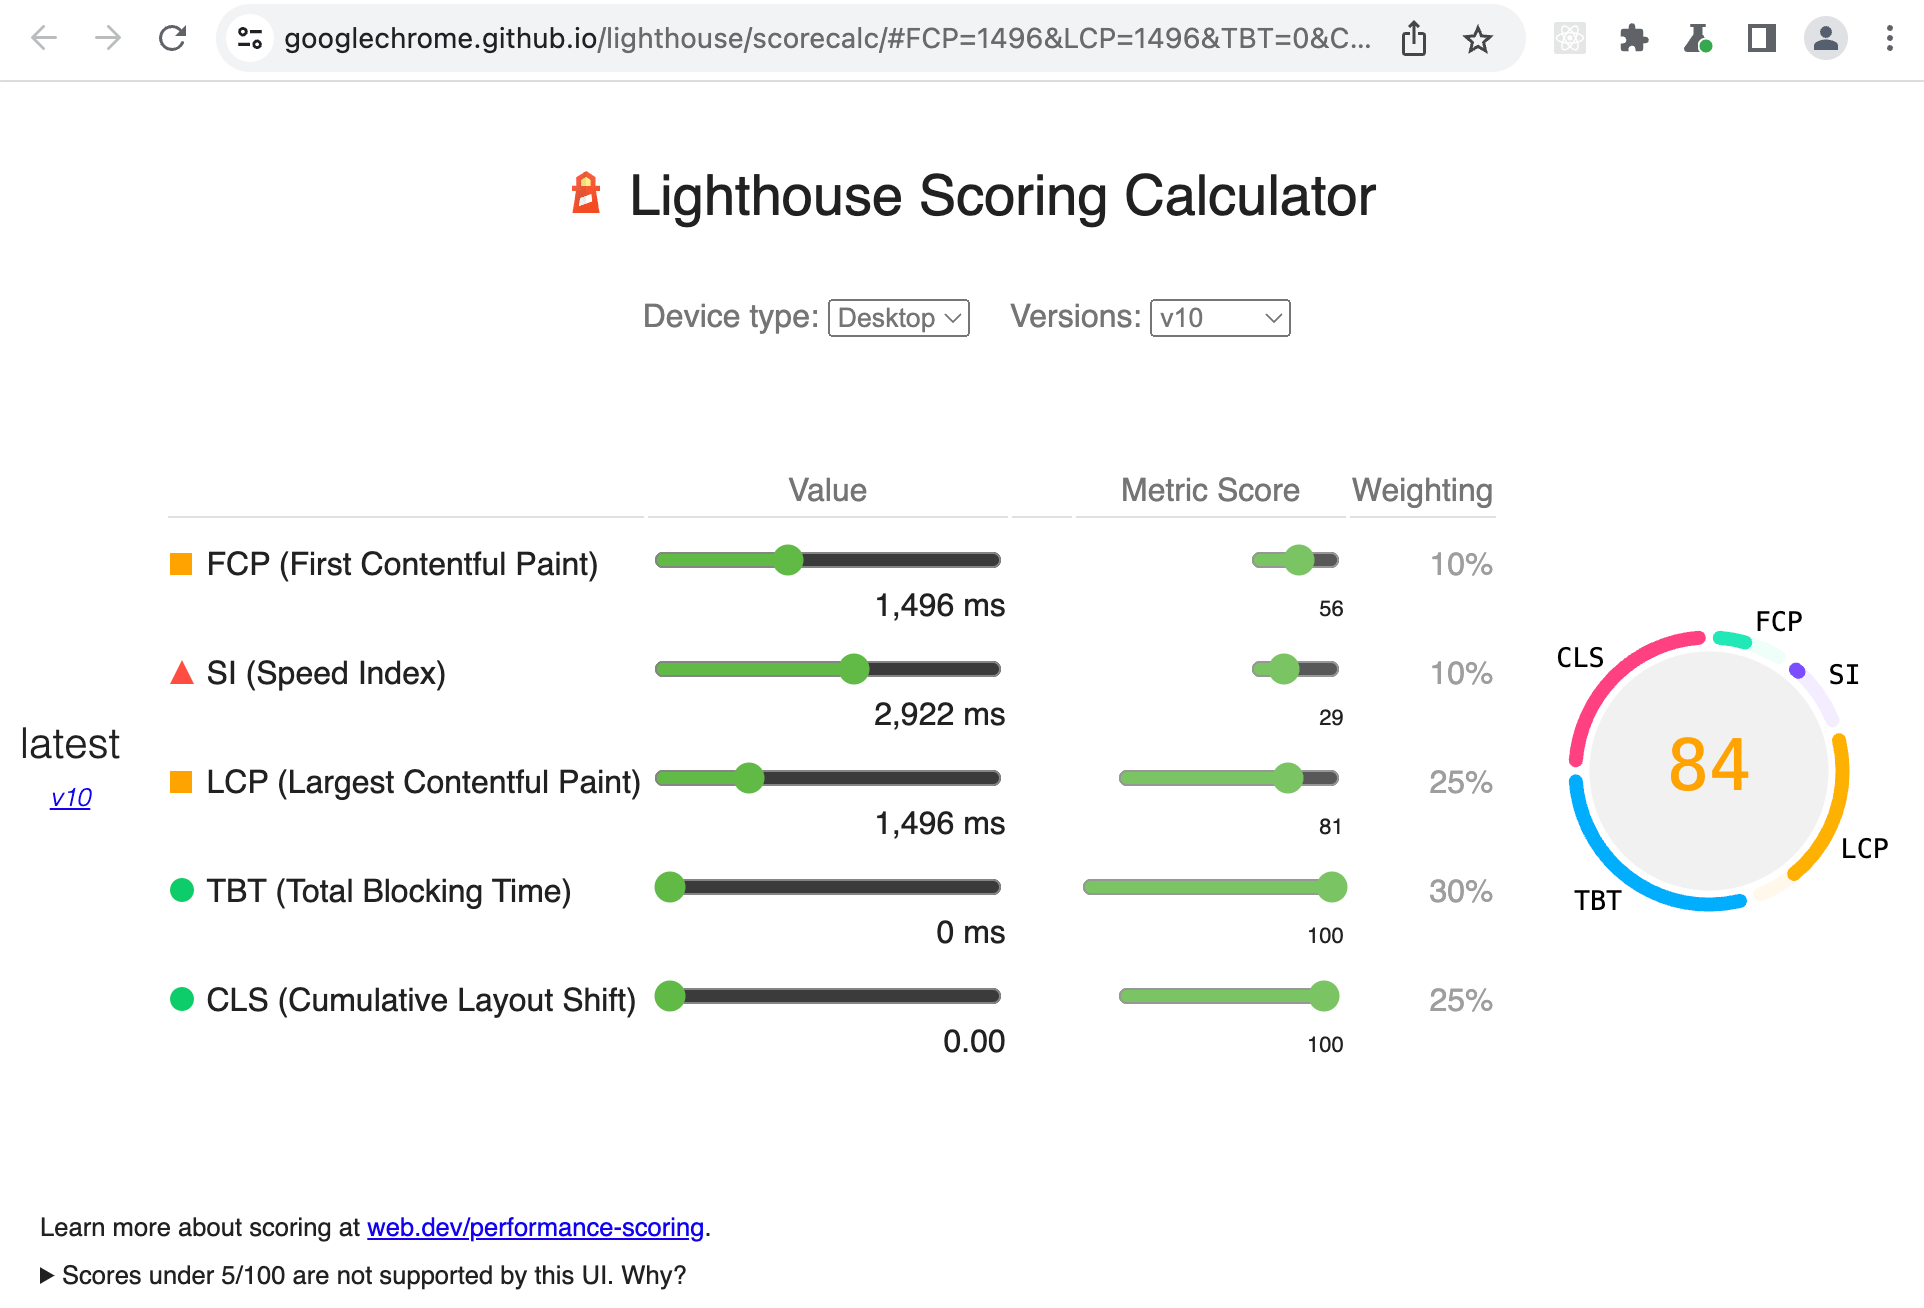
If you click on the "See calculator" link, you will see how the score 84 was calculated. Different Web Vitals are weighted to produce the final page performance score.
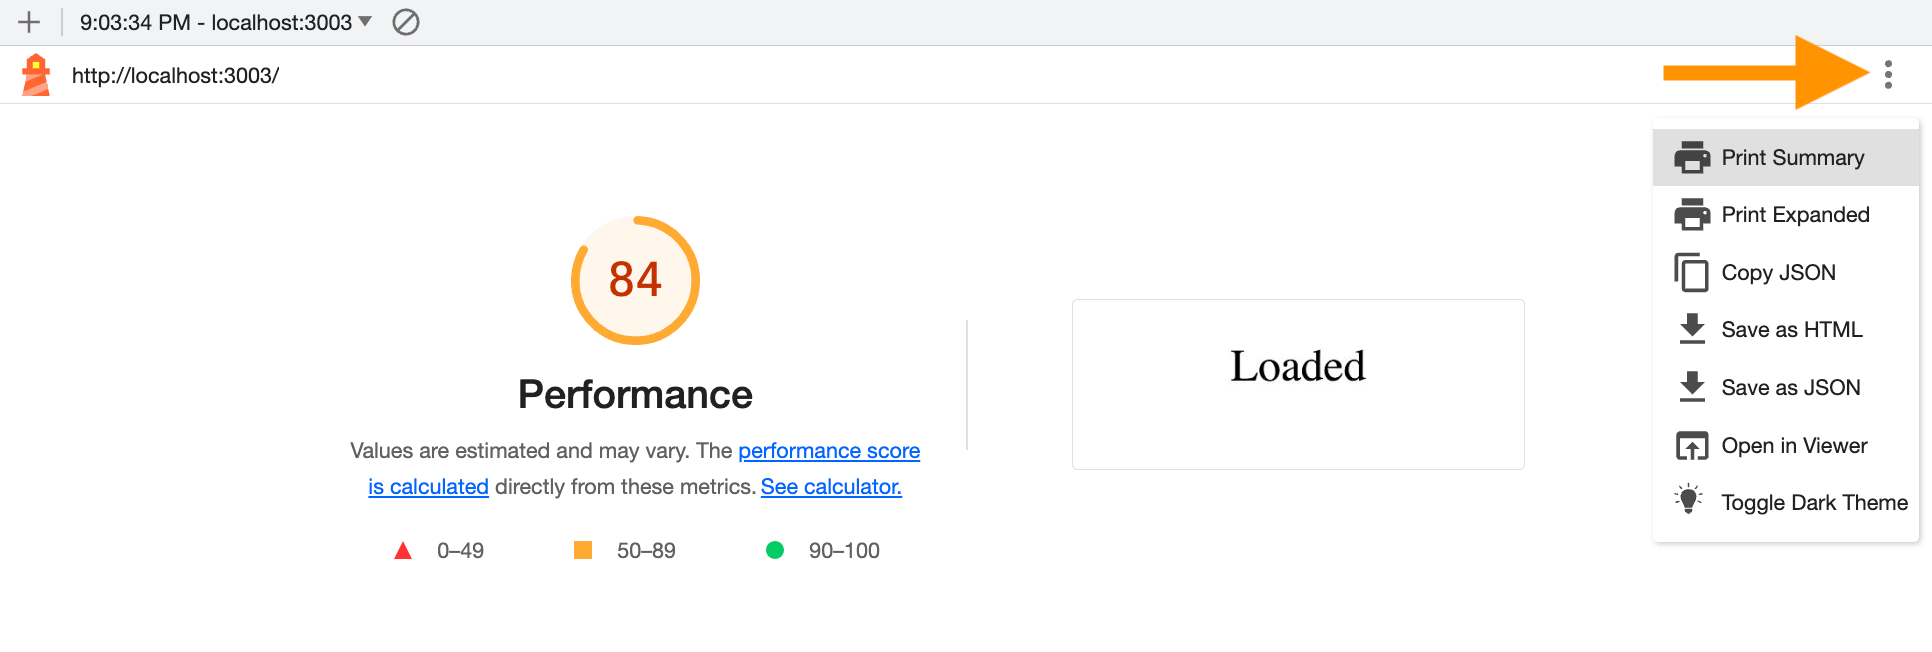
You can generate a PDF or HTML of this report using the menu in the top right corner.
Lighthouse CLI
Let's generate the same Lighthouse report from the command line. I will install both Lighthouse NPM module and my utility start-server-and-test to make starting the app and taking its performance a single command.
1 | $ npm i -D lighthouse start-server-and-test |
I will add a few NPM aliases to start the application and run Lighthouse without asking any prompts
1 | { |
Let's run the measure script.
1 | $ npm run measure |
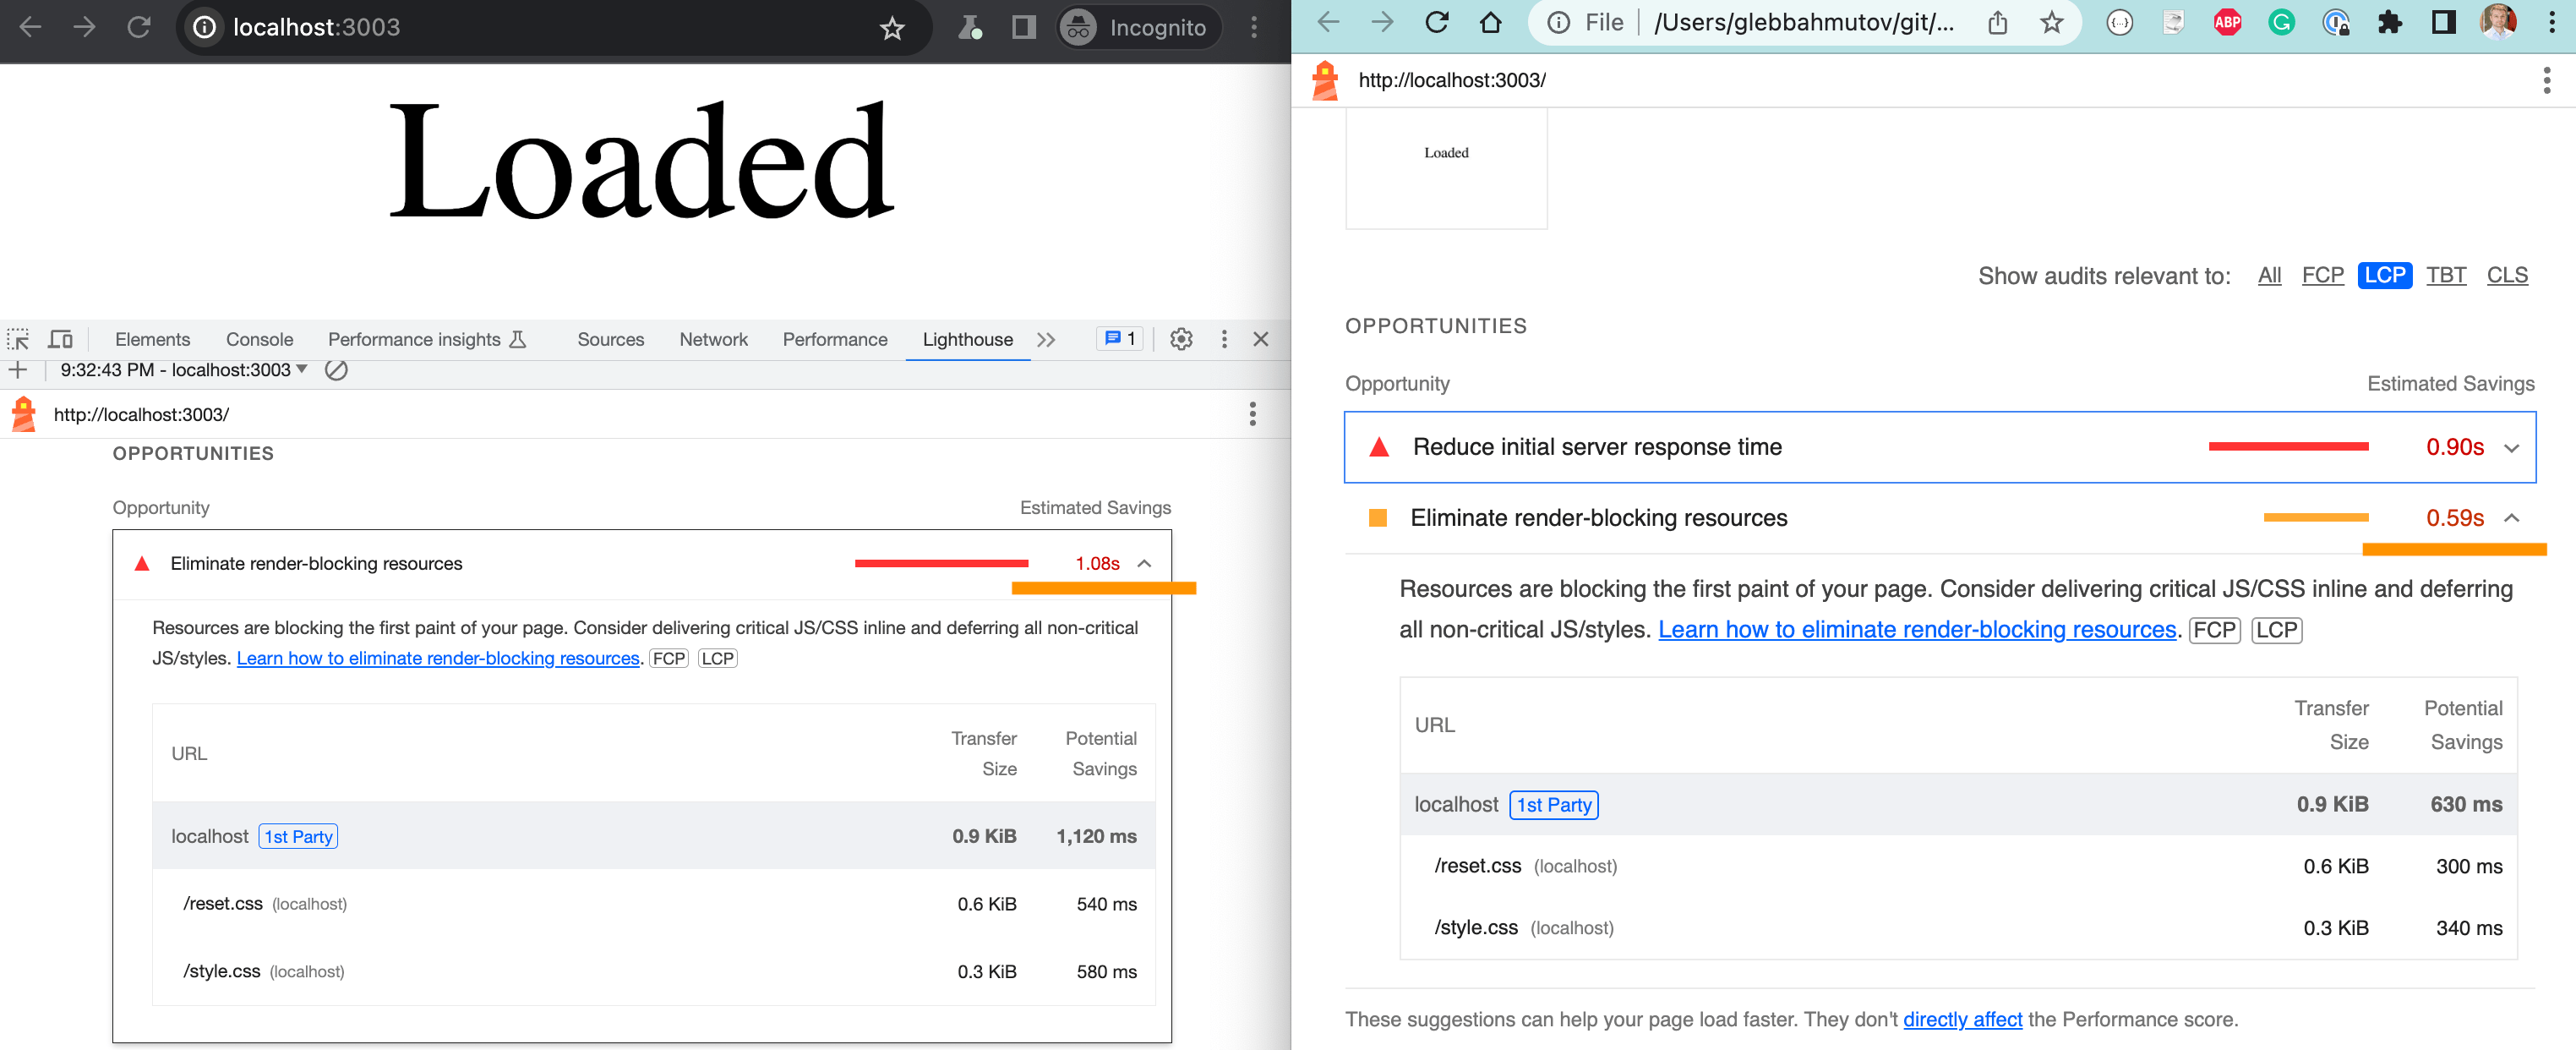
Let's open the generated static HTML file localhost_2023-06-14_21-22-50.report.html
1 | $ open localhost_2023-06-14_21-22-50.report.html |
The report shows slightly different score from running Lighthouse panel:
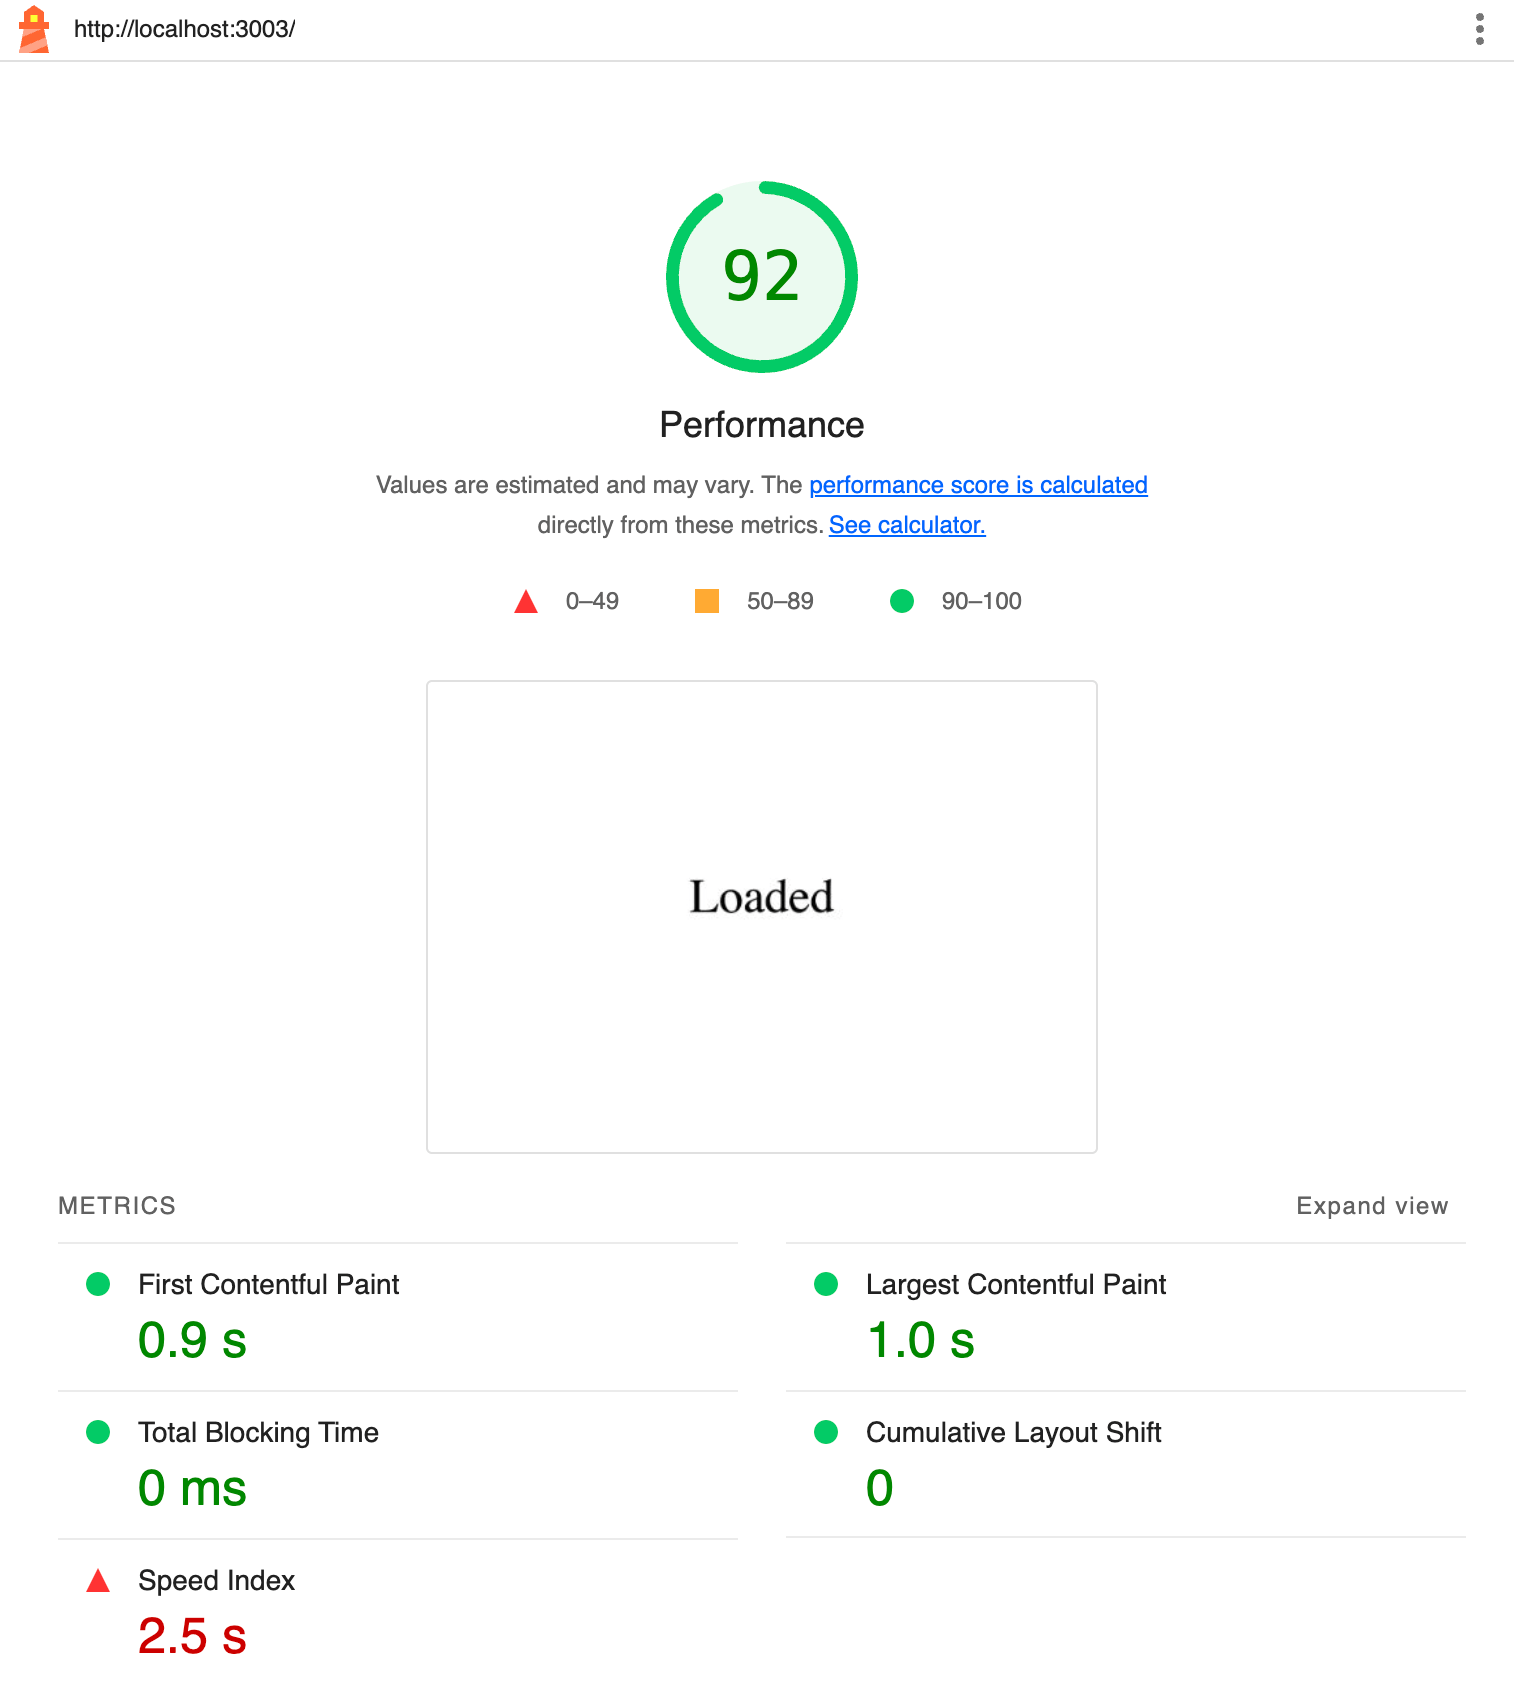
The difference seems to be in the initial loading of the page for some reason: the CLI reports 600ms vs 1000ms for the index page.
I am still learning why such differences exist.
Tip: here are some of the Lighthouse CLI flags I use right now:
1 | lighthouse http://localhost:3003 // URL to audit |
You can also generate reports in several formats: HTML, CSV, JSON. For example, to generate both HTML and CSV reports and overwrite the existing files, use --output html,csv --output-path=./lighthouse-results.html which creates lighthouse-results.html and lighthouse-results.csv files.
Set performance budget
Let's say we are happy with the performance score 92 and want to keep the site this fast. We can set the performance budget and make Lighthouse fail if the performance score drops below 92.
1 | [ |
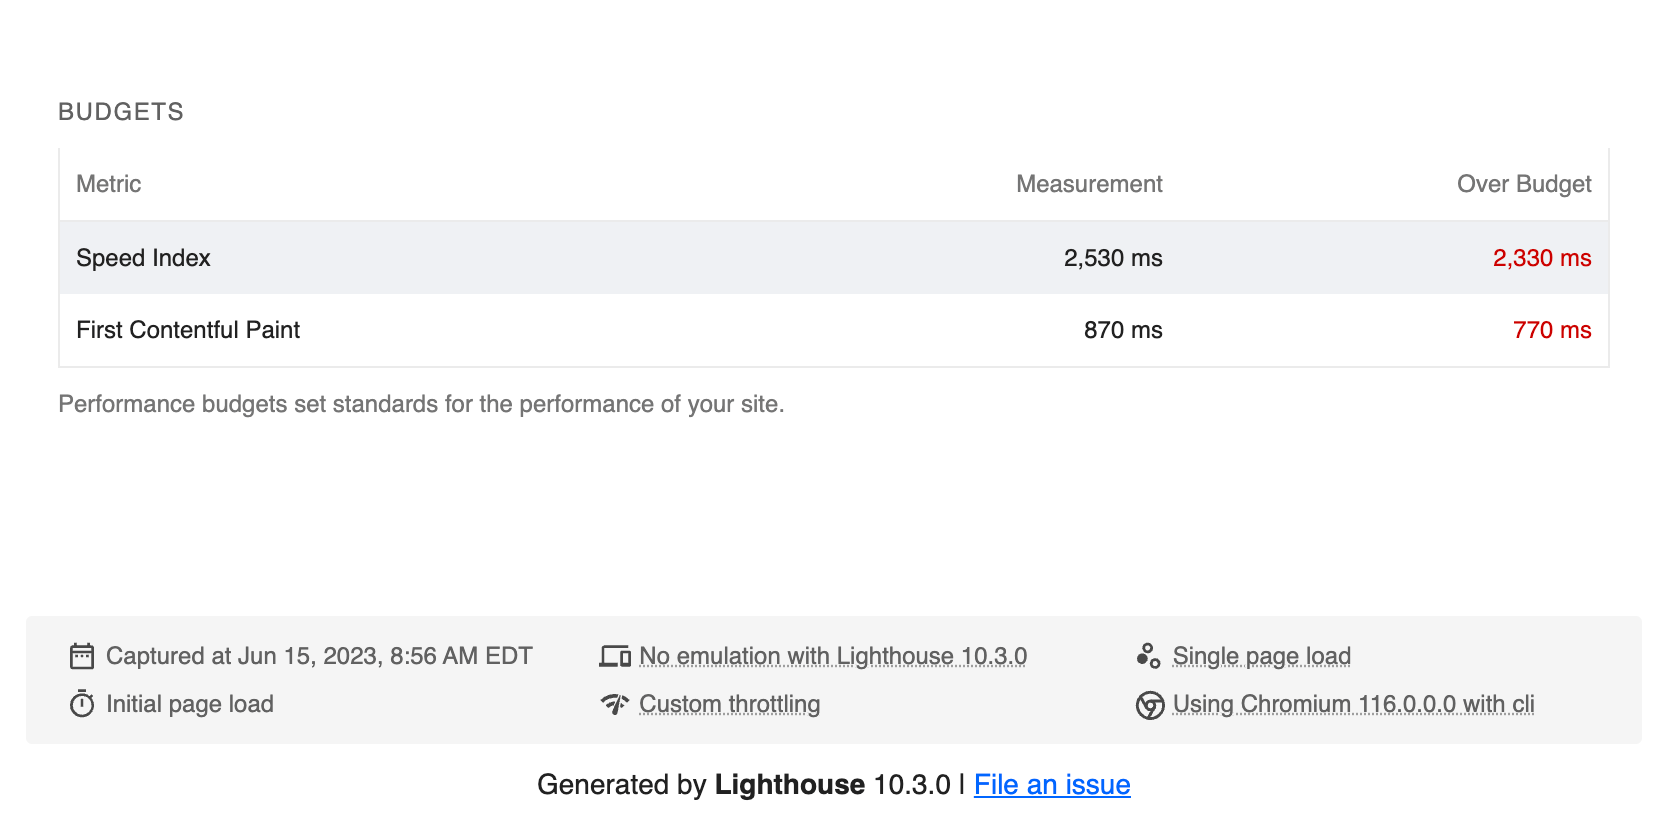
We set the very low metric limits on purpose. The analysis should run with CLI flag
1 | $ lighthouse http://localhost:3003 --budget-path=budget.json ... |
The process exists with code 0, but the generated report shows the metrics that are over the budget
Lighthouse on CI
We cannot stop the build if our site is over the performance budget using Lighthouse CLI. Instead we can use Lighthouse-CI which grabs the measurements and lets us fail the build if there is a slowdown.
Let's create the initial Lighthouse CI configuration file. It uses JavaScript, and at first I will just put our starting command and URL there
1 | module.exports = { |
The GitHub Actions workflow installs dependencies and runs the Lighthouse CI (LHCI) using the above configuration
Tip: you can read my blog post Trying GitHub Actions to get familiar with GHA.
1 | name: performance |
By default LHCI runs Lighthouse 3 times and measure everything using a mobile device emulation
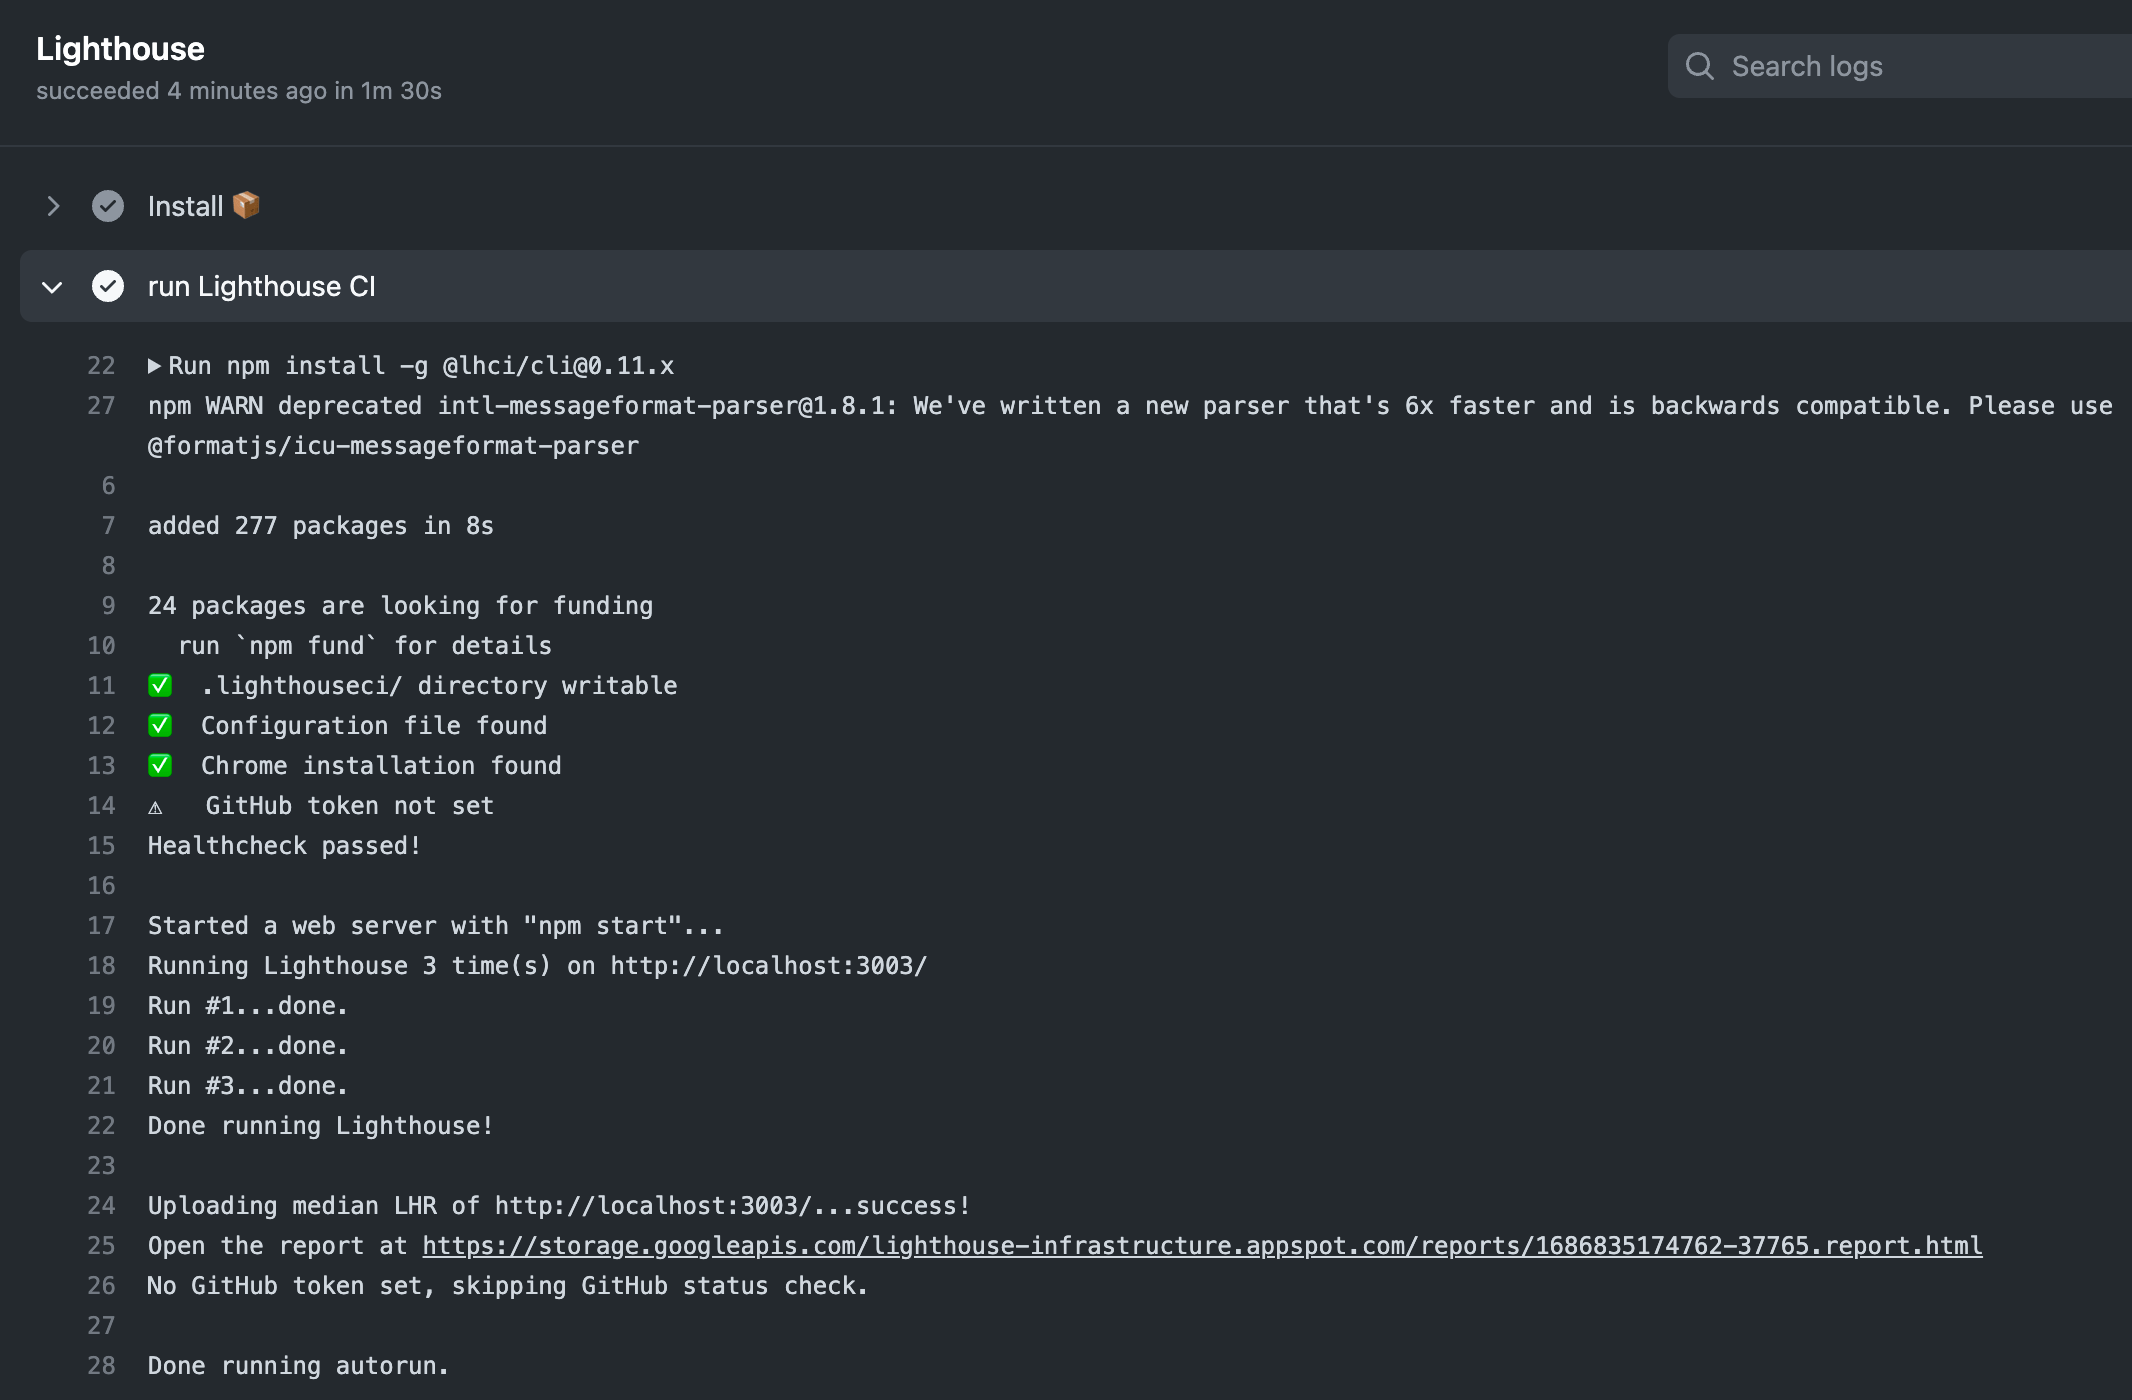
Because we configured LHCI to upload the report to public storage, we can open the displayed URL to see the HTML report
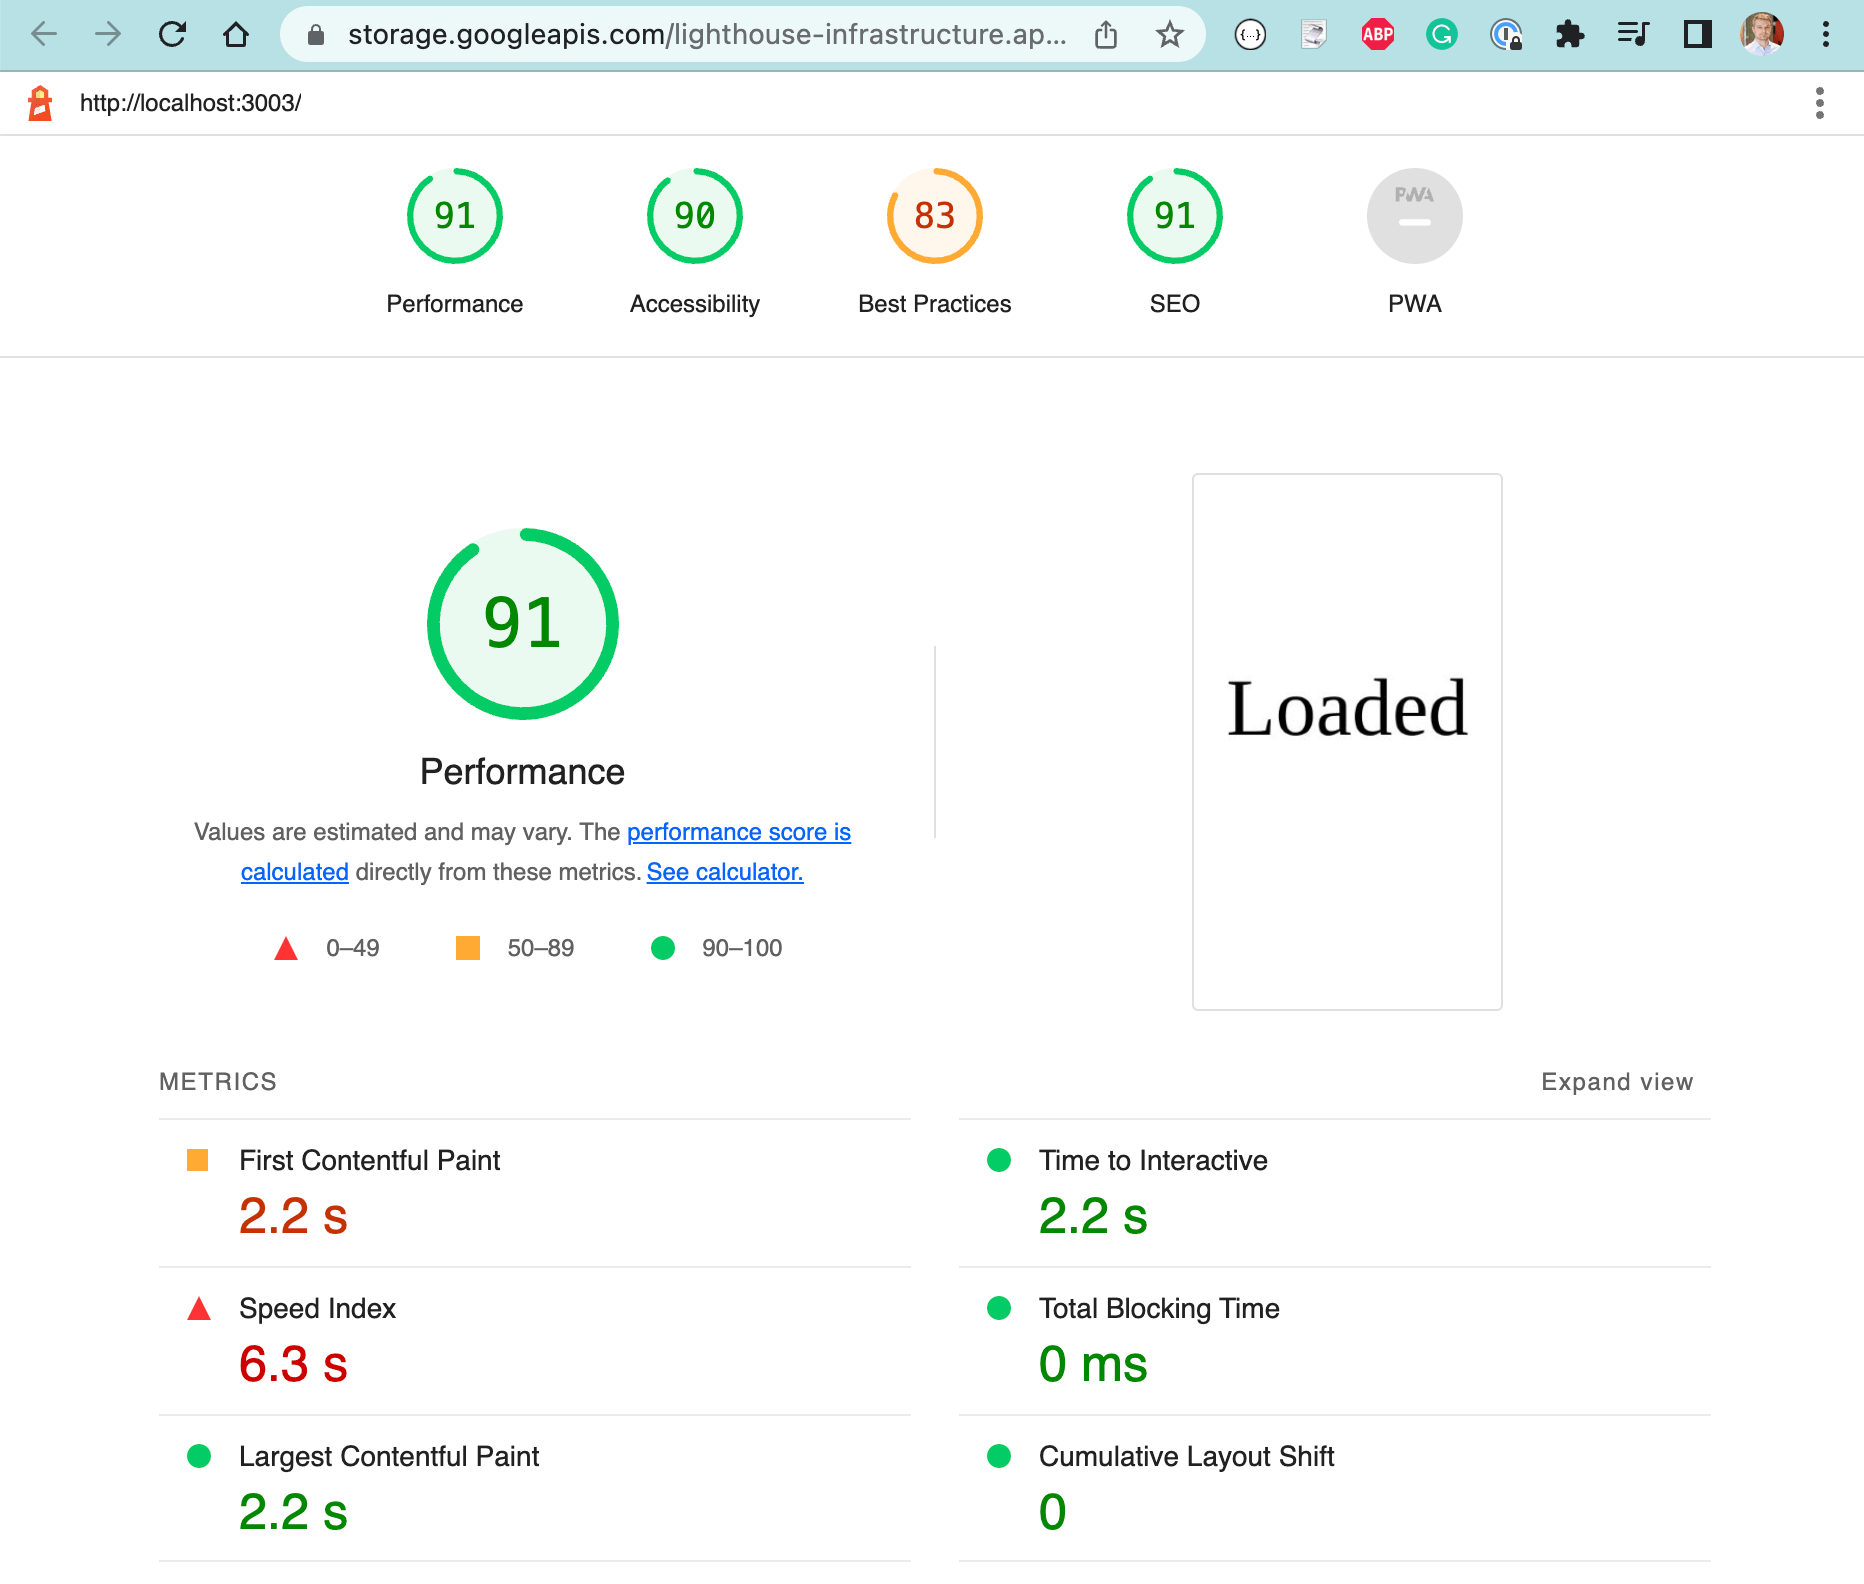
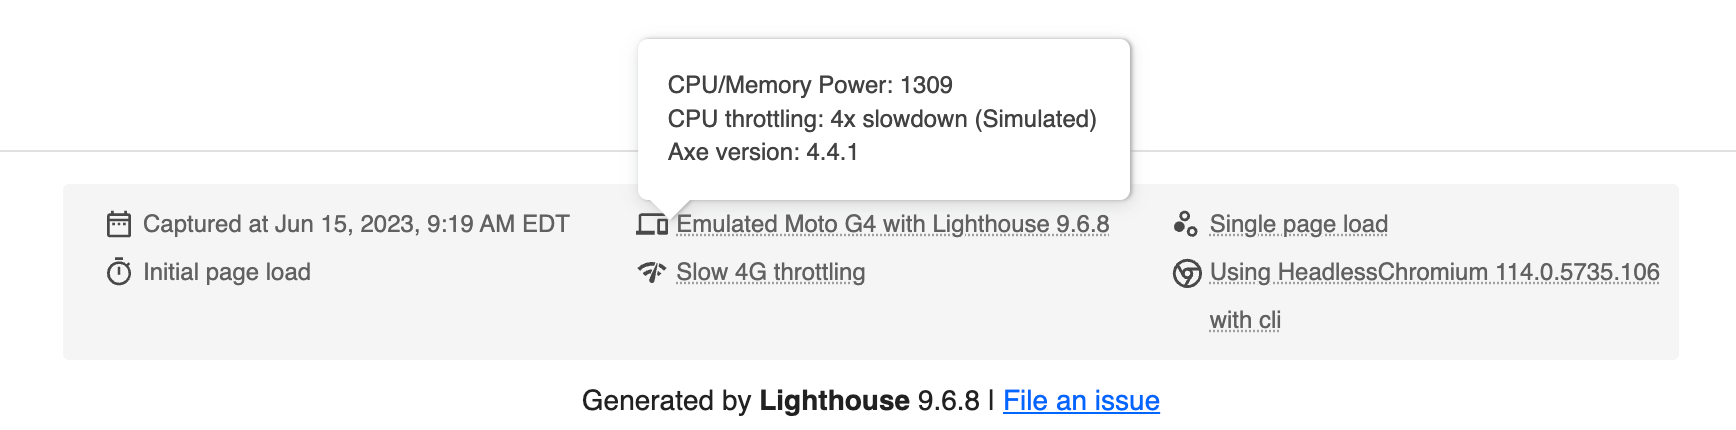
Again, keep in mind that this is a performance report for mobile emulation, as shown at the bottom of the report.
Let's run LHCI with the same settings as Lighthouse CLI. We can put all CLI arguments under the settings object in the resource file
1 | module.exports = { |
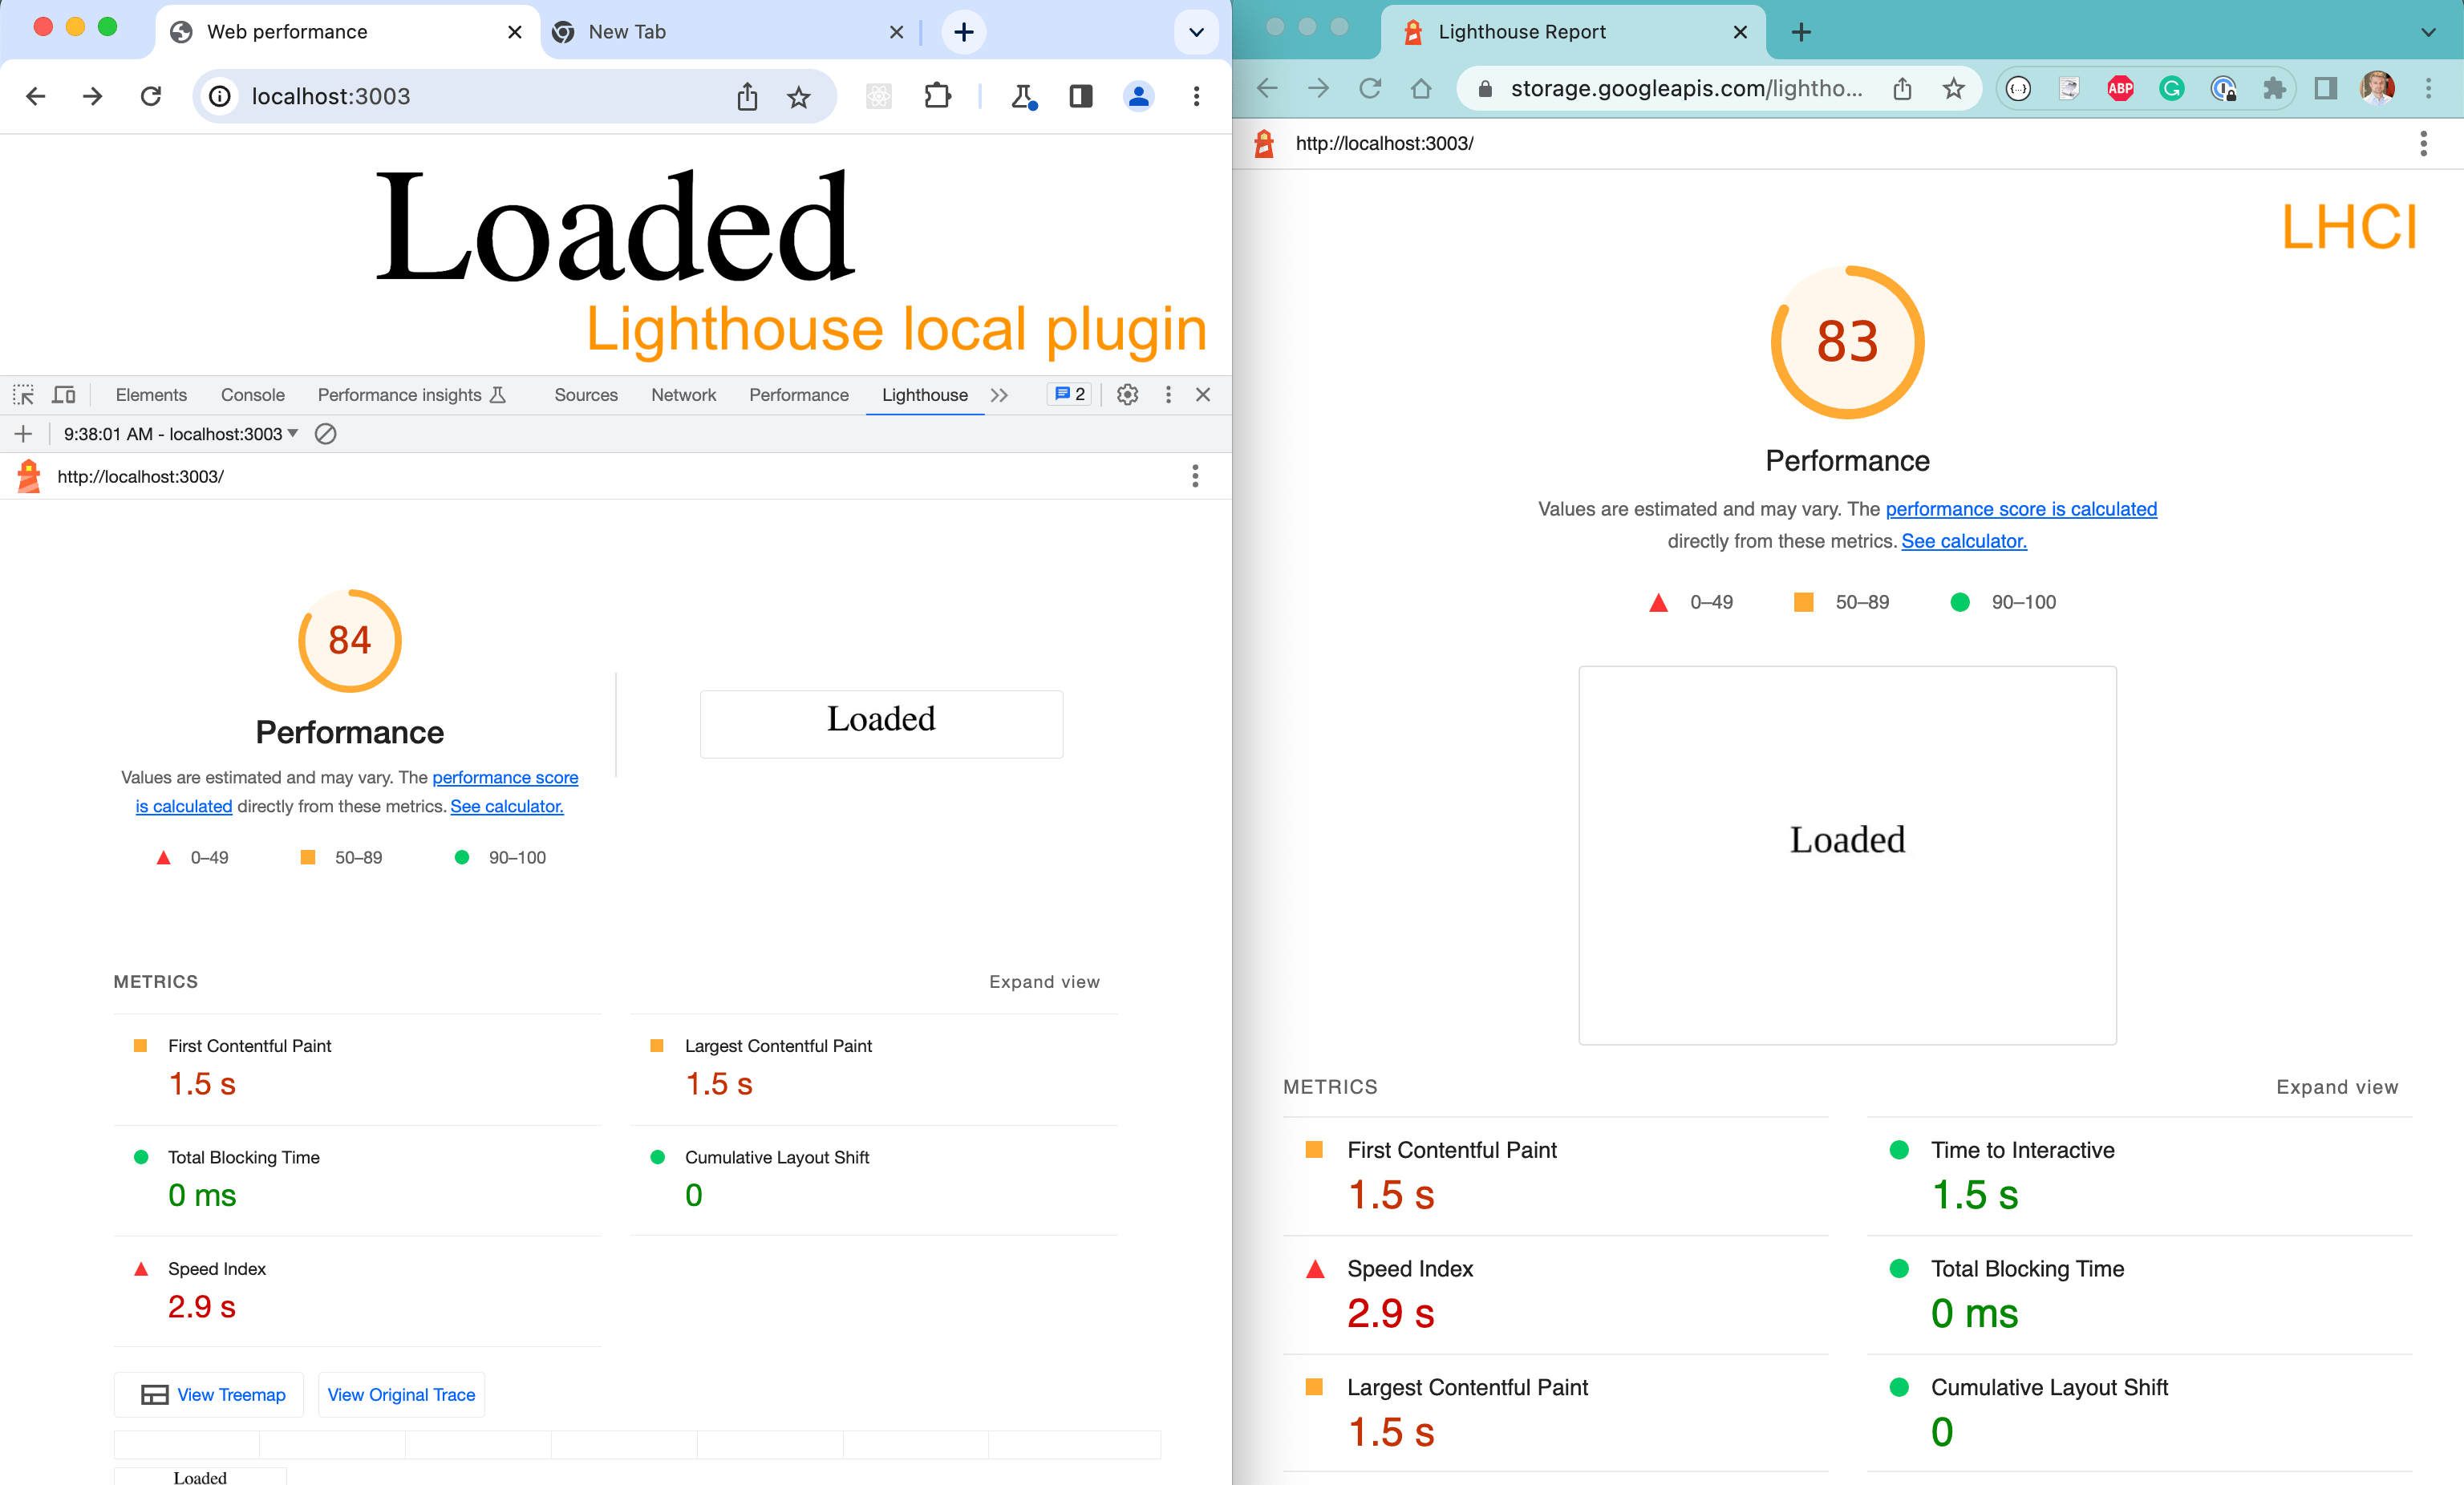
The LHCI runs on GitHub and generates a report closely matching what I see locally using Lighthouse Chrome DevTools panel.
Fail on low performance
Now lets add assertions to our LHCI configuration to fail this step if the performance is too low. To show the failure I will set the performance score to 90 instead of 80.
1 | module.exports = { |
Let's push the code to GitHub and watch it fail
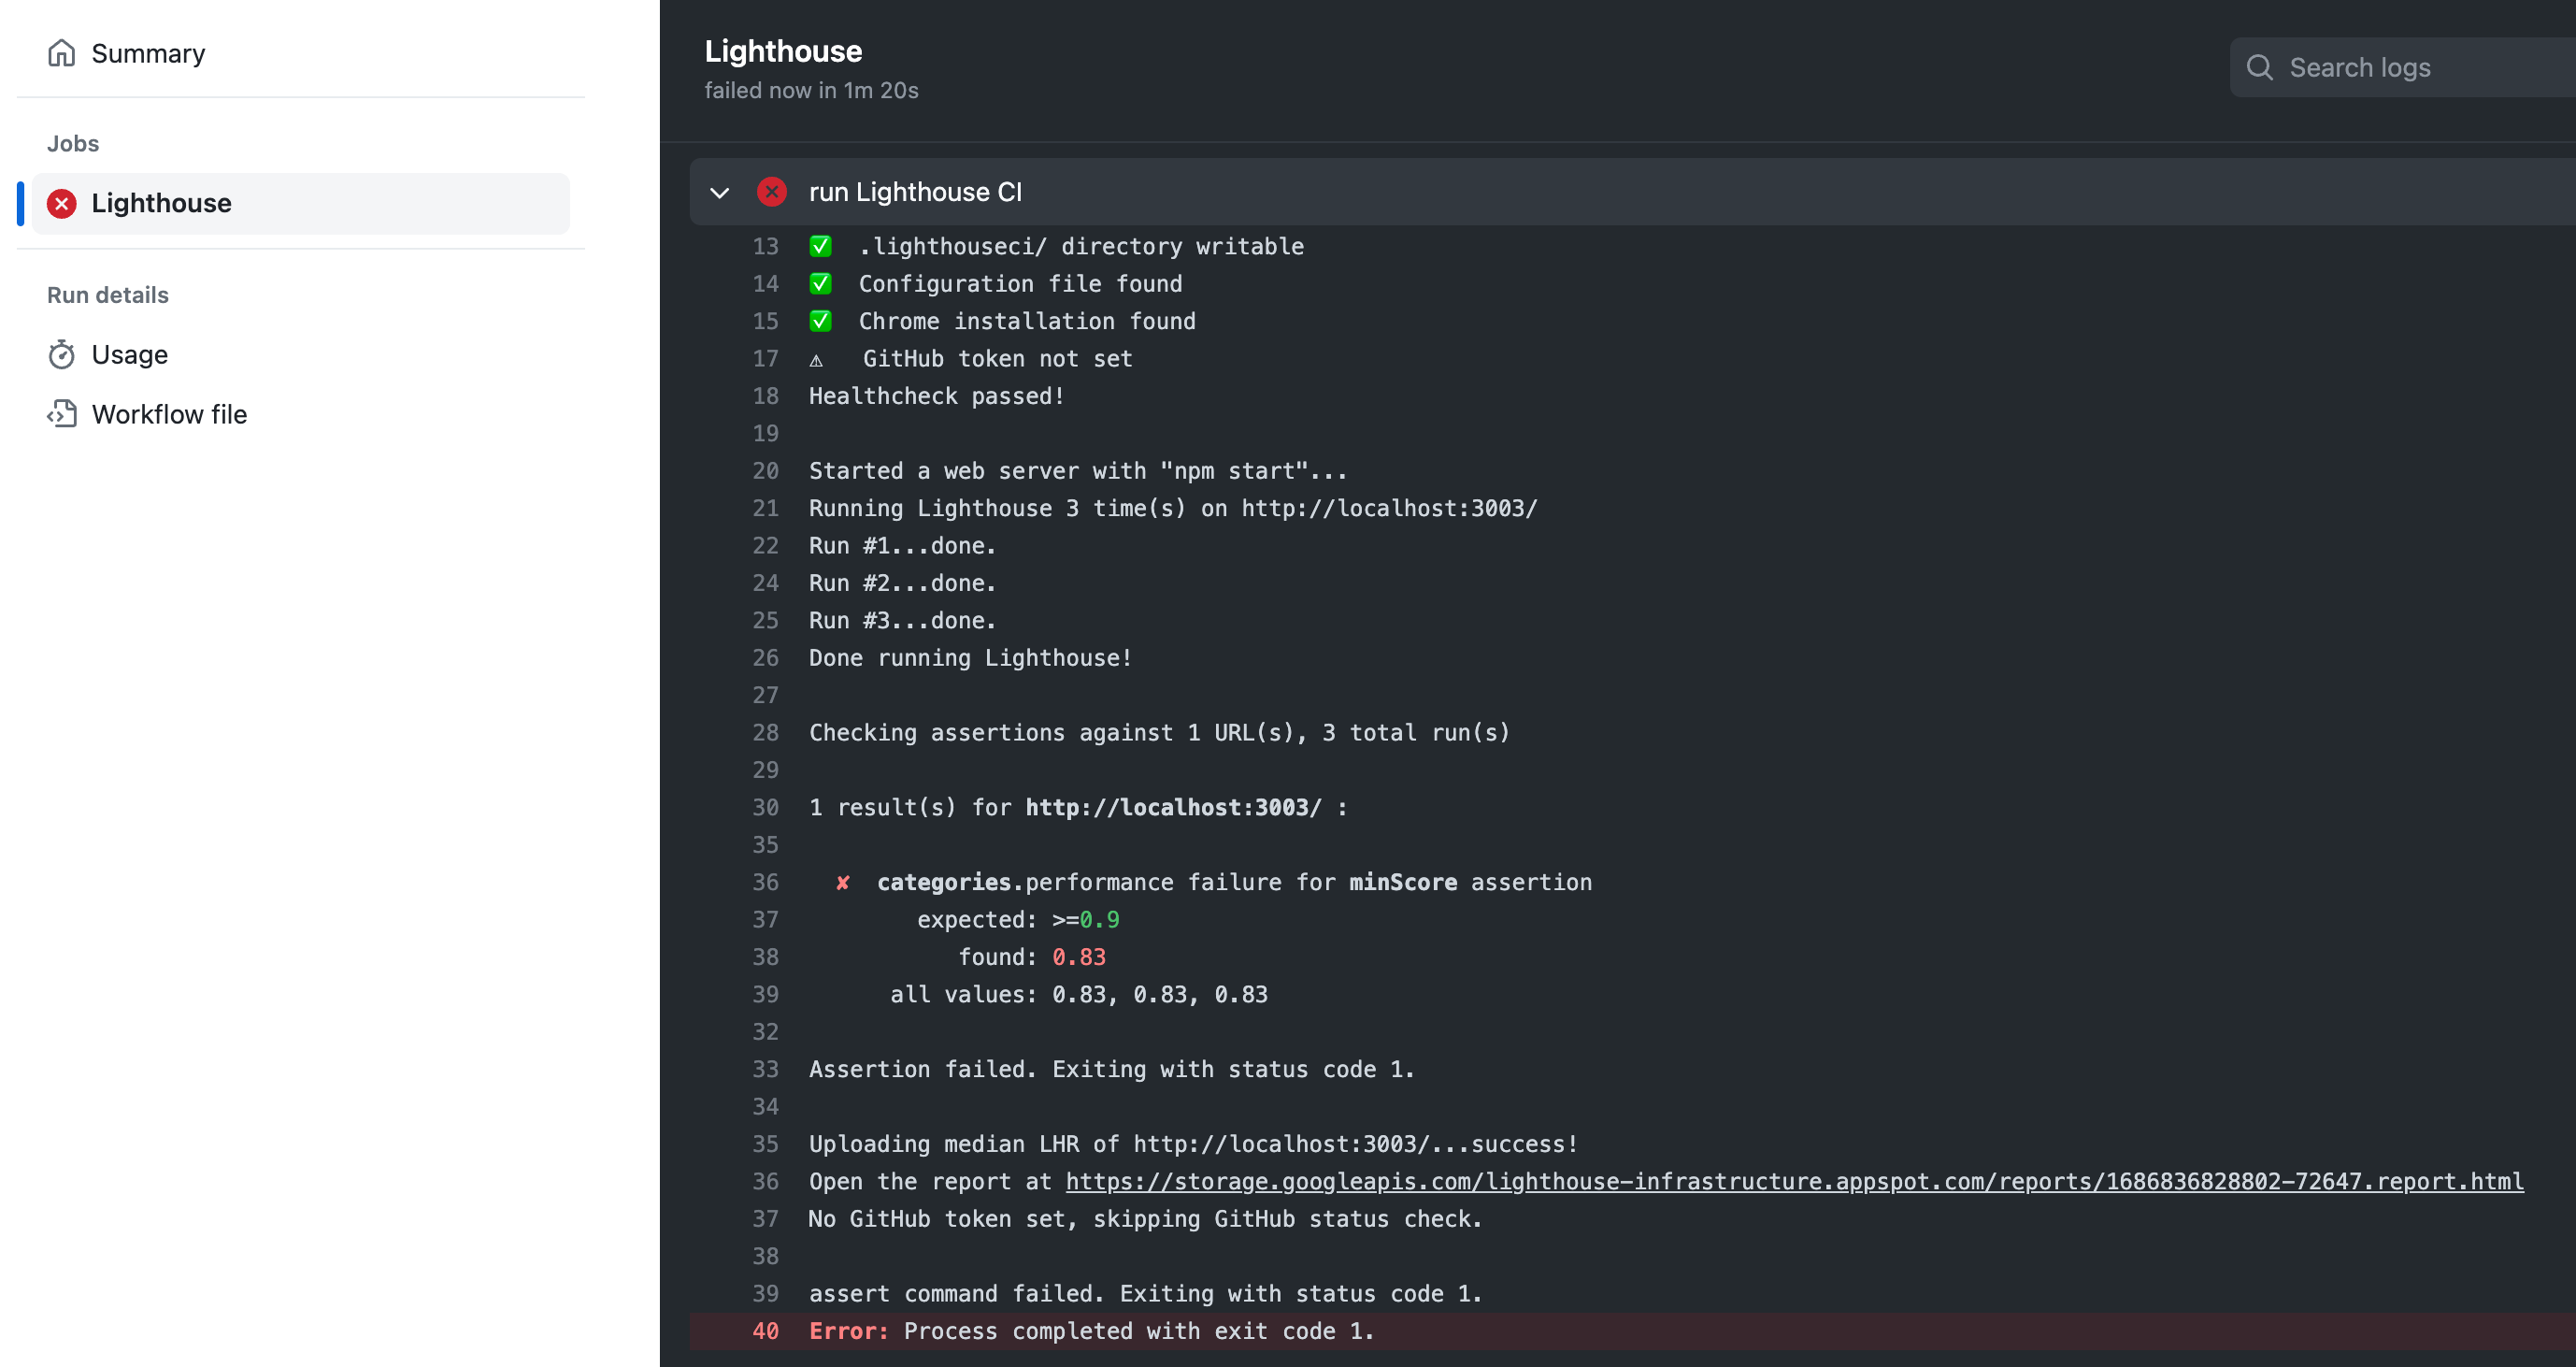
Ok, now we know the CI will catch a performance regression, and I will set the performance minScore to 0.83
Tip: you can overwrite the url to test from the command line lhci autorun --url <url to test>
Lighthouse GitHub status checks
You could add commit status checks using either your personal GitHub token or by installing the Lighthouse GitHub App.
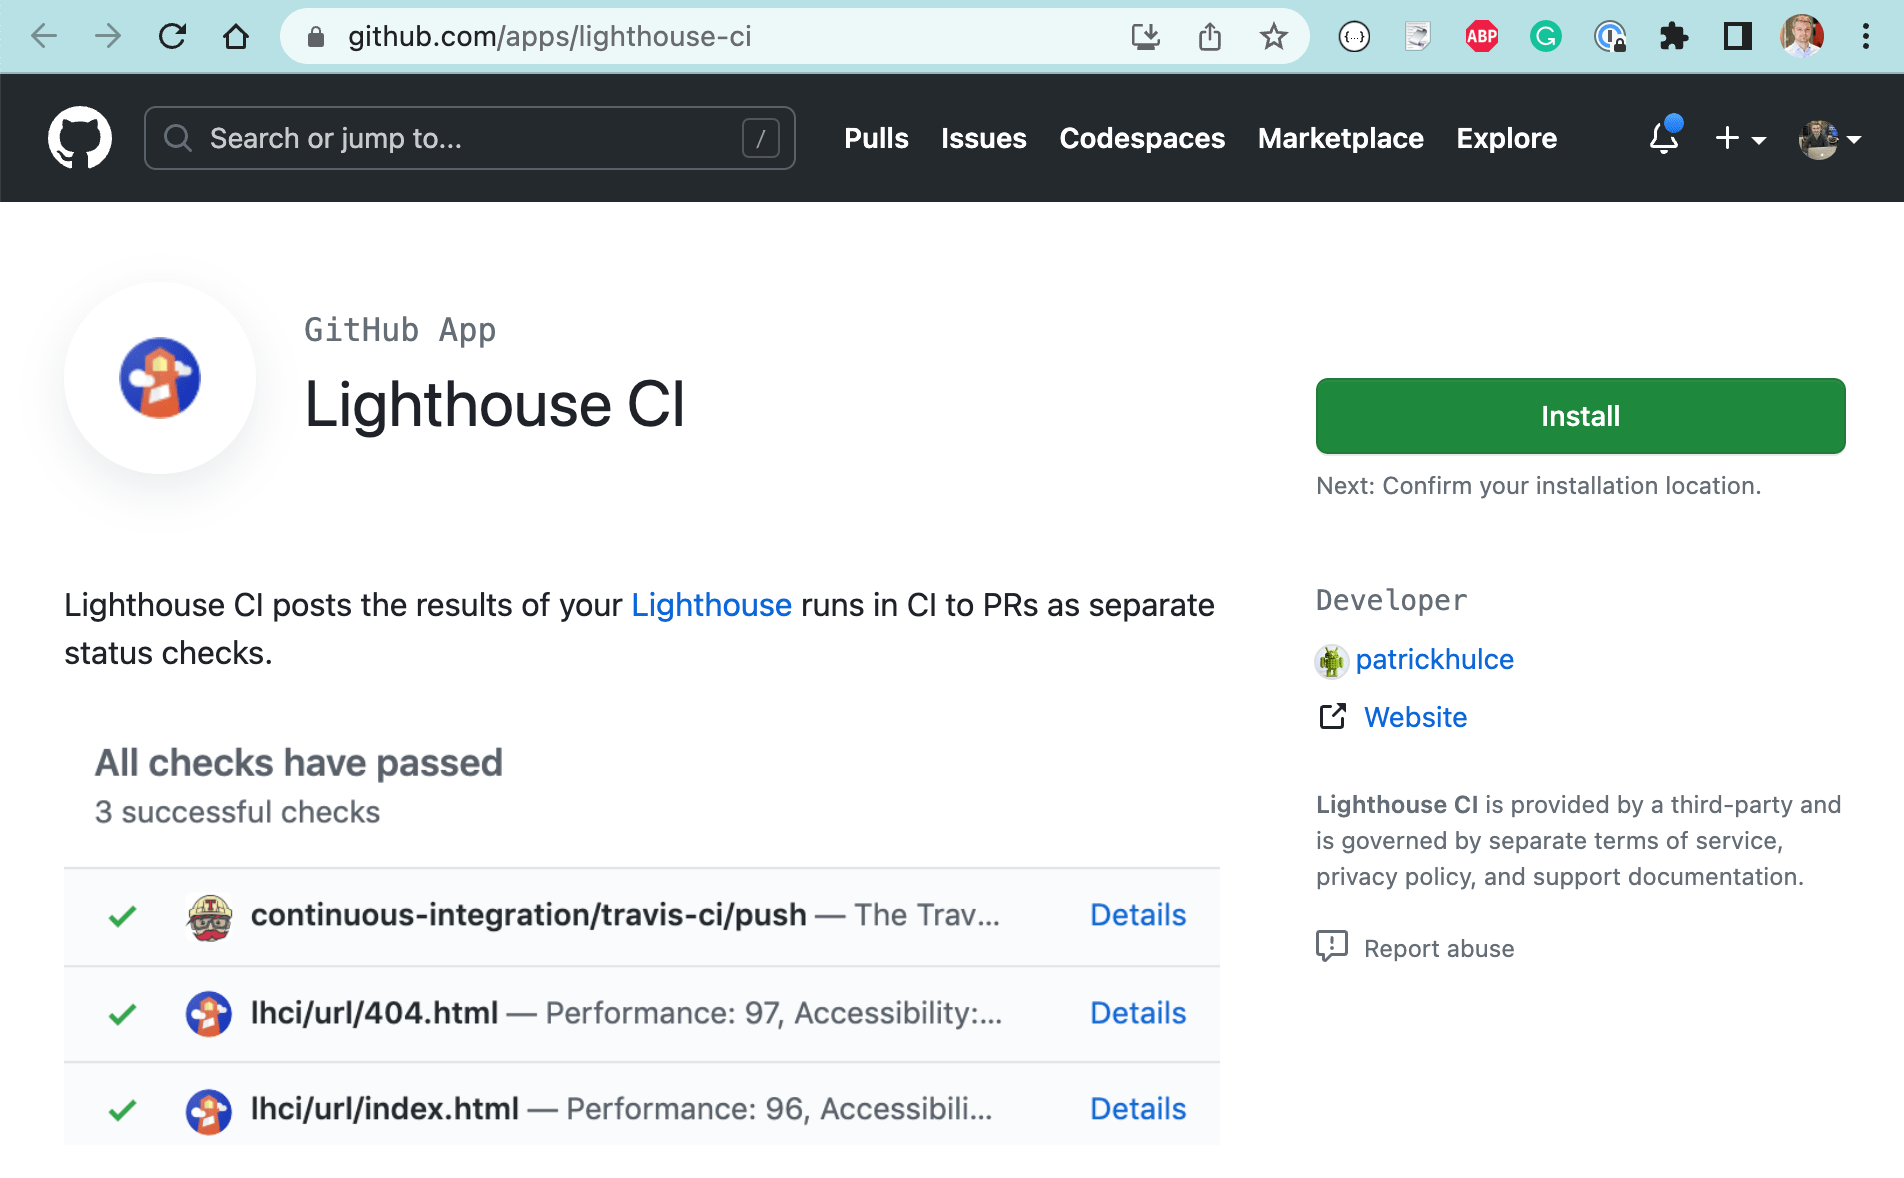
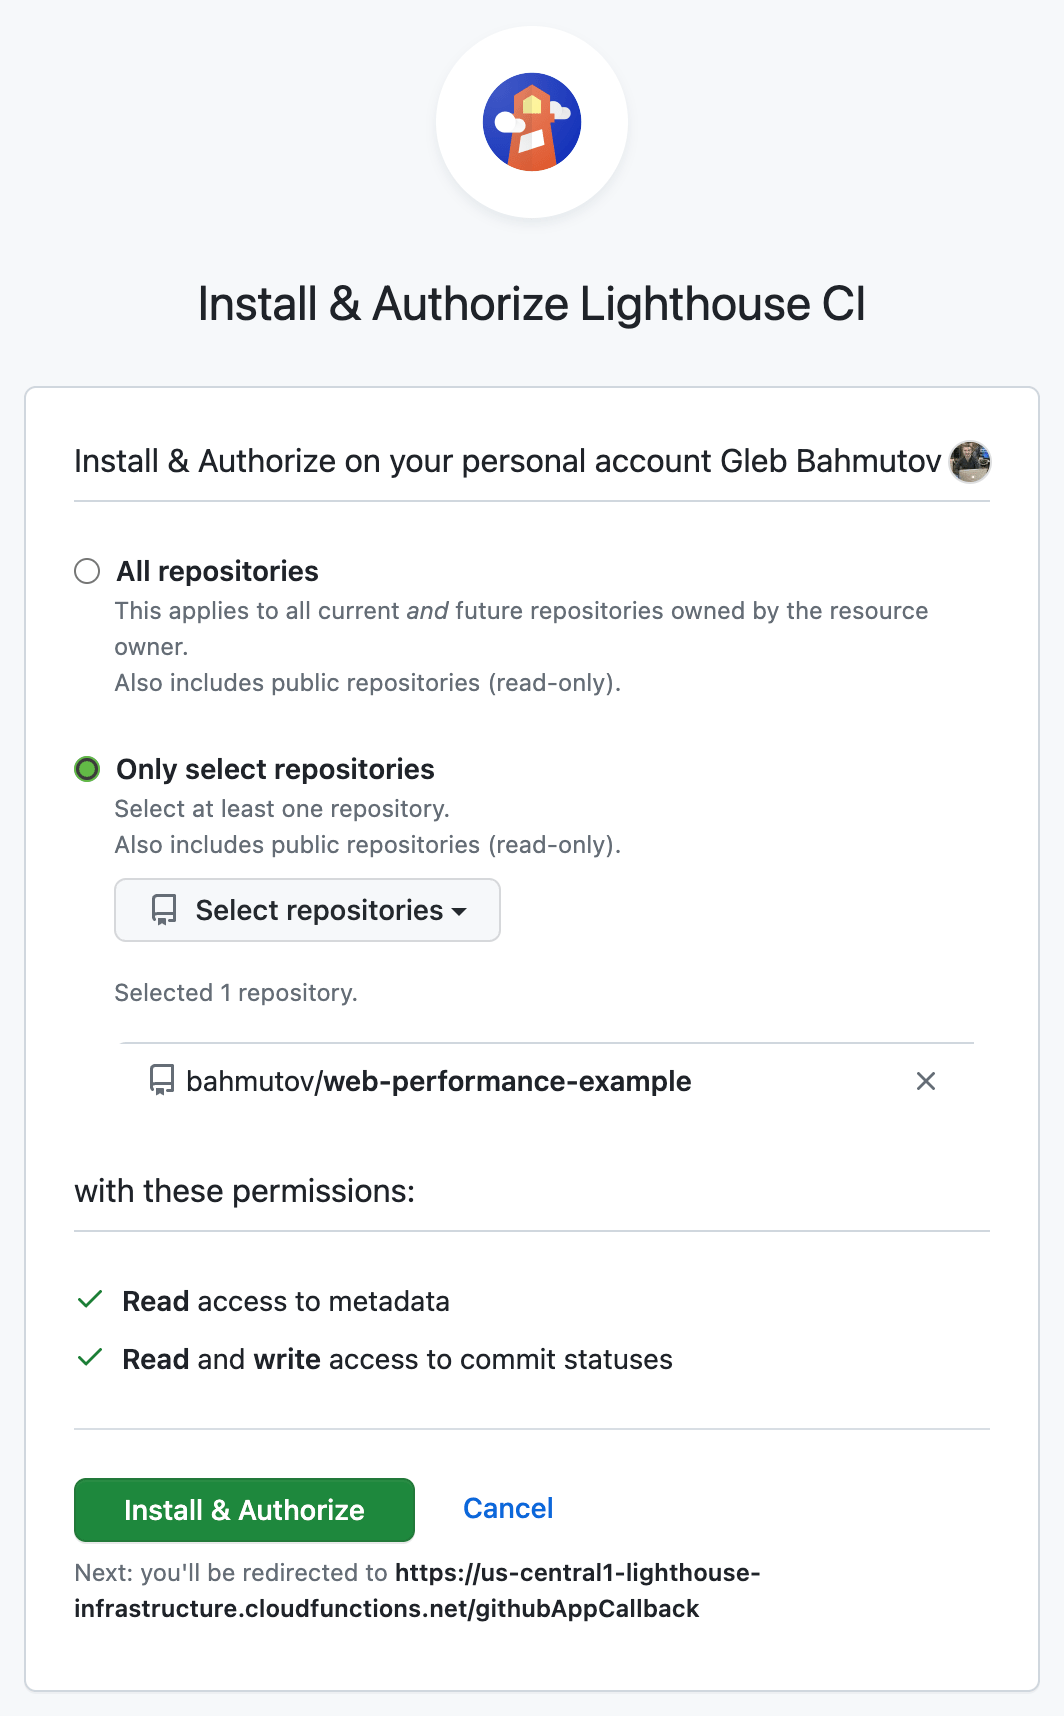
I will install the app and will give it access to the status checks in the example repo.
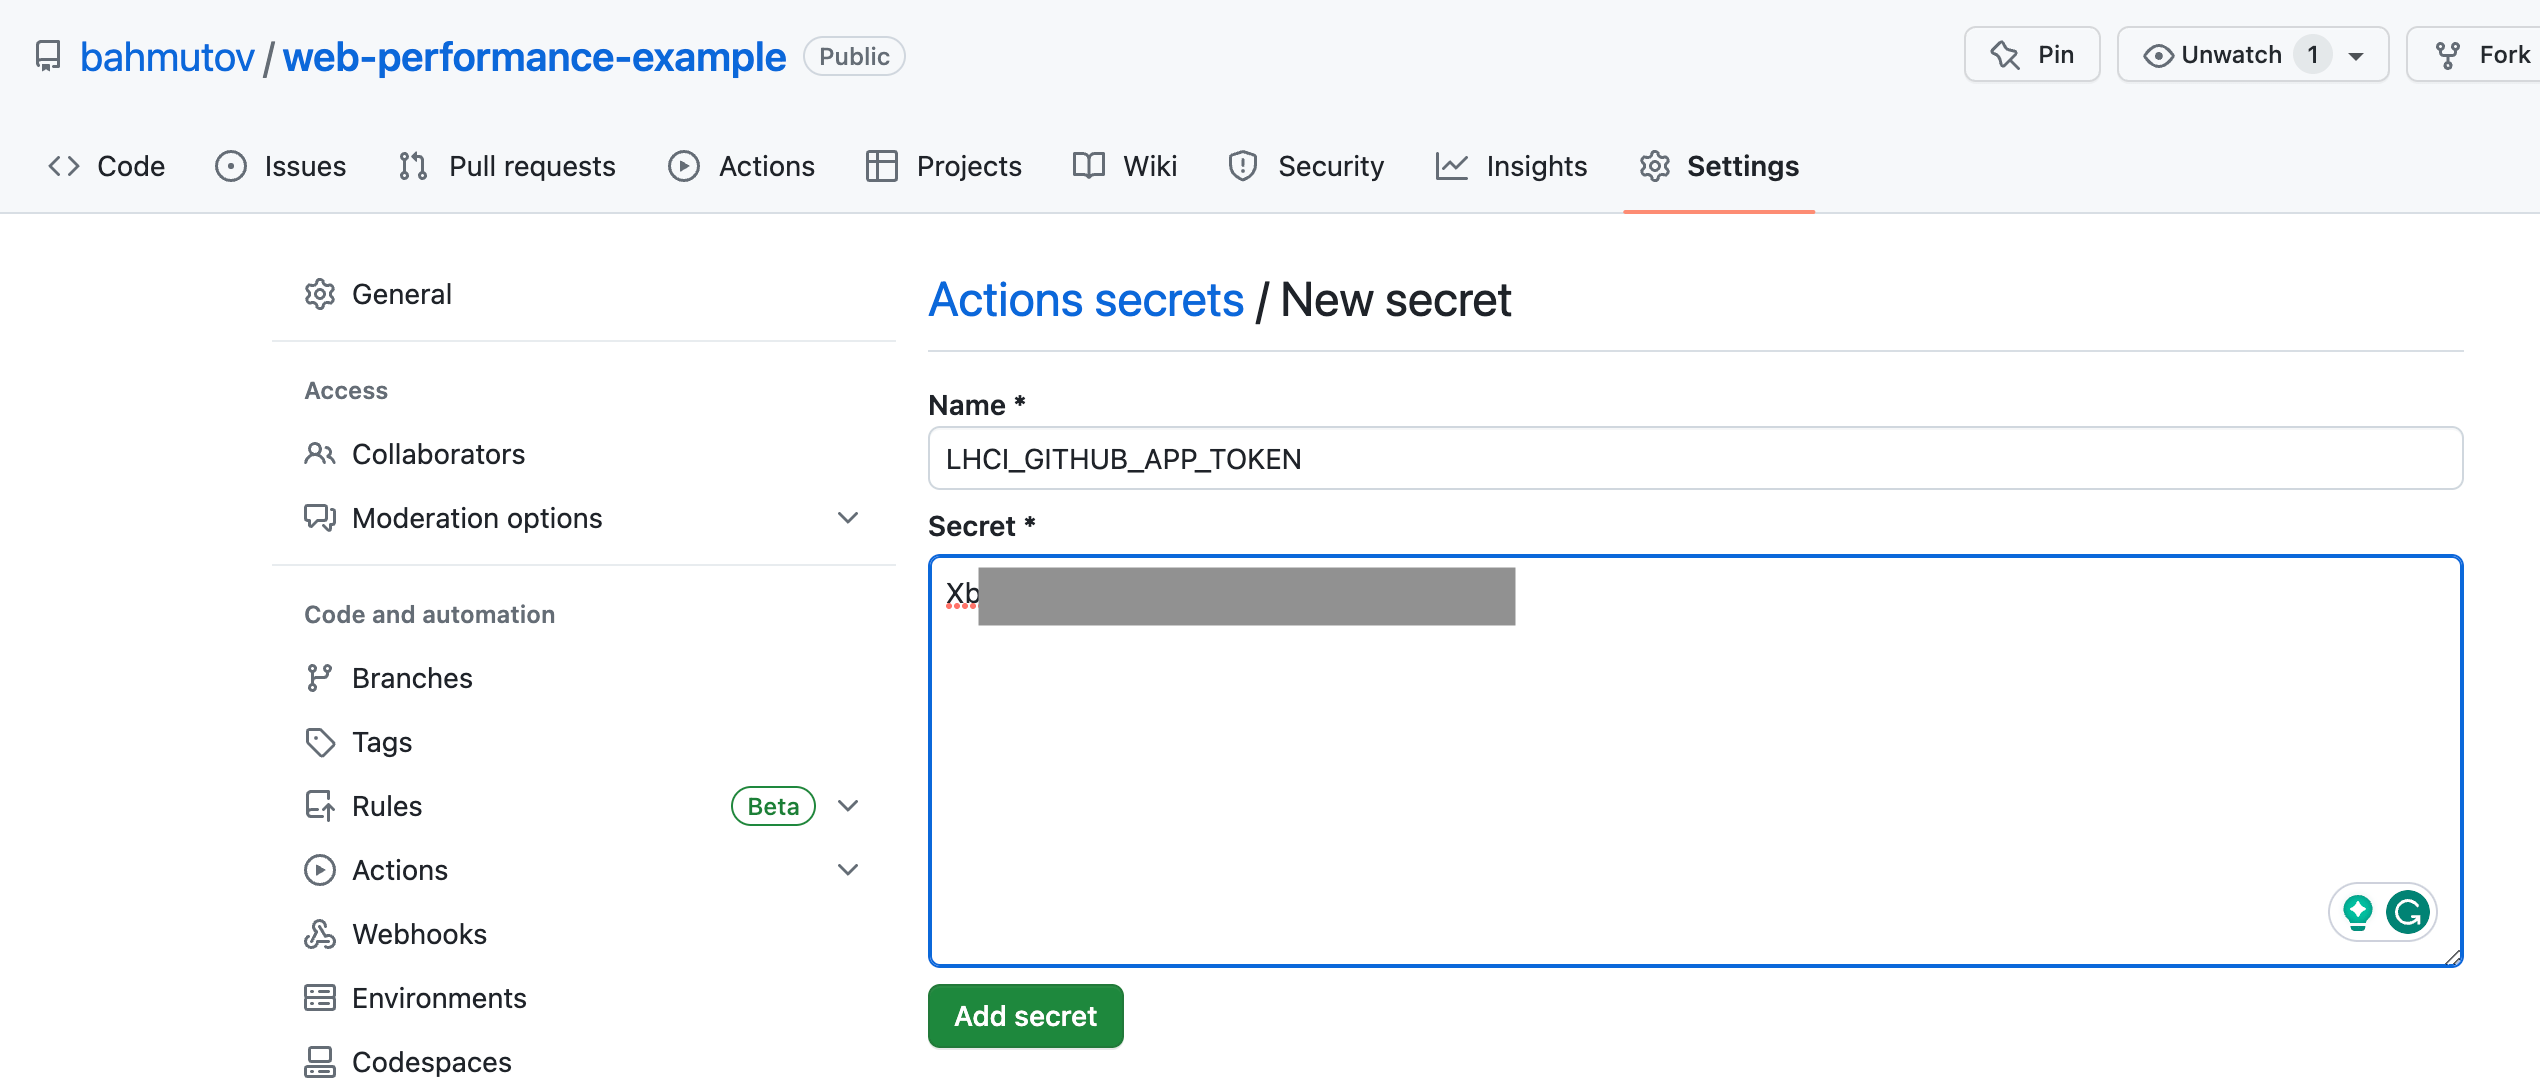
The installed application will show the LH token - save it and keep it secret.
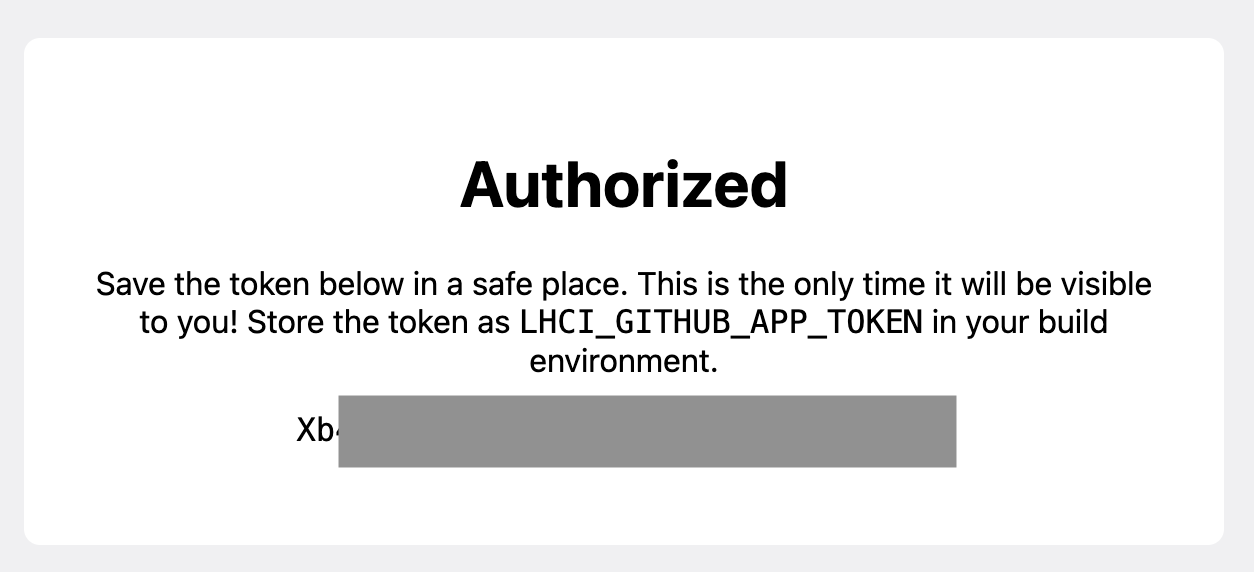
You should set this token as GitHub Actions secret, then pass it in the "Lighthouse CI" step as an environment variable.
1 | - name: run Lighthouse CI |
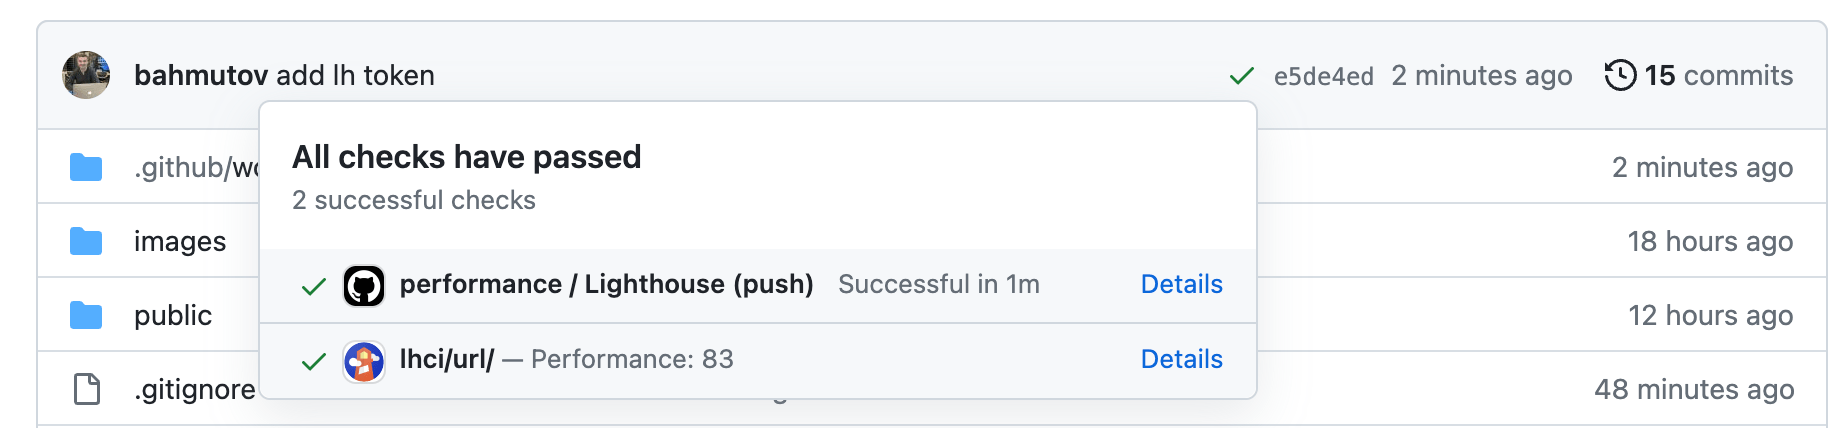
The workflow runs and finds the token and posts the commit status check.
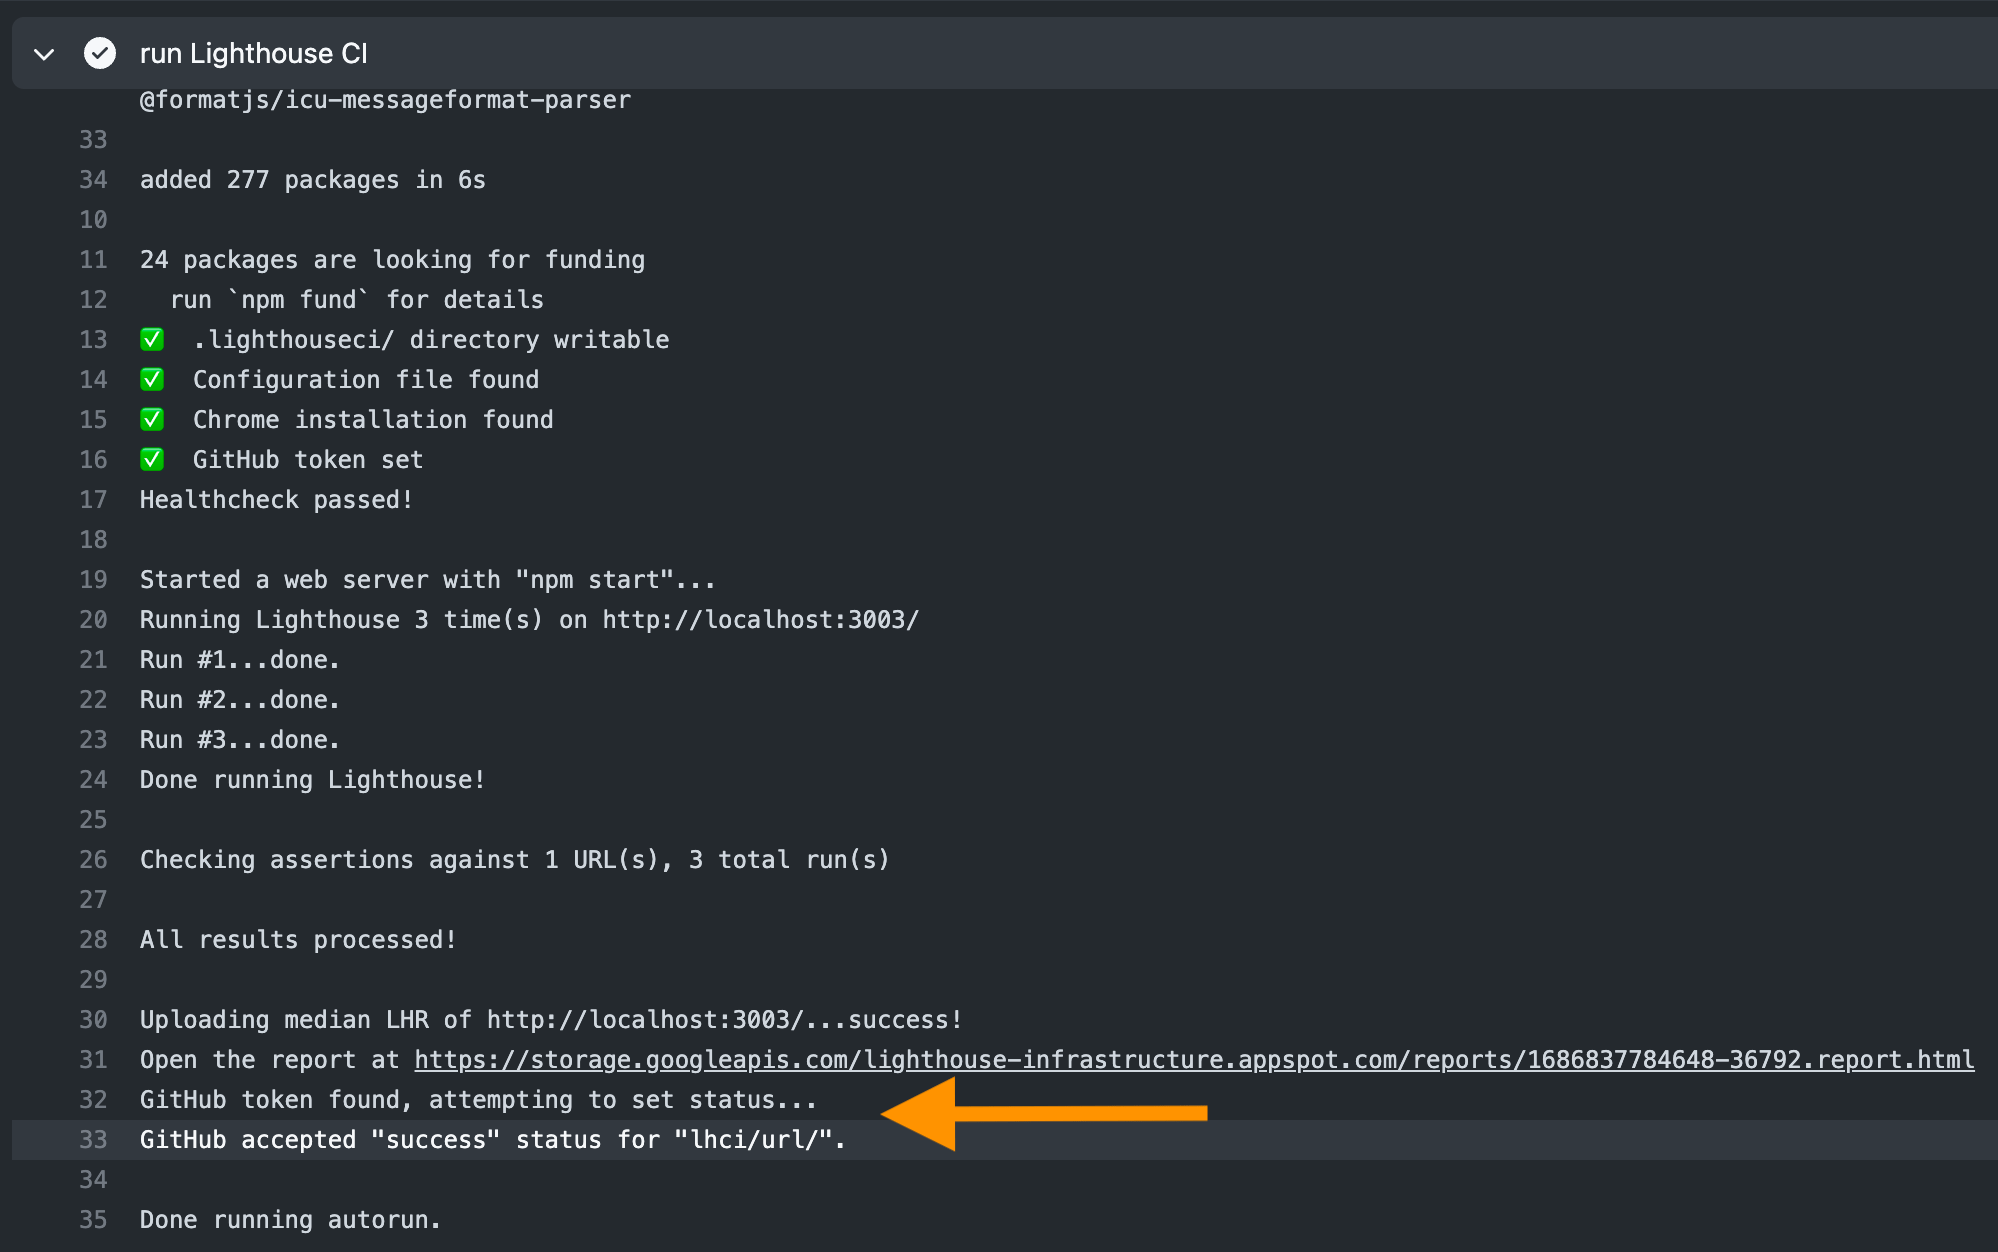
Here is how the commit status looks
The "details" link goes directly to the public report URL.
Performance checks for pull requests
I will adjust the performance workflow to execute on pull requests to the main branch and on any commit pushed to the main branch
1 | name: performance |
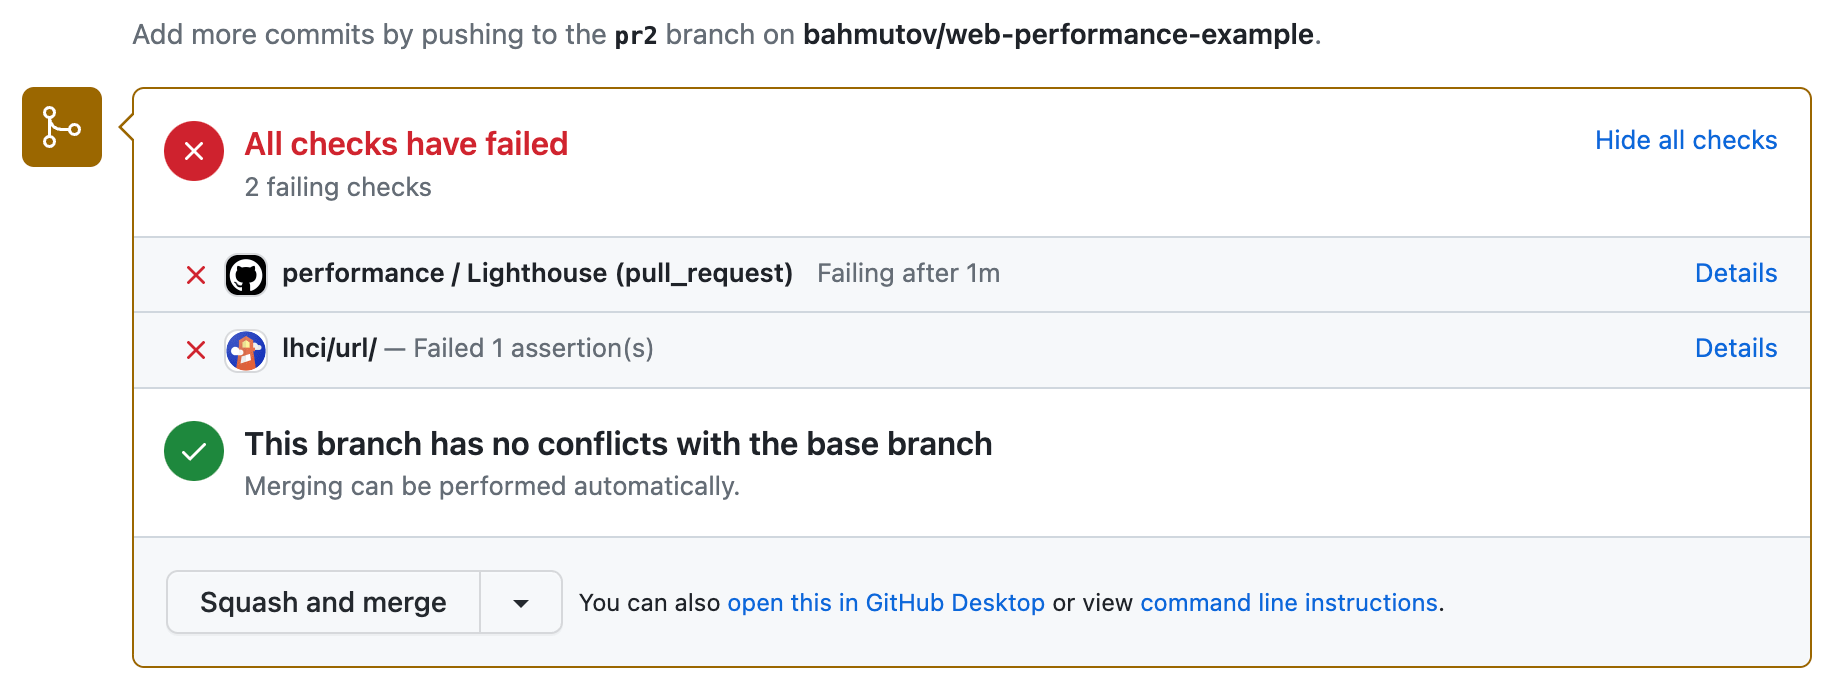
Let's open a pull request that delays serving the index.html by one second. This should decrease the performance. We see the Lighthouse step failing, but no LHCI status check.
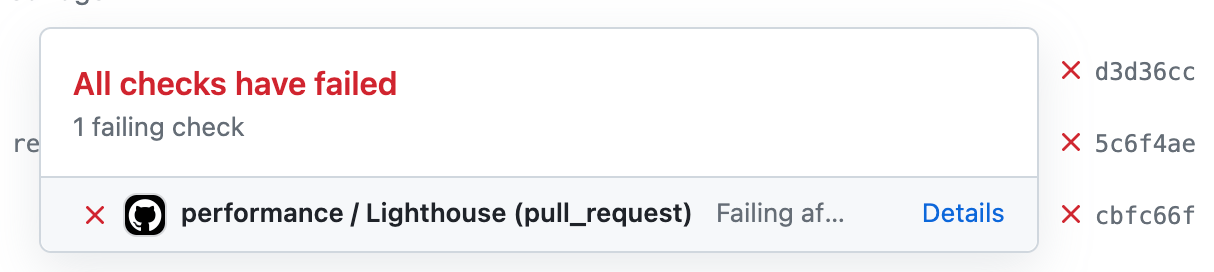
When running on pull_request, GitHub Actions set GITHUB_REF to the merge commit SHA, while the status checks are attached to the pull request head commit SHA. Luckily, LHCI allows you to overwrite the SHA value to set the status on any commit.
1 | - name: run Lighthouse CI |
The status checks are set correctly
See also
🎁 You can find the full source code for this blog post in the repo bahmutov/web-performance-example.
Bonus 1: Run Chrome in Docker
If you need to use a Docker container to run Lighthouse, then it needs Chrome installed. You can pick a Chrome image from Cypress cypress-docker-images:
1 | # we need Chrome browser to run Lighthouse |
When running Chrome inside a Docker container, it needs a few flags usually:
1 | // lighthouserc.js |
Bonus 2: Basic authentication
If your page is protected by the basic authentication, you need to encode the username and password and send it with your Lighthouse requests
1 | // encode the username and password like the browser does |
Bonus 3: Local Lighthouse report
If we do not want to save the HTML report to the public static storage, we can set it to store the report to the local file.
1 | upload: { |
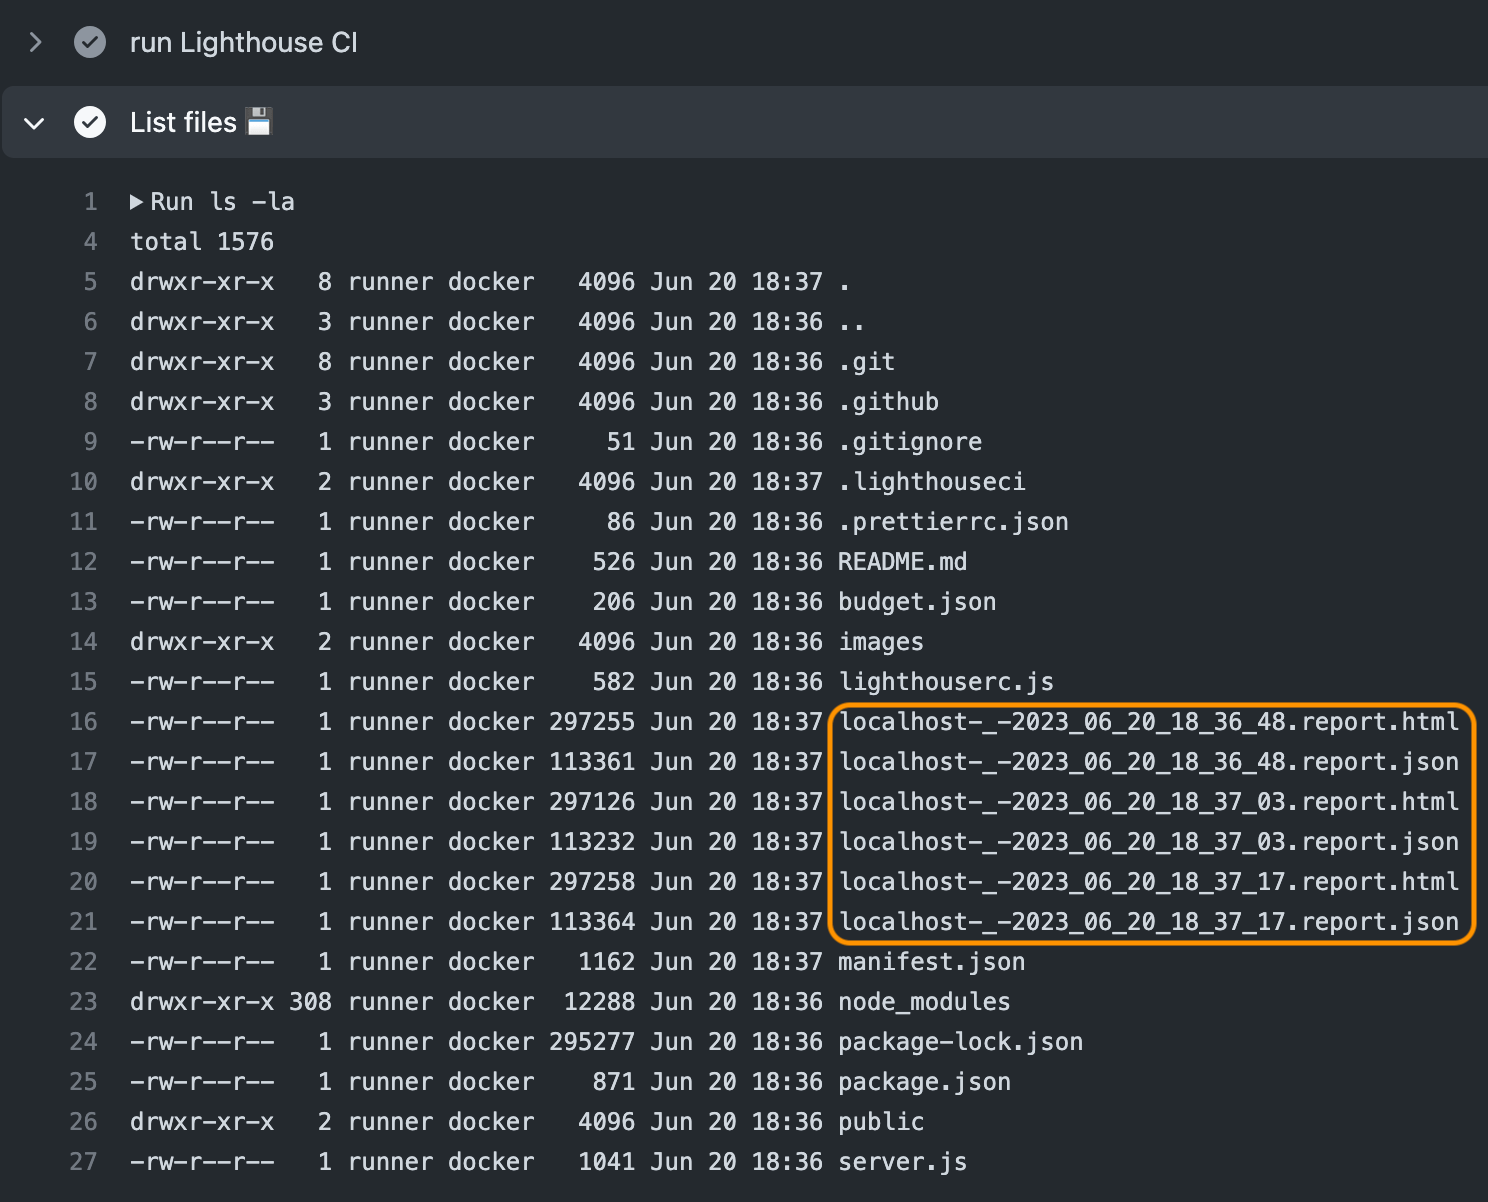
Since LHCI runs 3 performance tests in a row by default, there will be three JSON and HTML files, the names include the timestamps
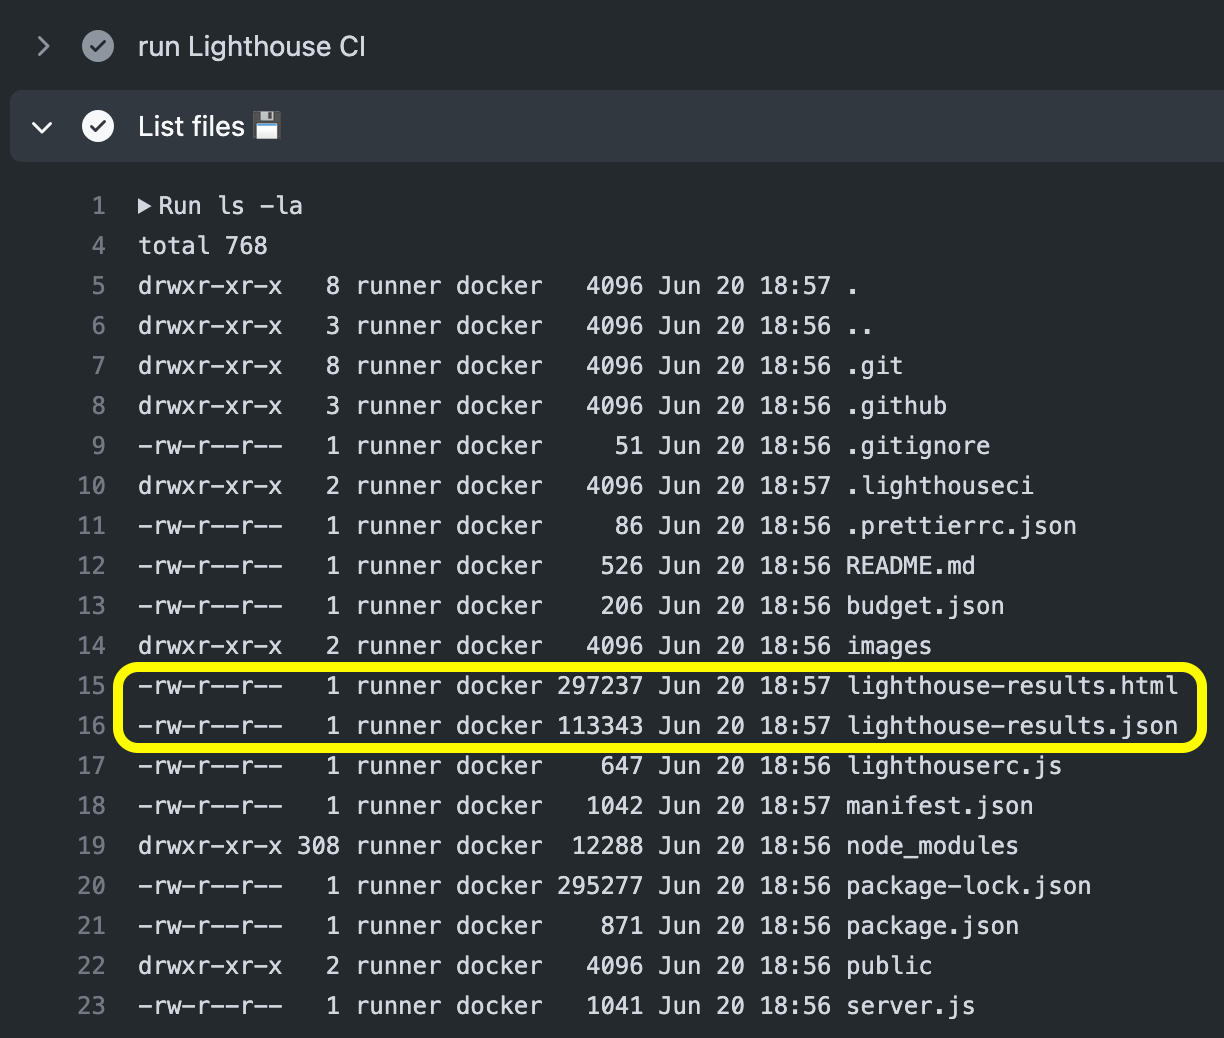
We can simply preserve the last report in both JSON and HTML formats by specifying the output report filename
1 | upload: { |
Let's save the report files as build artifact.
1 | - name: run Lighthouse CI |
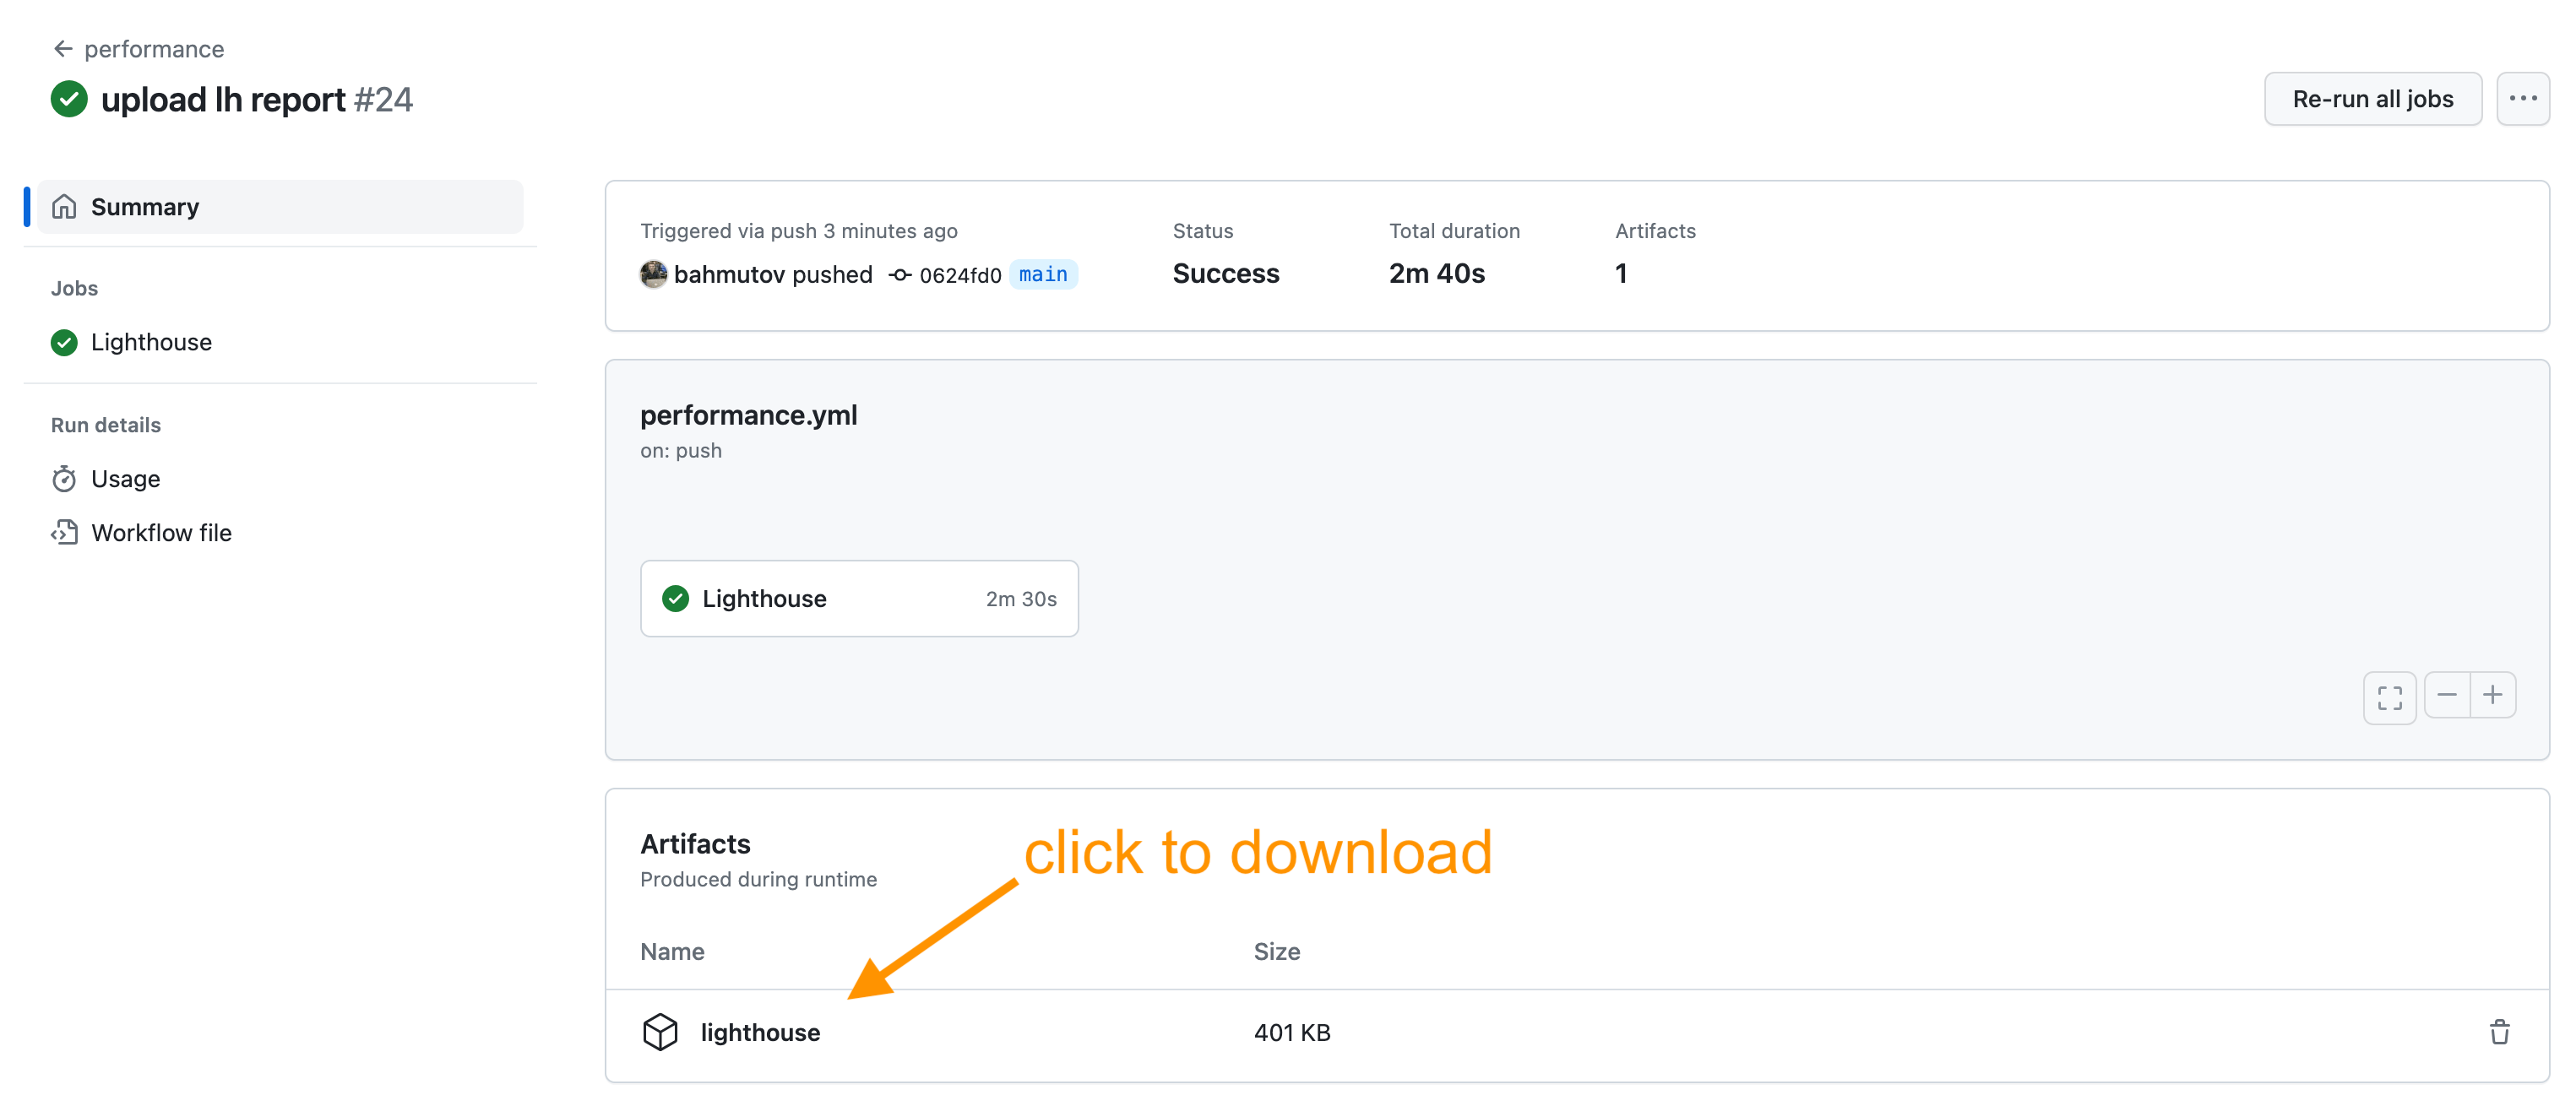
The report zip with two files appears as a job artifact.
Tip: you might want to always save the performance test result artifacts, even if the LHCI reports an audit failure.
1 | # after LHCI step |
This saves the test report even if the LHCI audit does not pass.
Bonus 4: Post GitHub summary
The LHCI generates JSON and HTML reports. Here is a typical metric in the JSON file:
1 | { |
You can read the JSON file and write the main performance metrics to the terminal and to the GitHub job summary. Here is a typical Node.js script:
1 | const ghCore = require('@actions/core') |
We run this script after LHCI
1 | - name: run Lighthouse CI |
Here is the terminal output
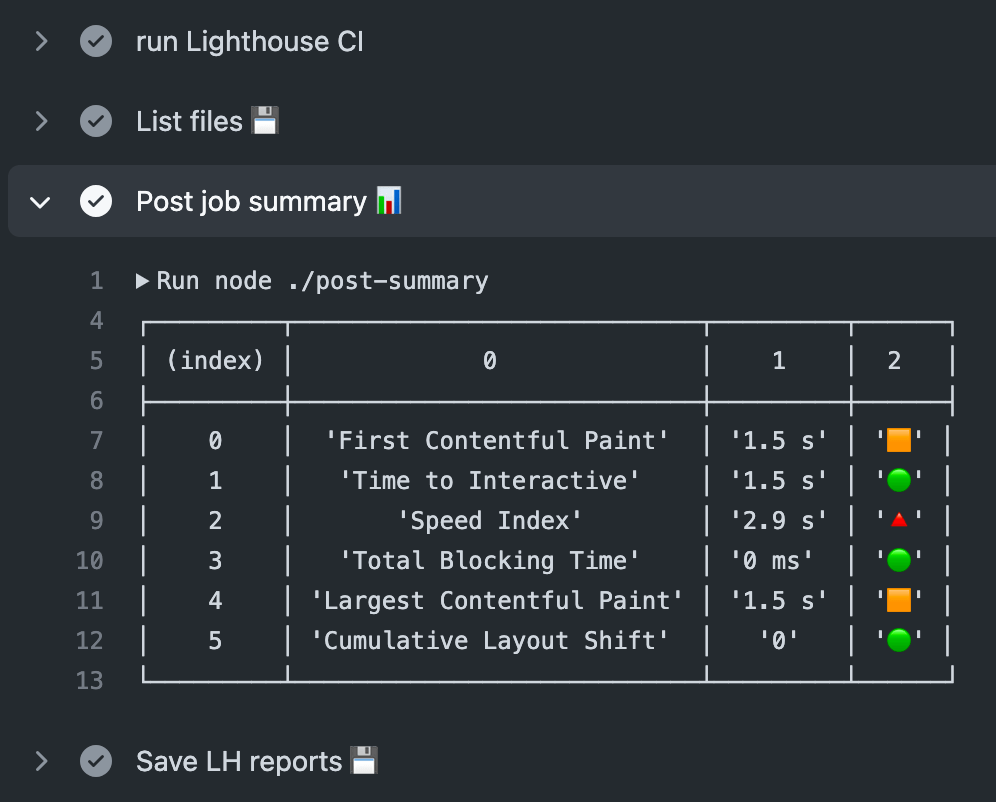
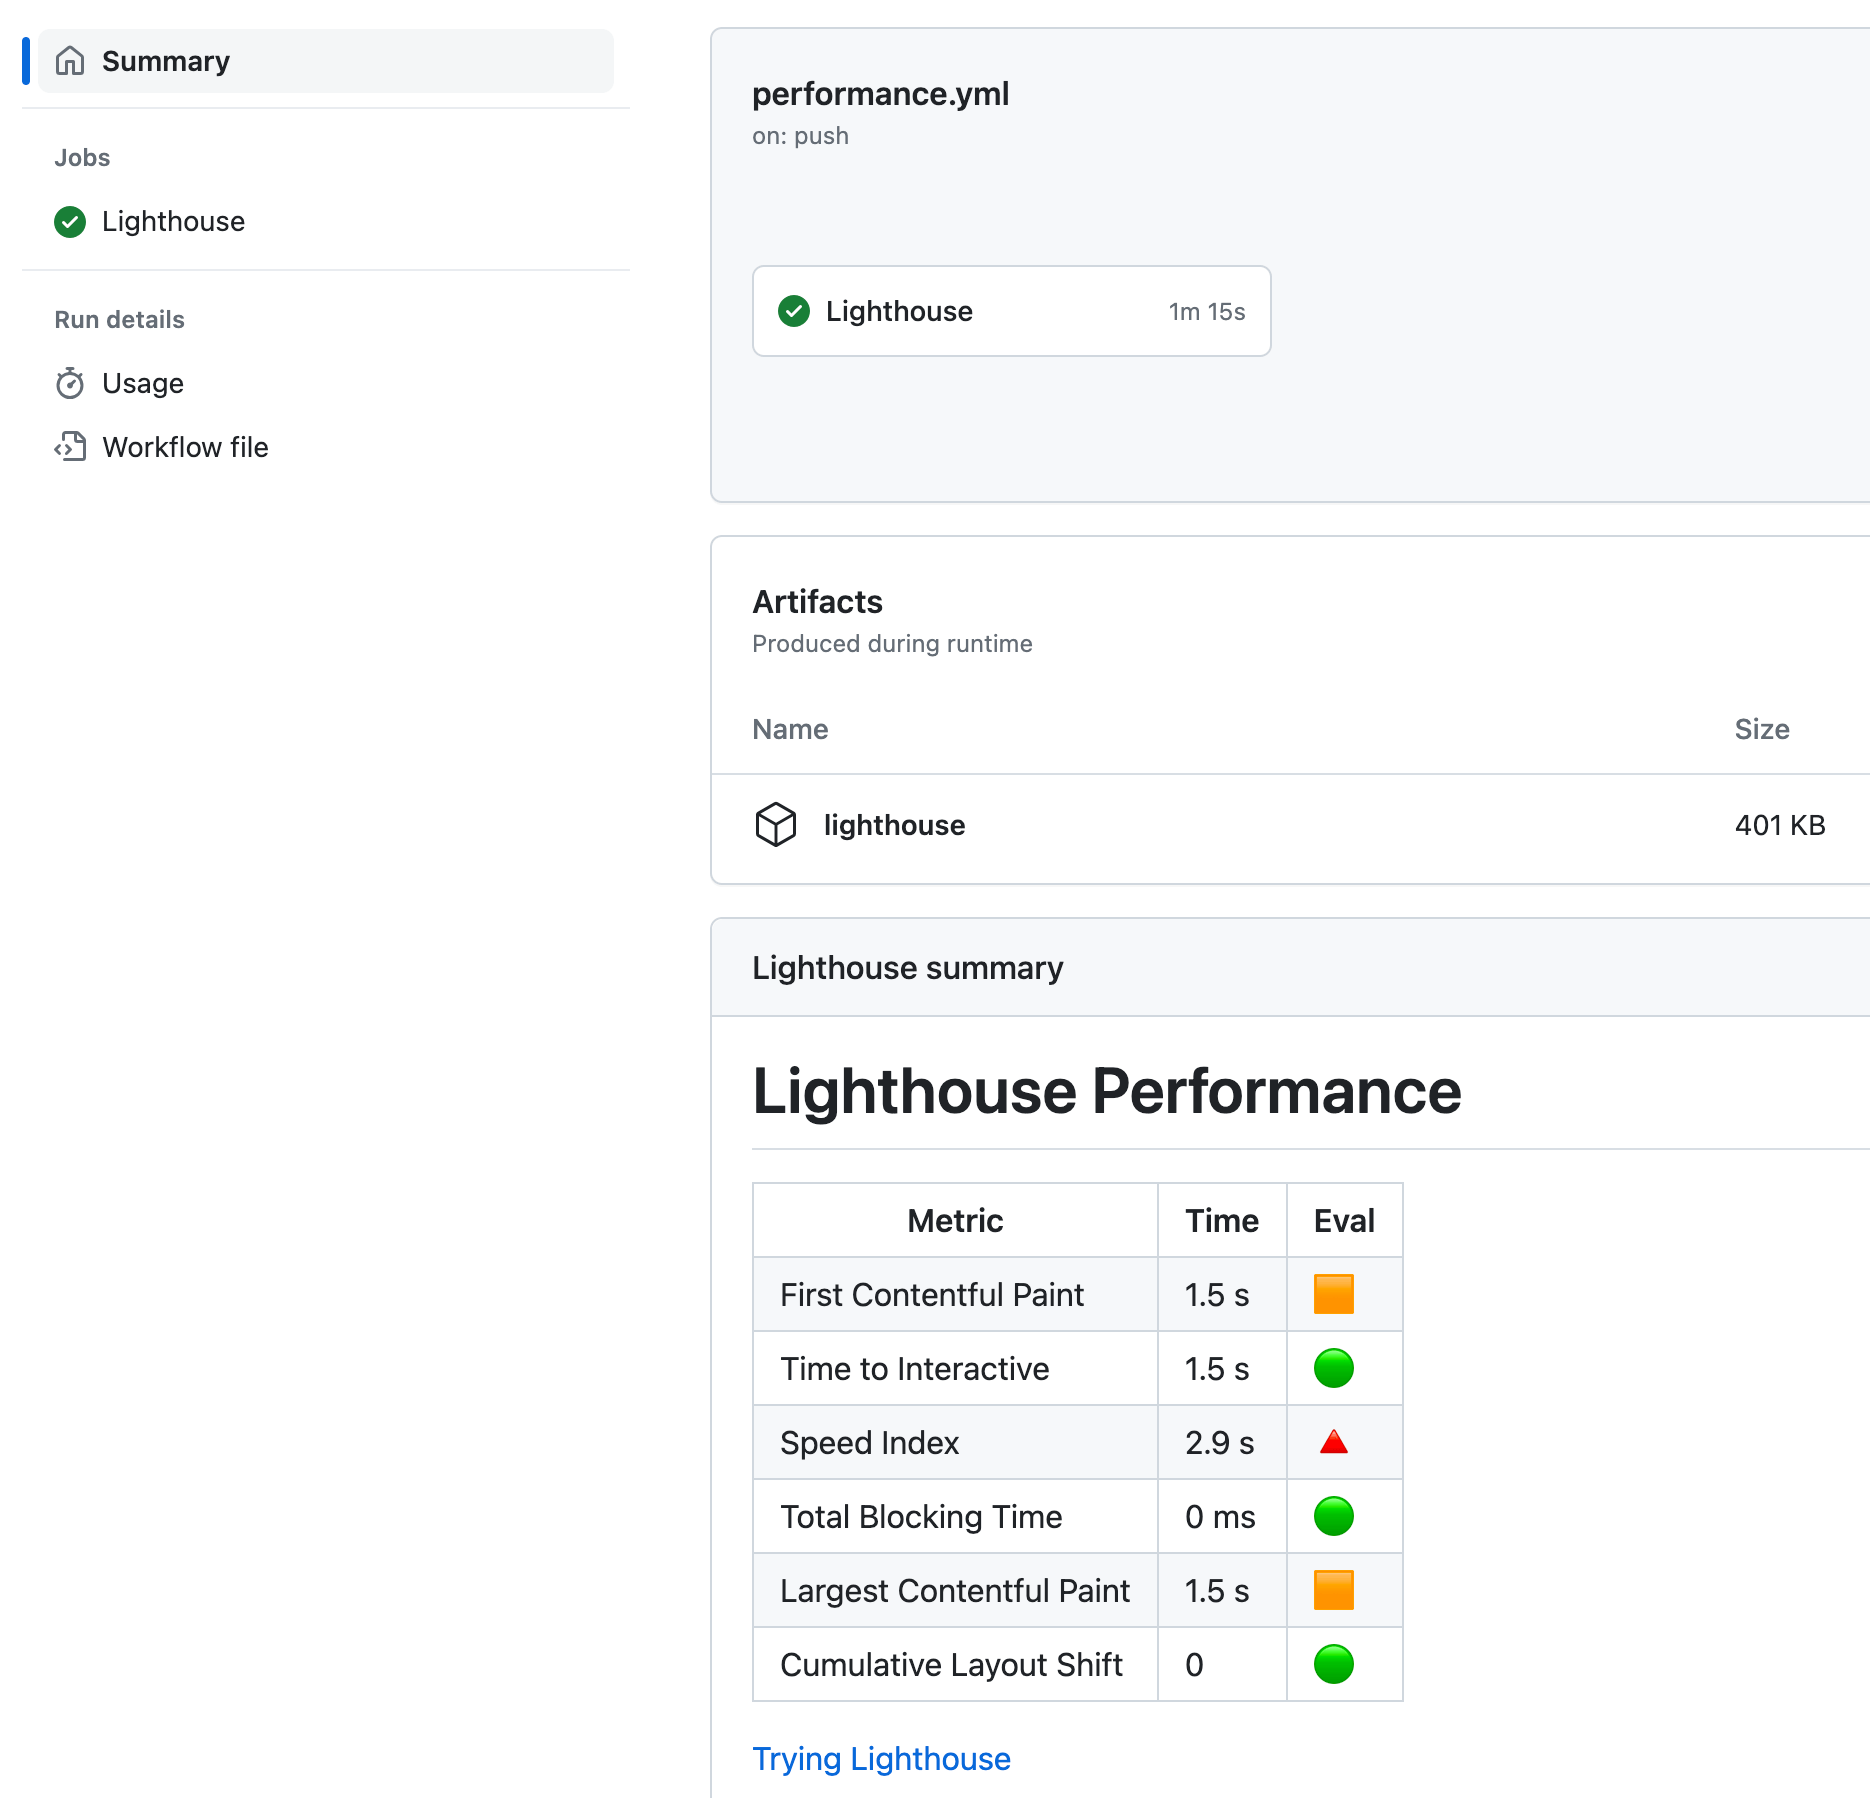
Here is the job summary from a typical run:
Bonus 5: Split autorun command
The lhci autorun command executes collect, upload, and assert commands internally. For example, you might want to collect and upload the reports before running any checks. Thus it makes sense to split the steps:
1 | # https://github.com/GoogleChrome/lighthouse-ci |
Bonus 6: Reusable GitHub Actions module
To simplify posting the performance job summary and commit status, I created an NPM package lhci-gha hosted at https://github.com/bahmutov/lhci-gha. You can install this module as a dev dependency
1 | $ npm i -D lhci-gha |
The updated workflow uses npx to run the two scripts provided by the lhci-gha module
1 | # https://github.com/GoogleChrome/lighthouse-ci |
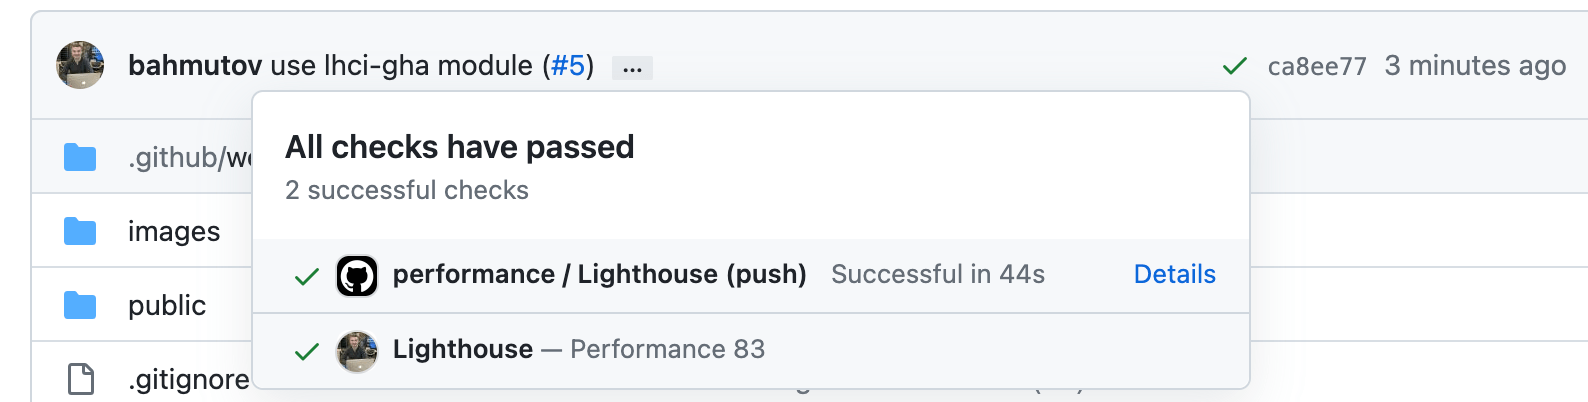
The post-status script does not require Lighthouse GH app installation, since it uses my personal GH token. Here is how the commit status looks.
You can set the minimum performance score. Let's make our project fail by requiring at least 90.
1 | - name: Post performance commit status ✅ |
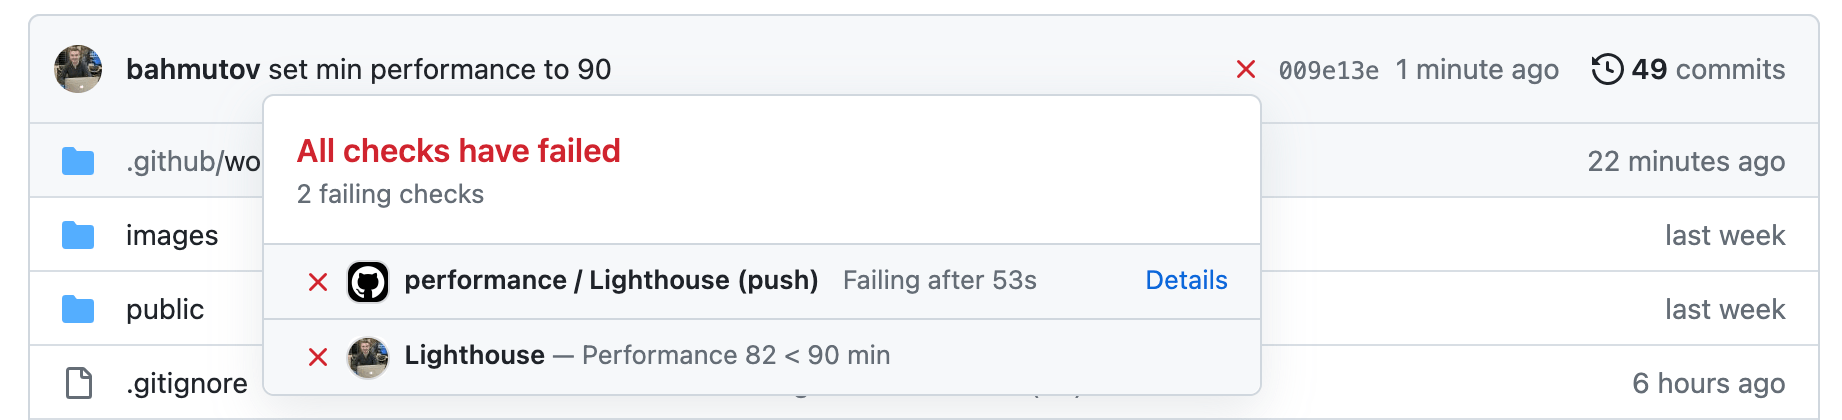
The status check shows the current performance 82 is below 90.