Find Specs For The Given URL By The Test Effort

Pick specs that spend the most time or execute the most Cypress commands on the page.

If your project has a lot of E2E specs, picking the specs to run first is a challenge. You pick specs based on the test ids in the changed source files or using my test tags plugin. But what if you do not know the test ids in the changes? Or the test tags do not map neatly onto your pull request?

What if all you know is the URL of the page most likely to need testing? Which specs test that URL the most?

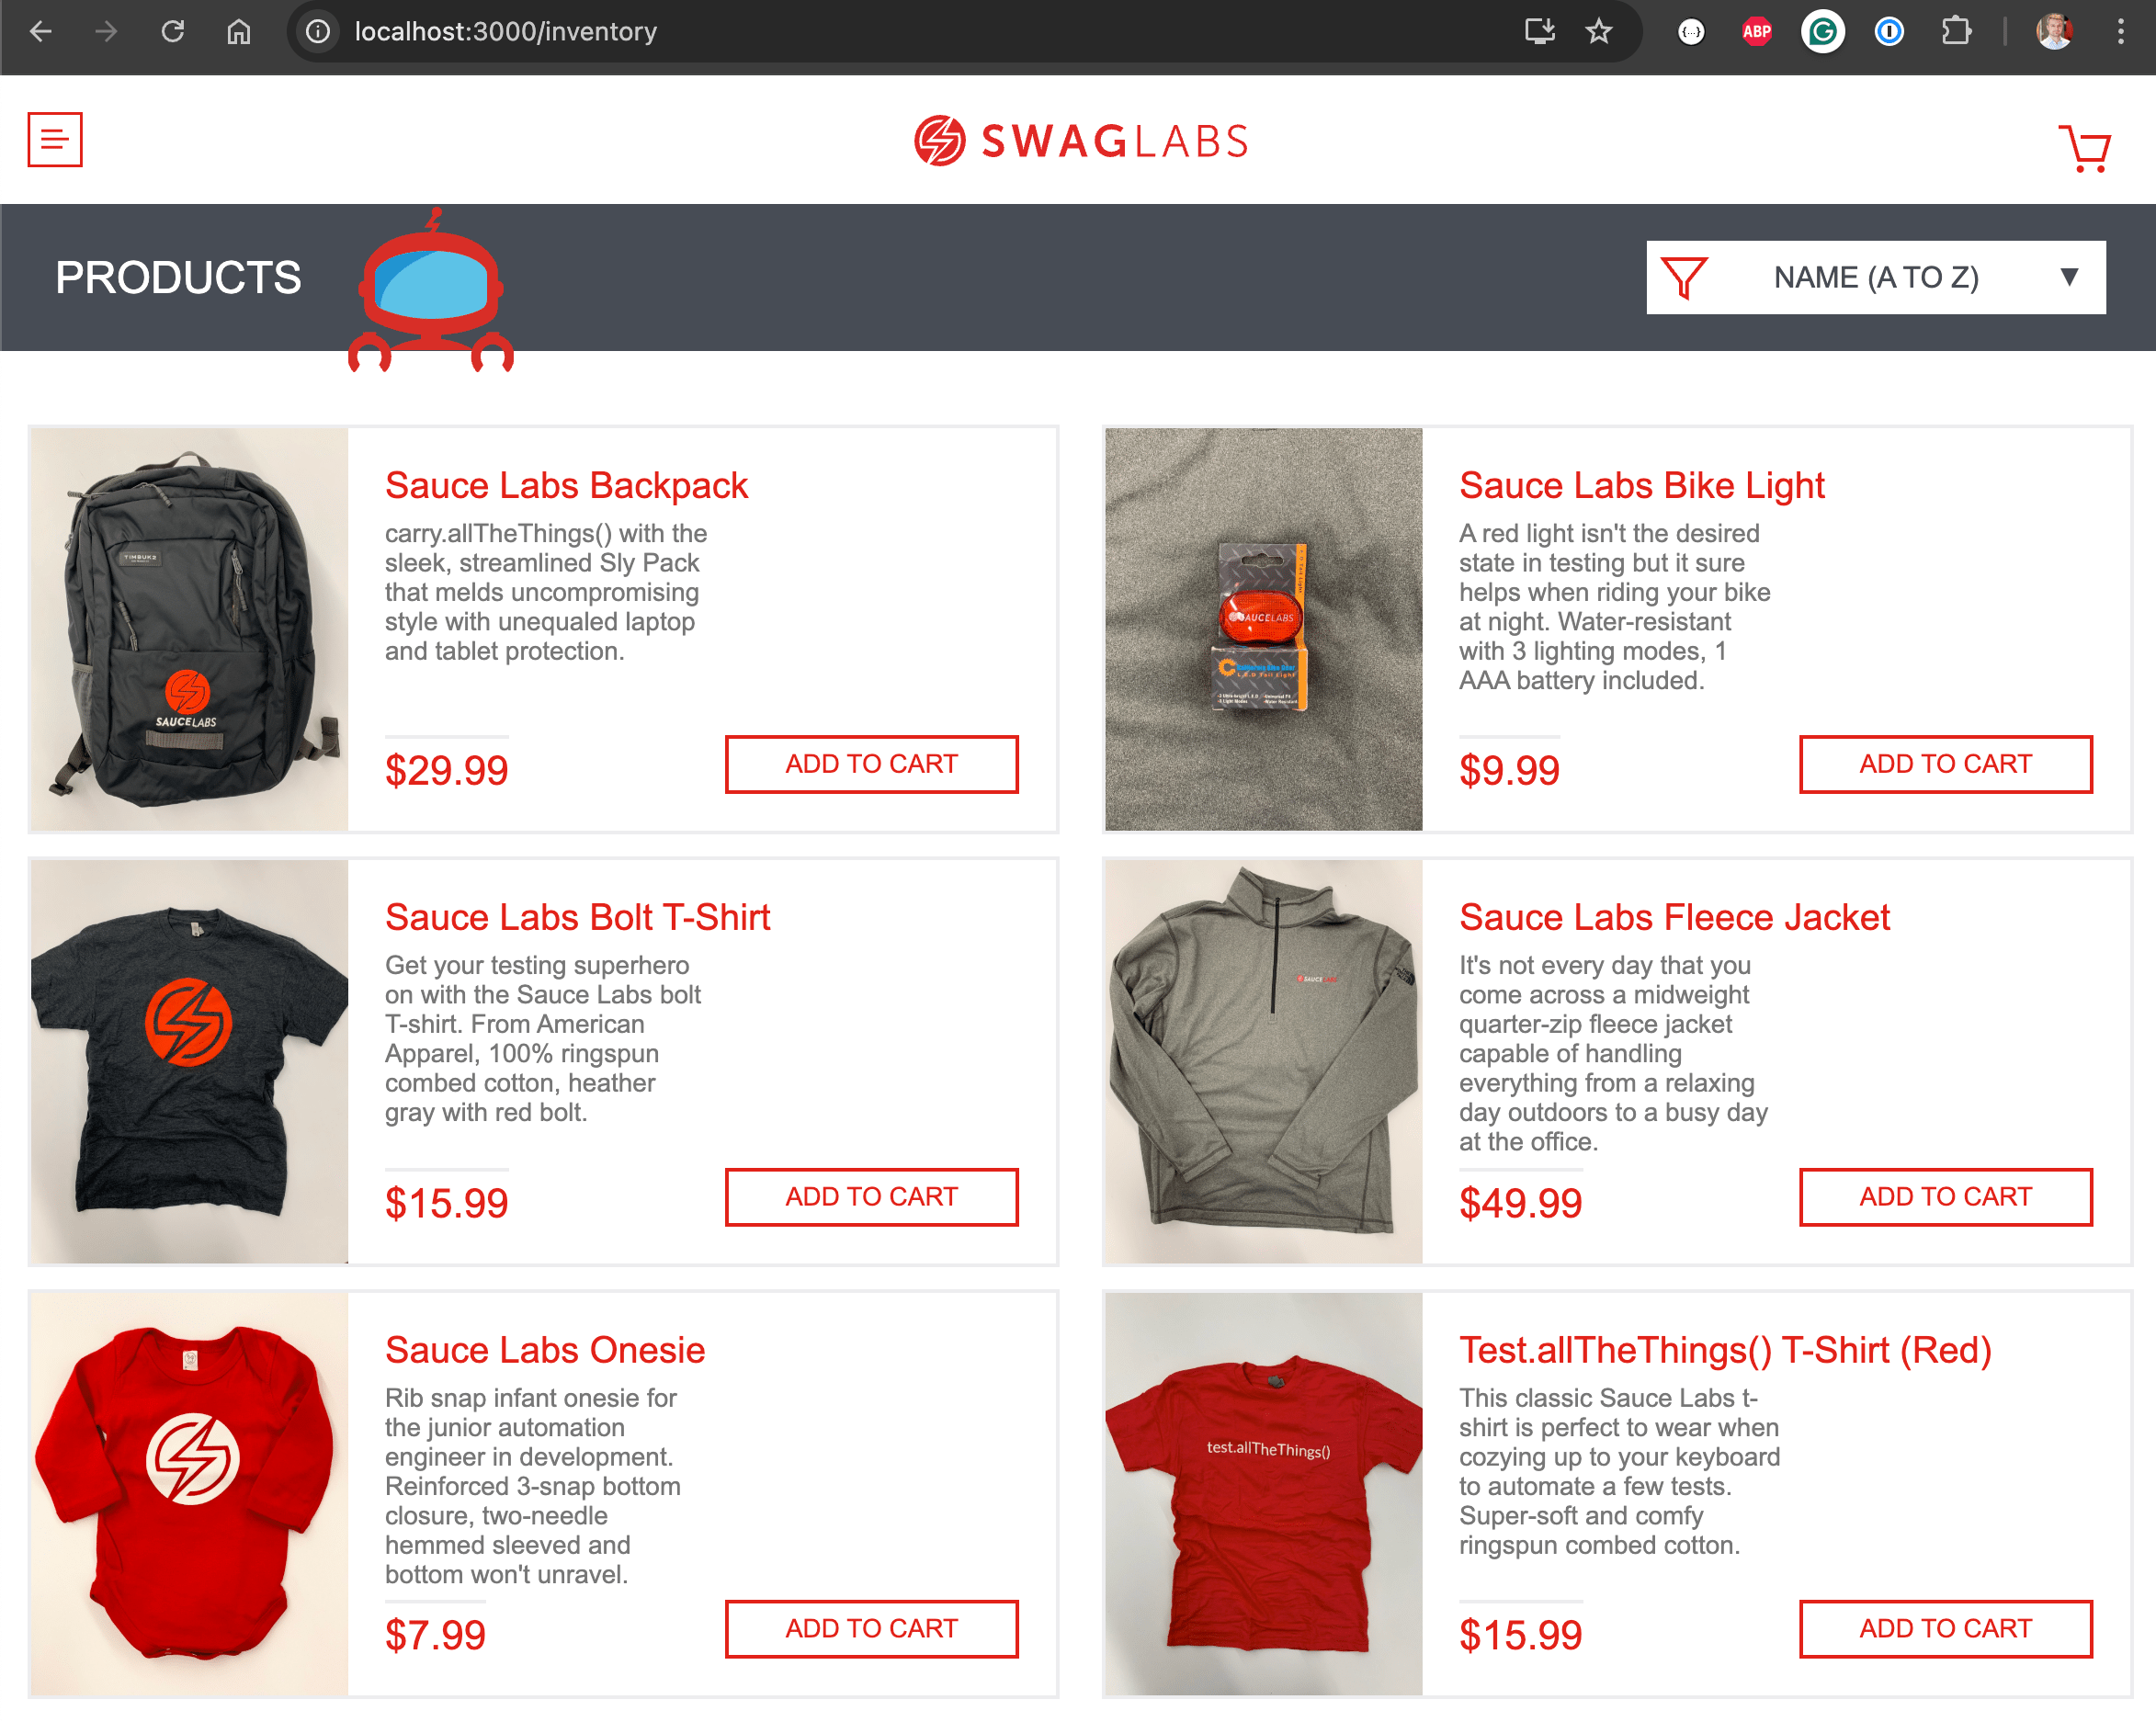
The [email protected] plugin I am using in the blog post has 2 features that make picking the first specs to run a breeze. Let's take a Swag Store course example app. It have multiple e-commerce store pages and lots of specs. One of the most important pages is the "/inventory" page.

The inventory page

Since this is the first page after the login screen a lot of specs "touch" the "/inventory" page. But which specs really test it? We can think of the testing effort each spec spends on the page. We can either measure the total duration the spec's tests spend on the page or the number of Cypress commands (like cy.get, cy.click, cy.then, etc) executed while on the page. The plugin stores these numbers with each test:

1
2
3
4
5
6
7
8
9
10
11
12
13
14
15
16
17
{
"cypress/e2e/cart/add-to-cart.cy.ts": {
"Cart / adds items to the cart": [
{
"url": "/",
"duration": 1019,
"commandsCount": 19
},
{
"url": "/inventory",
"duration": 524,
"commandsCount": 46
}
]
},
...
}

Using the "bin" alias find-specs-by-url let's see all specs vising the URL sorted by the number of commands

1
2
3
4
5
6
7
8
9
10
11
12
13
14
15
16
17
18
19
20
$ npx find-specs-by-url -f cypress-visited-urls.json -u /inventory \
--table

=== Specs testing page "/inventory" sorted by commands ===
┌─────────┬────────────────────────────────────────────────────┬──────────┐
│ (index) │ spec │ commands │
├─────────┼────────────────────────────────────────────────────┼──────────┤
│ 0 │ 'cypress/e2e/inventory/sort-tests.cy.ts' │ 90 │
│ 1 │ 'cypress/e2e/inventory/product.cy.ts' │ 56 │
│ 2 │ 'cypress/e2e/inventory/inventory.cy.ts' │ 54 │
│ 3 │ 'cypress/e2e/inventory/sort-tests-session.cy.js' │ 53 │
│ 4 │ 'cypress/e2e/login/login-for-sort.cy.ts' │ 48 │
│ 5 │ 'cypress/e2e/cart/add-to-cart.cy.ts' │ 46 │
│ 6 │ 'cypress/e2e/cart/cart.cy.ts' │ 45 │
│ 7 │ 'cypress/e2e/cart/cart-app-action.cy.ts' │ 33 │
...
│ 30 │ 'cypress/e2e/inventory/sorted.cy.js' │ 10 │
│ 31 │ 'cypress/e2e/login/call-login.cy.js' │ 8 │
│ 32 │ 'cypress/e2e/login/direct-attempt.cy.ts' │ 0 │
└─────────┴────────────────────────────────────────────────────┴──────────┘

It makes sense that the top 4 specs that run the most Cypress commands on the "/inventory" page all come from the "cypress/e2e/inventory" folder! We probably want to limit ourselves to the specs that have at least 40 Cypress commands against the "/inventory" page. We can use the --cutoff 40 parameter to filter the table:

1
2
3
4
5
6
7
8
9
10
11
12
13
14
$ npx find-specs-by-url -f cypress-visited-urls.json -u /inventory \
--table --cutoff 40
=== Specs testing page "/inventory" sorted by commands with cutoff 40 ===
┌─────────┬──────────────────────────────────────────────────┬──────────┐
│ (index) │ spec │ commands │
├─────────┼──────────────────────────────────────────────────┼──────────┤
│ 0 │ 'cypress/e2e/inventory/sort-tests.cy.ts' │ 90 │
│ 1 │ 'cypress/e2e/inventory/product.cy.ts' │ 56 │
│ 2 │ 'cypress/e2e/inventory/inventory.cy.ts' │ 54 │
│ 3 │ 'cypress/e2e/inventory/sort-tests-session.cy.js' │ 53 │
│ 4 │ 'cypress/e2e/login/login-for-sort.cy.ts' │ 48 │
│ 5 │ 'cypress/e2e/cart/add-to-cart.cy.ts' │ 46 │
│ 6 │ 'cypress/e2e/cart/cart.cy.ts' │ 45 │
└─────────┴──────────────────────────────────────────────────┴──────────┘

So if we want to launch just these specs, we could do the following:

1
2
$ npx cypress run \
--spec $(npx find-specs-by-url -f cypress-visited-urls.json -u /inventory --cutoff 40)

Commands vs timing

The cypress-visited-urls plugin also measures the time Cypress spends on each test. It might not be the most appropriate measurement, since it depends on the app's speed and the test design. This test spends 10 seconds on the page, but does not really test it.

1
2
cy.visit('/about')
cy.wait(10_000)

The second test spends less time on the About page, but at least it verifies some elements:

1
2
3
4
cy.visit('/about')
cy.get('body.loaded')
cy.contains('h1', 'About')
cy.title().should('equal', 'About us')

Still, if you want to use the "duration" metric to find the top specs, you can

1
2
3
4
5
6
7
8
9
10
11
12
13
$ npx find-specs-by-url -f cypress-visited-urls.json -u /inventory \
--metric duration --table --cutoff 1000
=== Specs testing page "/inventory" sorted by duration with cutoff 1000 ===
┌─────────┬──────────────────────────────────────────────────┬────────────────┐
│ (index) │ spec │ duration │
├─────────┼──────────────────────────────────────────────────┼────────────────┤
│ 0 │ 'cypress/e2e/checkout/glitch-user.cy.ts' │ '5.33 seconds' │
│ 1 │ 'cypress/e2e/cart/cart.cy.ts' │ '2 seconds' │
│ 2 │ 'cypress/e2e/inventory/sort-tests.cy.ts' │ '1.37 seconds' │
│ 3 │ 'cypress/e2e/inventory/sort-tests-session.cy.js' │ '1.23 seconds' │
│ 4 │ 'cypress/e2e/login/login-for-sort.cy.ts' │ '1.06 seconds' │
│ 5 │ 'cypress/e2e/inventory/product.cy.ts' │ '1.03 seconds' │
└─────────┴──────────────────────────────────────────────────┴────────────────┘

Notice the first spec cypress/e2e/checkout/glitch-user.cy.ts - it is not even in the top 7 specs if measured by the number of commands; it's just a spec that waits a lot for the app to react to a "glitch" user! This is why I like the "commands count" metric when deciding which test covers the given URL.