Note: this blog post right here is post number 500 🎉🎊 so it is a good opportunity to take a quantitative look back.
The daily logs
Since March of 2019 I have kept detailed daily notes about the tasks I have been working on. I used Markdown format and Typora editor, listing everything: GitHub issues, pull requests, meetings, writing blog posts, preparing and delivering presentations, etc. You can find these monthly logs in the repository bahmutov/daily-logs. I have redacted private and confidential information from the source files before creating the repository, thus the logs do accurately reflect my daily work.
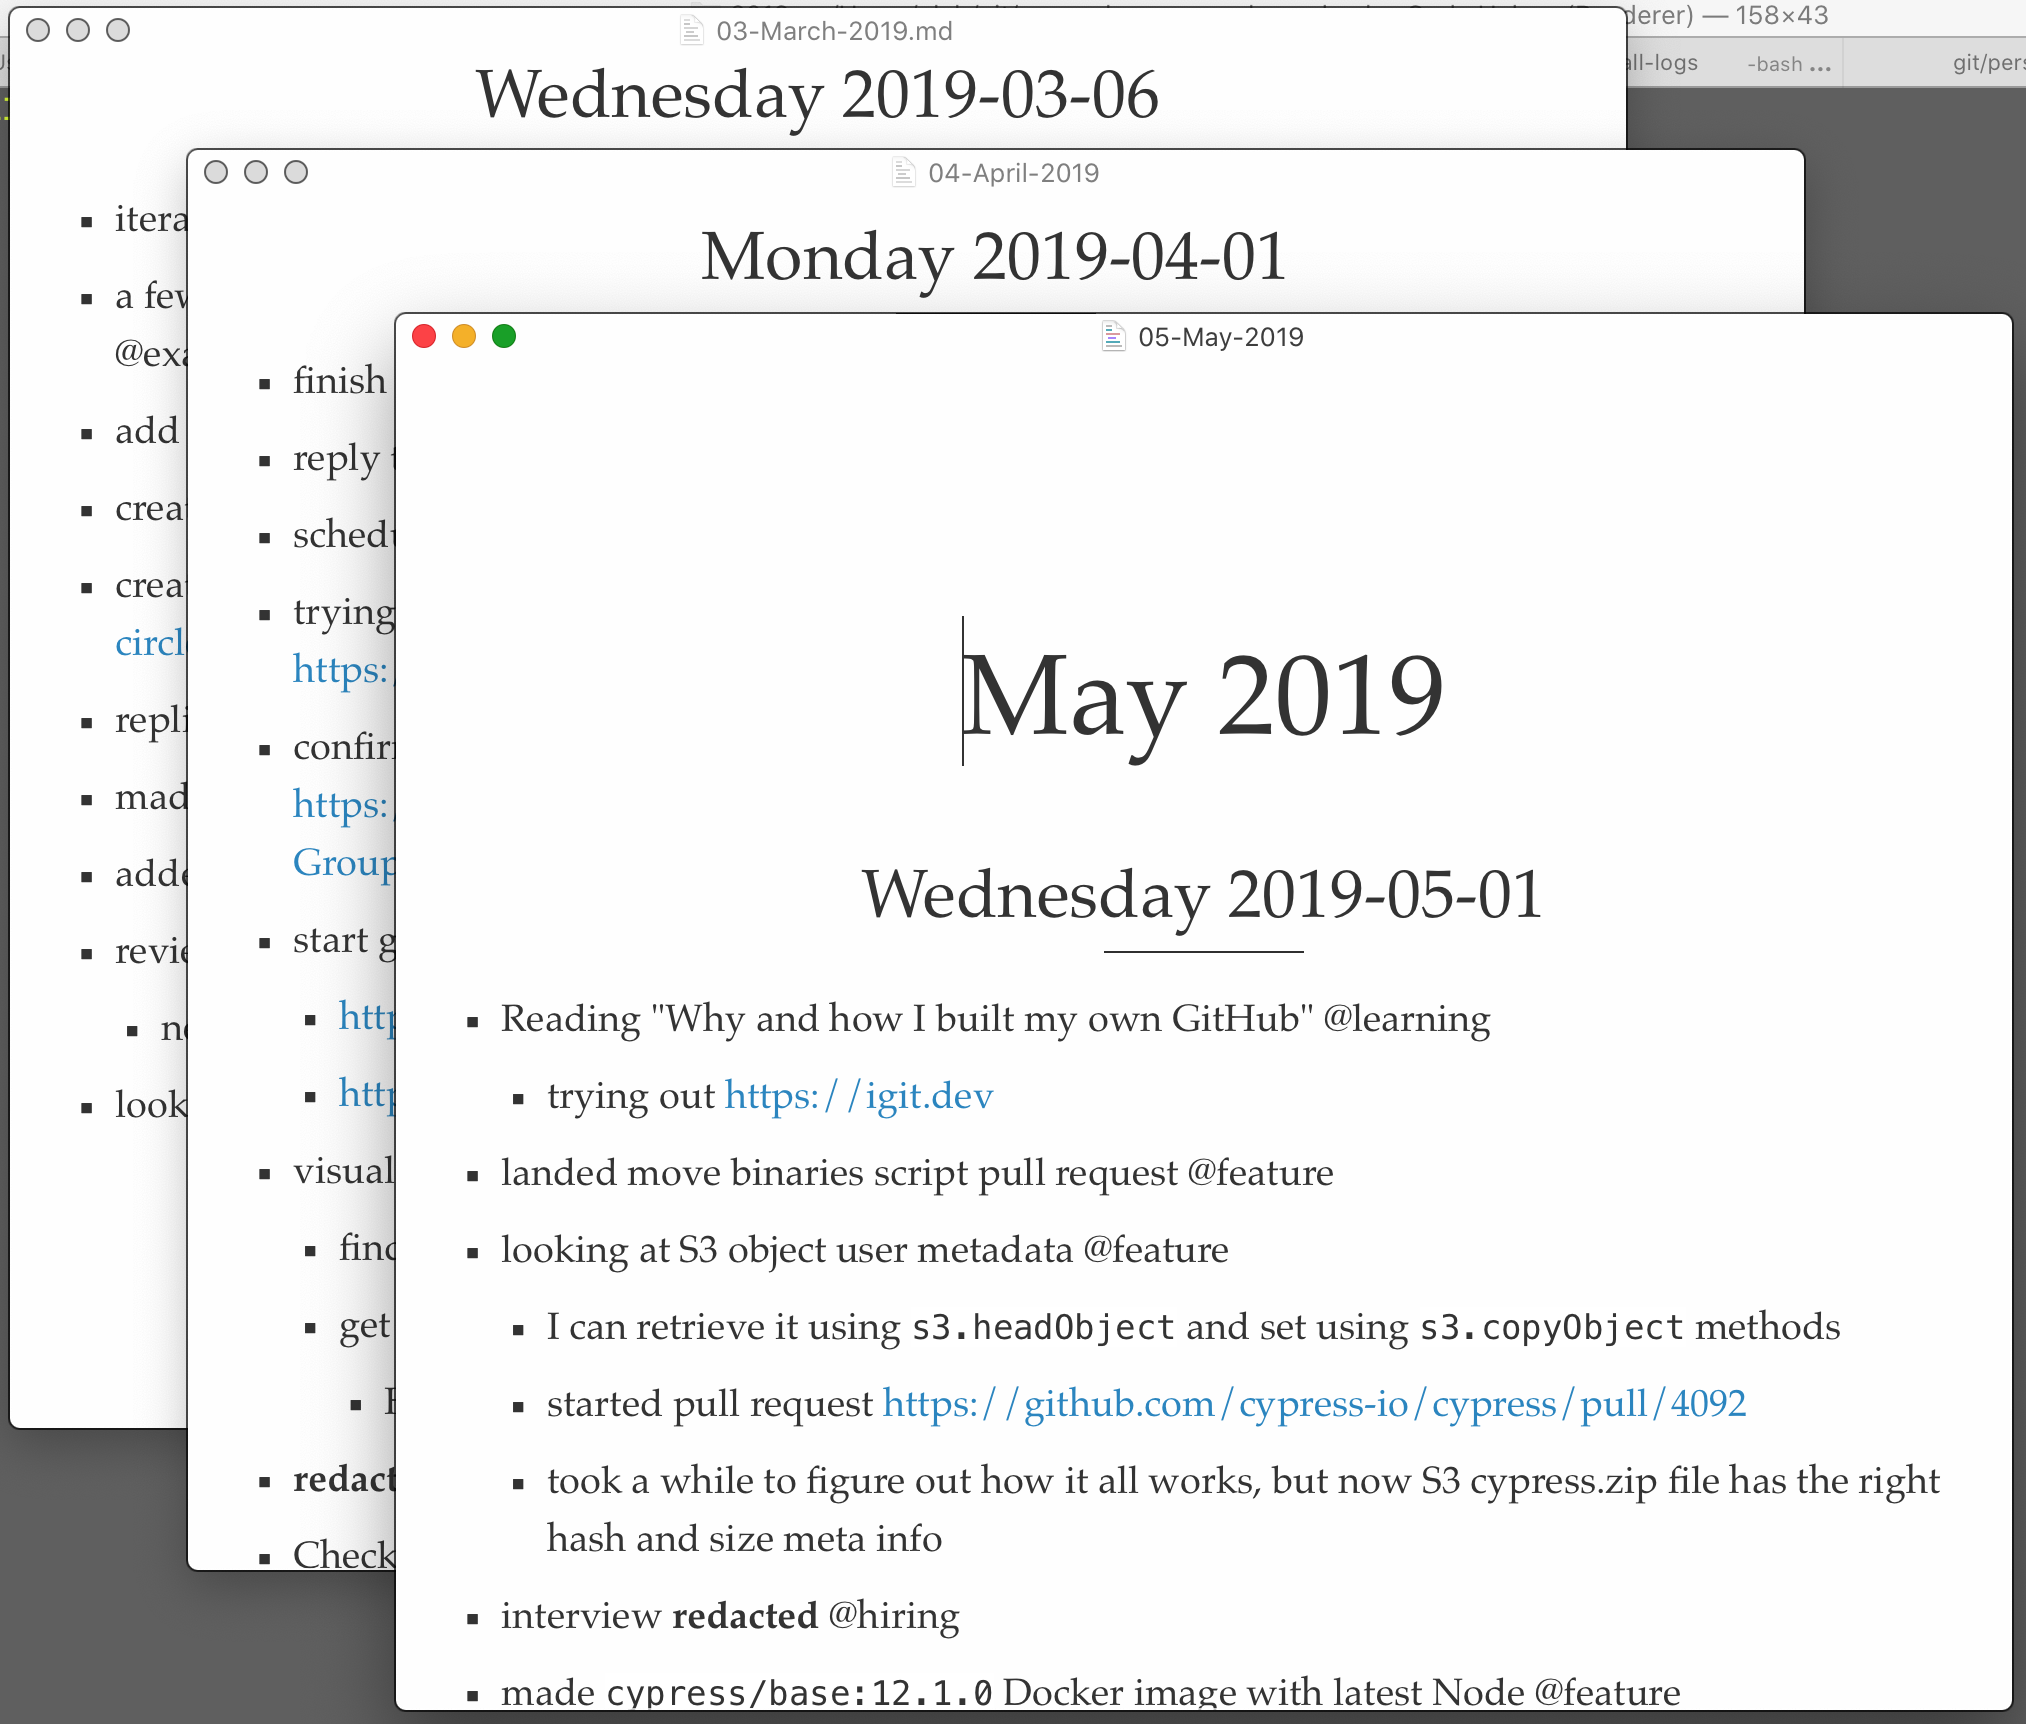
You can find the monthly files grouped by year: 2019 and 2020. Every day is level 2 heading, with the items in a plain list:
1 | # March 2019 |
Every top level item has a category tag. The "official" tags are:
@exampletask for when I created an example or a demo application to show a concept, like examples in the cypress-example-kitchensink and cypress-example-recipes repositories. I also tag most of the work related to the documentation with@examplebecause our docs do have lots of examples.@featureis the new code or fixing bugs or writing tests or documenting new feature@internalare utility tasks that are usually private to Cypress@supportsupporting our users@slidespreparing for a public presentation, working on slides, sending a proposal@presentationthe actual public presentation in front of people@learningis when I was learning something new@hiringworking to hire someone@blogwriting a blog post for https://www.cypress.io/blog/, https://glebbahmutov.com/blog/, or some 3rd party blog
Having these lightweight daily logs helps me during the team's daily standup (copy/paste into the chat bot), or to talk during the ongoing work with the team. It also tremendously helps me to remember the recent items whenever I need a link or a code snippet to share. It also helps me with "Todo" lists to avoid forgetting things I plan to work on in the future. Thus some of the lists are checklists, and it is ok to have some of them unfinished.
1 | - fix incorrect links in changelog 3.2.0 @feature |
Totals
We can extract the items from Markdown files, group them by tag, and save the totals per month using the scripts in the repo.
1 | npm install |
I generate counted.csv, counted.json, and even counted.md files. Let's look at what I have done in total over the past year and a half.
| label | blog | example | feature | hiring | internal | learning | presentation | slides | support |
|---|---|---|---|---|---|---|---|---|---|
| 03-March-2019 | 10 | 33 | 51 | 6 | 16 | 6 | 5 | 27 | 5 |
| 04-April-2019 | 7 | 31 | 63 | 10 | 19 | 9 | 6 | 38 | 3 |
| 05-May-2019 | 11 | 24 | 67 | 11 | 14 | 4 | 3 | 15 | 1 |
| 06-June-2019 | 6 | 25 | 80 | 5 | 16 | 9 | 2 | 19 | 6 |
| 07-July-2019 | 7 | 24 | 80 | 13 | 21 | 5 | 1 | 28 | 4 |
| 08-August-2019 | 8 | 21 | 51 | 18 | 16 | 5 | 3 | 13 | 10 |
| 09-September-2019 | 9 | 12 | 80 | 13 | 18 | 8 | 4 | 31 | 11 |
| 10-October-2019 | 3 | 23 | 68 | 2 | 10 | 4 | 4 | 12 | 9 |
| 11-November-2019 | 7 | 22 | 69 | 1 | 9 | 4 | 4 | 8 | 9 |
| 12-December-2019 | 6 | 30 | 78 | 11 | 11 | 1 | 4 | 9 | 8 |
| 01-January-2020 | 5 | 47 | 83 | 3 | 7 | 2 | 2 | 7 | 8 |
| 02-February-2020 | 2 | 30 | 89 | 1 | 4 | 3 | 4 | 13 | 4 |
| 03-March-2020 | 13 | 41 | 96 | 2 | 11 | 5 | 3 | 16 | 3 |
| 04-April-2020 | 3 | 42 | 118 | 0 | 11 | 3 | 6 | 16 | 6 |
| 05-May-2020 | 7 | 58 | 112 | 0 | 8 | 5 | 3 | 19 | 9 |
| 06-June-2020 | 15 | 41 | 111 | 0 | 11 | 6 | 5 | 21 | 7 |
| 07-July-2020 | 14 | 47 | 81 | 1 | 10 | 7 | 2 | 7 | 3 |
| 08-August-2020 | 9 | 24 | 54 | 0 | 14 | 5 | 3 | 13 | 6 |
| total | 142 | 575 | 1431 | 97 | 226 | 91 | 64 | 312 | 112 |
| total (%) | 4.66 | 18.85 | 46.92 | 3.18 | 7.41 | 2.98 | 2.10 | 10.23 | 3.67 |
| average | 8 | 32 | 80 | 5 | 13 | 5 | 4 | 17 | 6 |
The total (%) number divides the total of the current column against the sum of all items (3050) to show the relative number of particular tag. The average number for each column divides the total for each column by 18 months.
You can throw the above CSV into a chart, I like to plot the average breakdown of all tasks by type to get a sense of where I have spent most of my efforts.
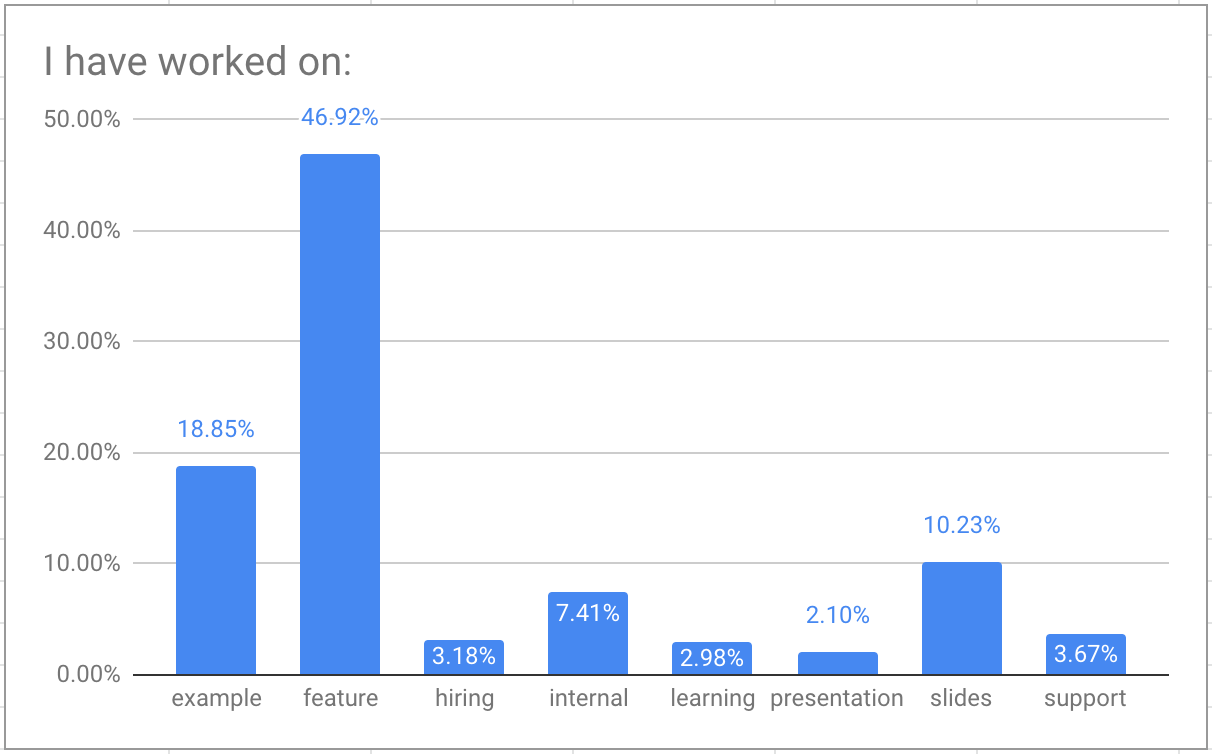
Let's take a look at the top three types of work I have done over the past 18 months, and then at the rest.
My top three
Features, features, features
Every month, on average, I worked on 80 items that could be considered "feature work": actual features for Cypress test runner and its numerous parts, build tooling, etc. This number includes the bug fixes as well - anything that touches the code and changes how it works is a "feature" in general sense.
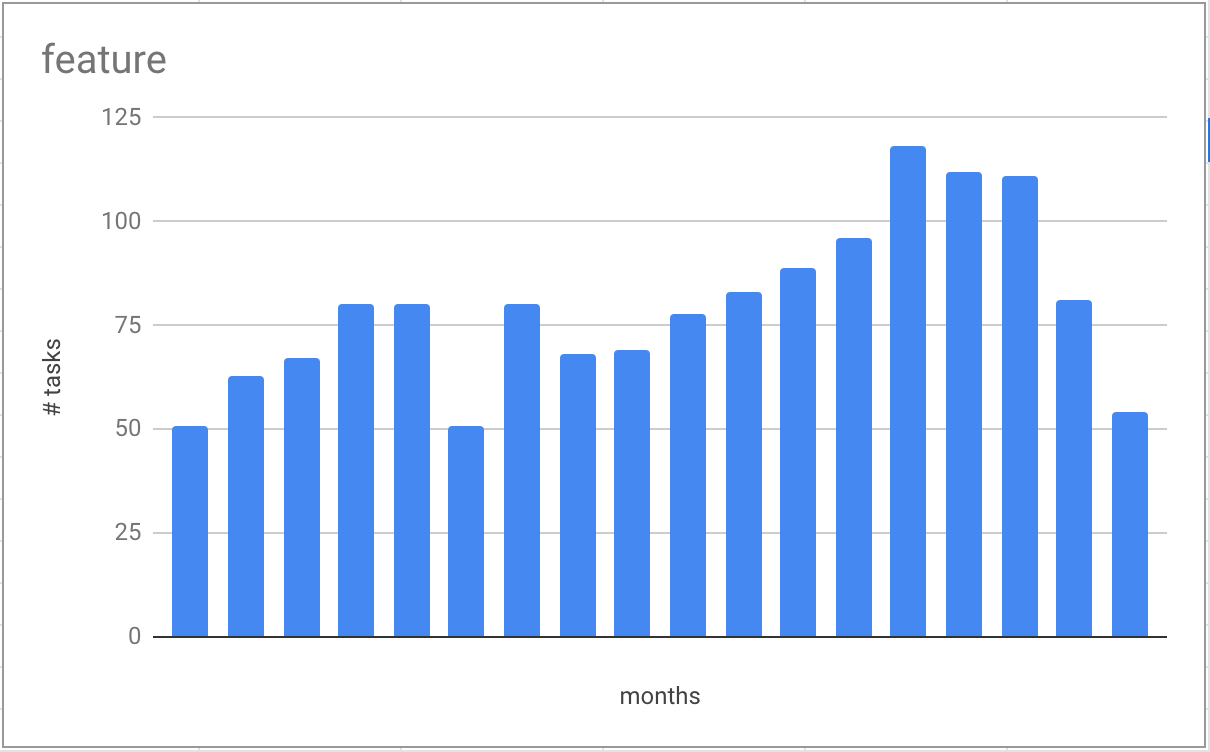
Even better, as the chart above shows, my productivity has generally increased lately. This is due to accumulating a lot of knowledge of Cypress internals and its build steps, and also due to putting effort to bring new features to the users, like component testing which keeps me interested and strongly motivated.
More examples please
My second biggest chunk of work is creating new examples for our users. On average, I have worked on examples 32 times a month. In my personal opinion, no software can be successful without lots and lots and lots examples. We are working on a complex tool, it gets tricky very quickly (unfortunately), and our users will only be successful when you show them how to handle the different test scenarios.
I wanted to do more - yes, we do have example.cypress.io with small examples, and cypress-example-recipes with more than 70 larger recipes. I have contributed to both repos a lot, here is the recipes repo for example:
But we could do more. This is why I wrote cypress-fiddle and made a prototype site glebbahmutov.com/cypress-examples/ from bahmutov/cypress-examples; this project would allow our team to write 10 times more examples than we have right now in a shorter amount of time.
Presentations
The last top item that has occupied my time was preparing and giving presentations. I have done conference talks, Cypress webinars, and internal presentations at other companies. Every talk requires preparation, on average I have 5 times as many prep tasks (tagged @slides) as the presentations themselves (tagged @presentation).
The bottom four
From the report, you can see I don't spend much time in the meetings, interviewing candidates, supporting users, or learning. Let's dig into these numbers a little bit, since they are a little bit misleading.
I can count myself lucky. I had very few internal meetings, under 10% of my tasks. The Cypress engineering process is pretty lightweight, and does not require too much team syncing. Thus the @internal items are only occupying a tiny percentage of my weekly activities. It might change in the future, as the company is growing. We will see.
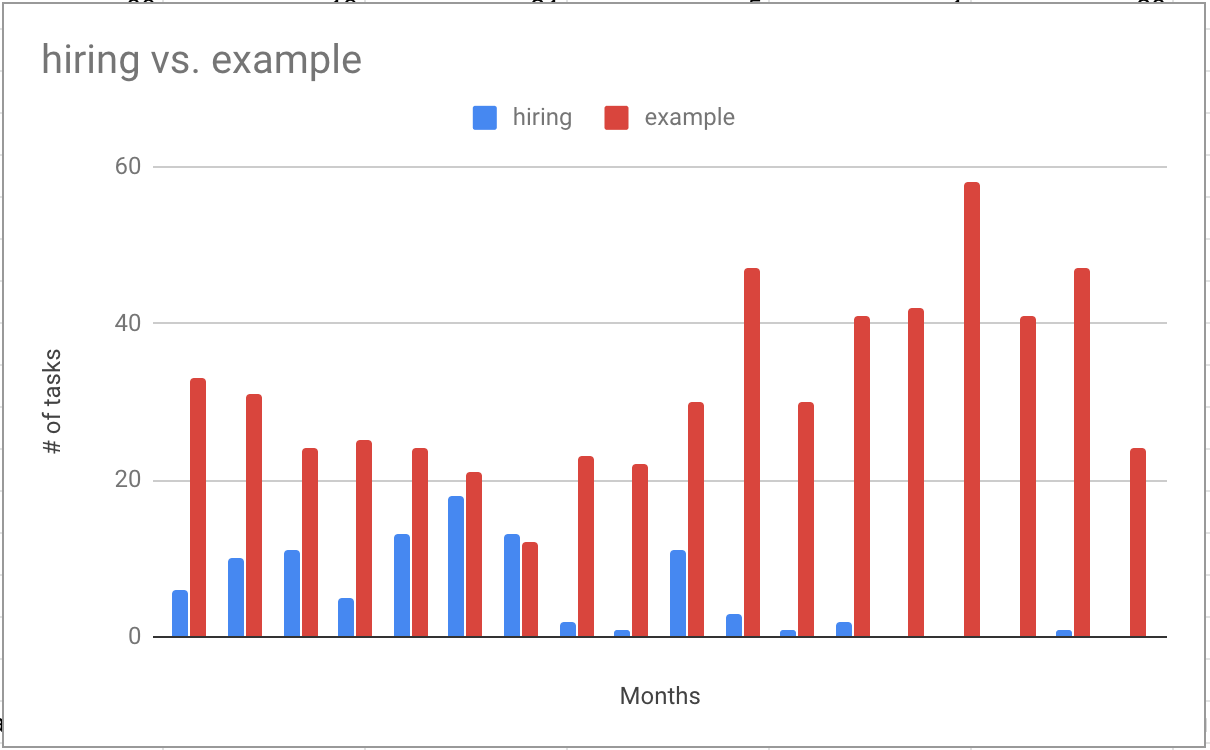
Another interesting trend relates to hiring. I have joined Cypress 3 years ago in May of 2017 when the entire company had only five people. As we grew, I had to interview a lot of people to hire for every engineering position. As we reached our current size, the need to personally interview every candidate disappeared. Thus I could spend more time writing examples, while essentially stopping interviewing in the recent months.
There are very few items marked @support - not because I do not answer users' questions in Cypress chat or on Twitter, or via GH issues. I answer these public questions a lot, usually by sending links to examples! Thus I would mark work to create a public example and send it to the user as @example. Most of the items marked @support is an actual user session with our Cypress users due to some difficulty in setting up Cypress in their environment, or running into a problem in a specific app, etc - the paid support.
Finally, the tasks marked @learning are honestly an undercount of the daily stream of articles, videos, and tutorials I go through. I just don't always remember to add them into the daily log. I would say about one or two items per day should be in this category, but alas I don't have a record to support it.
GitHub Activity
I am lucky to do most of my work in the open using mostly public GitHub repositories, issues, and NPM packages. Thus one can see (mostly) everything from the pas 18 months in the table below.
| Month | GH | Commits | New repos | PRs | Reviews | Opened issues | Total | Level |
|---|---|---|---|---|---|---|---|---|
| March 2019 | Link | 697 | 13 | 45 | 8 | 72 | 138 | 100% |
| April 2019 | Link | 1391 | 7 | 49 | 8 | 58 | 122 | 88% |
| May 2019 | Link | 1038 | 8 | 52 | 10 | 47 | 117 | 85% |
| June 2019 | Link | 925 | 12 | 43 | 13 | 31 | 99 | 72% |
| July 2019 | Link | 1663 | 13 | 44 | 16 | 63 | 136 | 99% |
| August 2019 | Link | 378 | 4 | 26 | 7 | 31 | 68 | 50% |
| September 2019 | Link | 715 | 10 | 24 | 11 | 30 | 75 | 54% |
| October 2019 | Link | 1095 | 5 | 42 | 18 | 41 | 106 | 77% |
| November 2019 | Link | 1012 | 11 | 39 | 23 | 58 | 131 | 95% |
| December 2019 | Link | 1169 | 11 | 32 | 27 | 35 | 105 | 76% |
| January 2020 | Link | 802 | 7 | 62 | 34 | 41 | 144 | 104% |
| February 2020 | Link | 1190 | 10 | 79 | 42 | 80 | 211 | 160% |
| March 2020 | Link | 1386 | 9 | 81 | 34 | 74 | 198 | 143% |
| April 2020 | Link | 1145 | 29 | 85 | 26 | 89 | 229 | 166% |
| May 2020 | Link | 1311 | 30 | 89 | 38 | 102 | 259 | 188% |
| June 2020 | Link | 1183 | 8 | 51 | 35 | 66 | 160 | 116% |
| July 2020 | Link | 943 | 7 | 62 | 35 | 57 | 161 | 117% |
| August 2020 | Link | 743 | 4 | 19 | 27 | 14 | 64 | 46% |
Total = new repos + PRs + reviews + opened issues
We take the first month of March 2019 as the base level of 100% and normalize the GH work against that month.
Level = month's total / 138 * 100
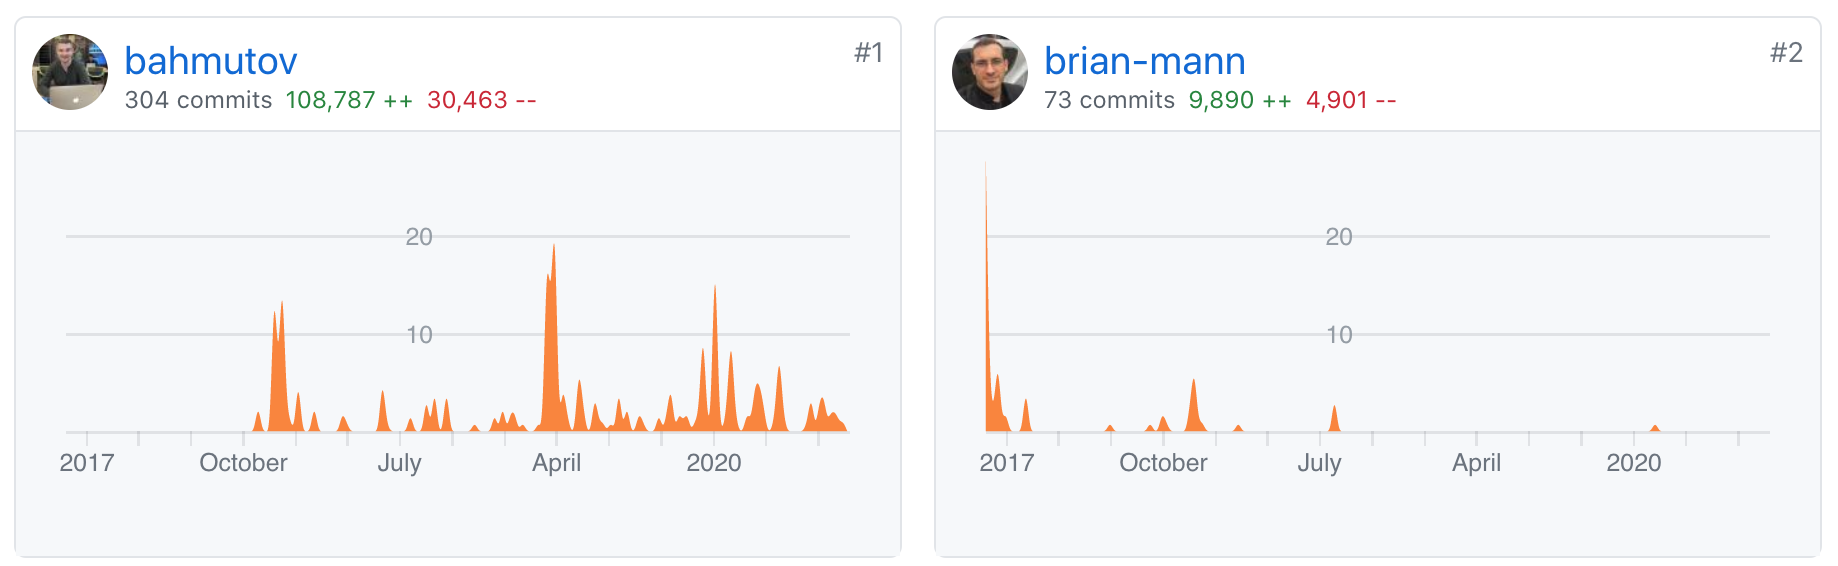
Let's plot the Level column. I see a mostly productive 2020. I have skipped August 2020 since I am taking a couple of weeks off. August 2019 is also a "down" month since the entire family went on a trip.
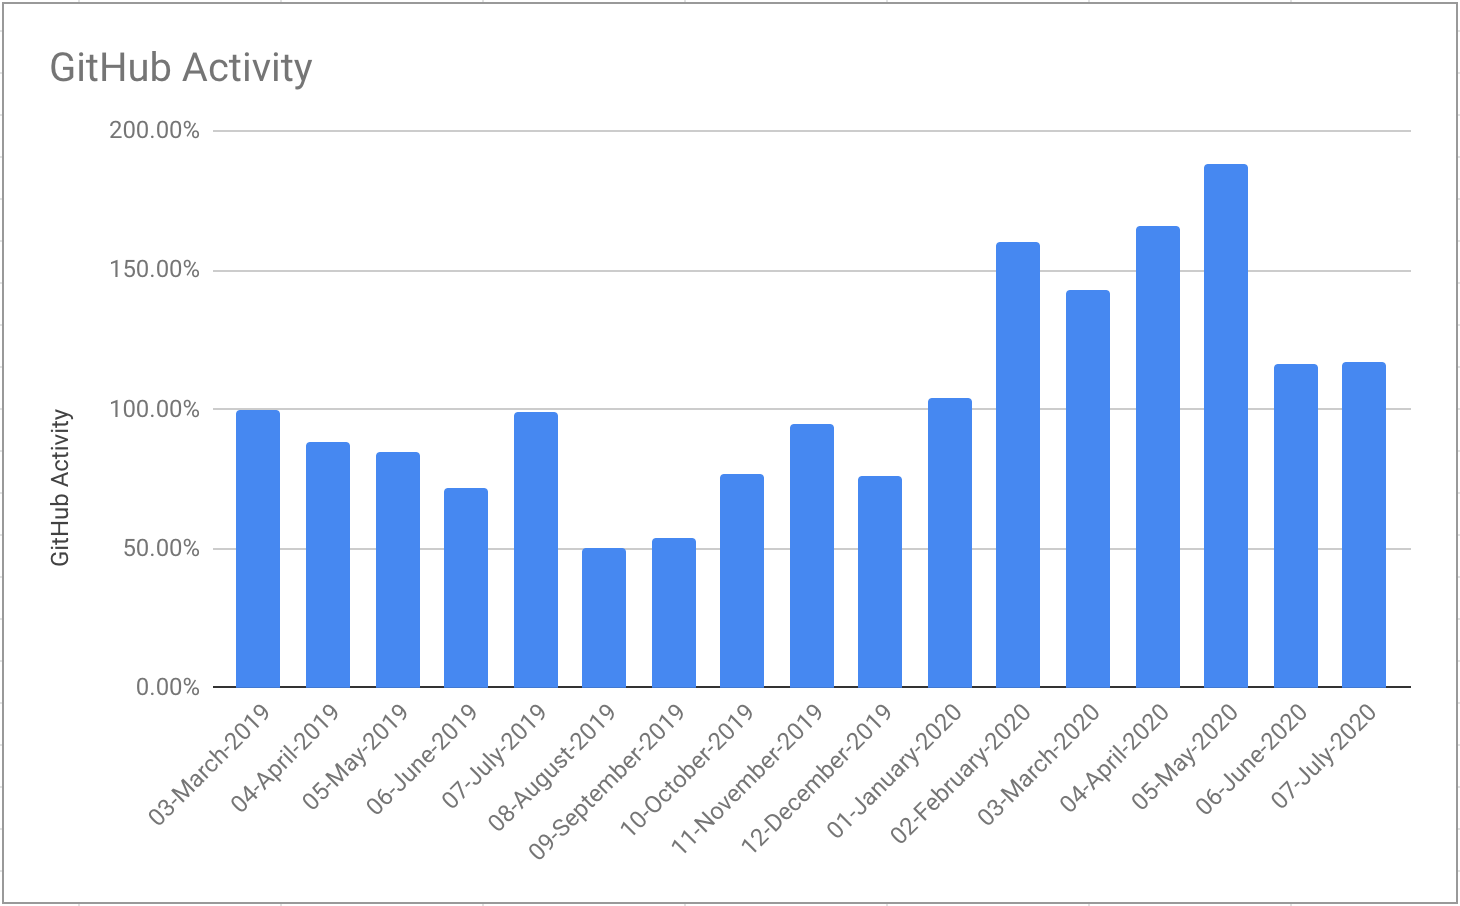
The daily logs and the GitHub activity are in agreement with each other - compare the above contributions chart to the "hiring vs examples" chart - the overall shape of the red example bars matches the GitHub activity chart here.
I love my open source work at github.com/cypress-io and in personal repositories github.com/bahmutov. I hope my next 18 months are as productive!