Note: you can find the source code for this blog post at github.com/bahmutov/chart-testing-example.
Charts
I have found a great JavaScript library for creating SVG charts github.com/frappe/charts with a demo website at https://frappe.io/charts. Creating a chart is as simple as including a single script tag and writing a little snippet like
1 | <body> |
1 | // app.js |
which produces a bar chart like this:
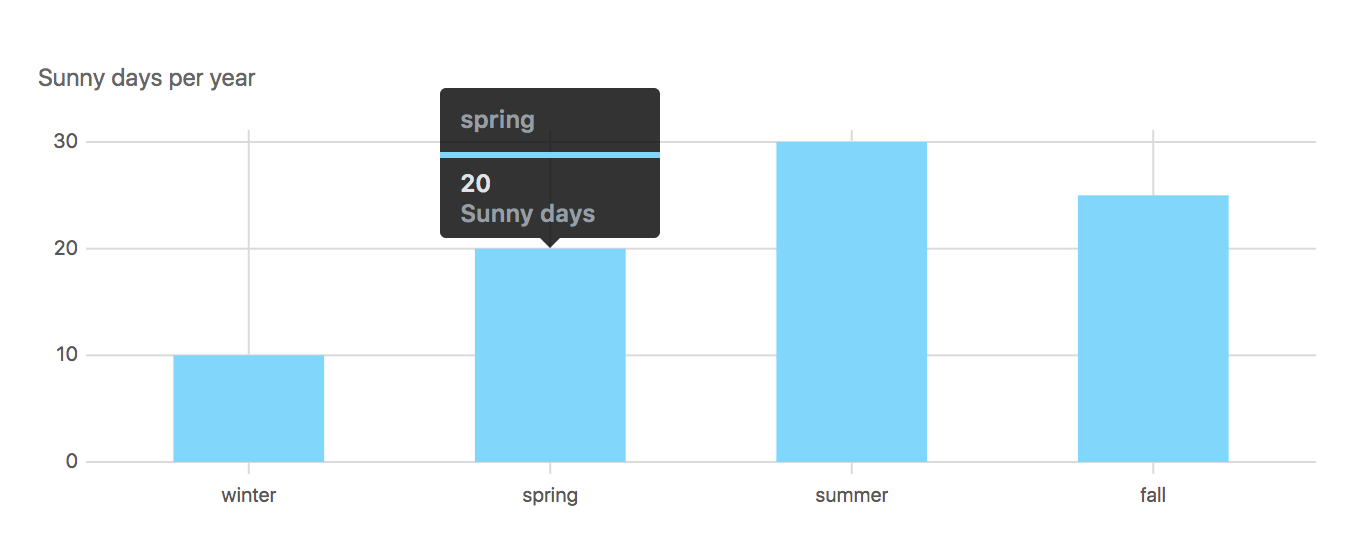
Great, but how do I actually test this chart? How do I ensure that I accidentally do not break my code when upgrading from [email protected] to [email protected]?
Functional tests
First, let's start testing this SVG chart using Cypress.io test runner. I will install cypress, parcel-bundler (to server local site) and start-server-and-test (for starting the server and the tests).
1 | { |
The first test should load the site and assure that the chart is visible
1 | /// <reference types="Cypress" /> |
We can start Cypress GUI with npm run dev and see the first test pass
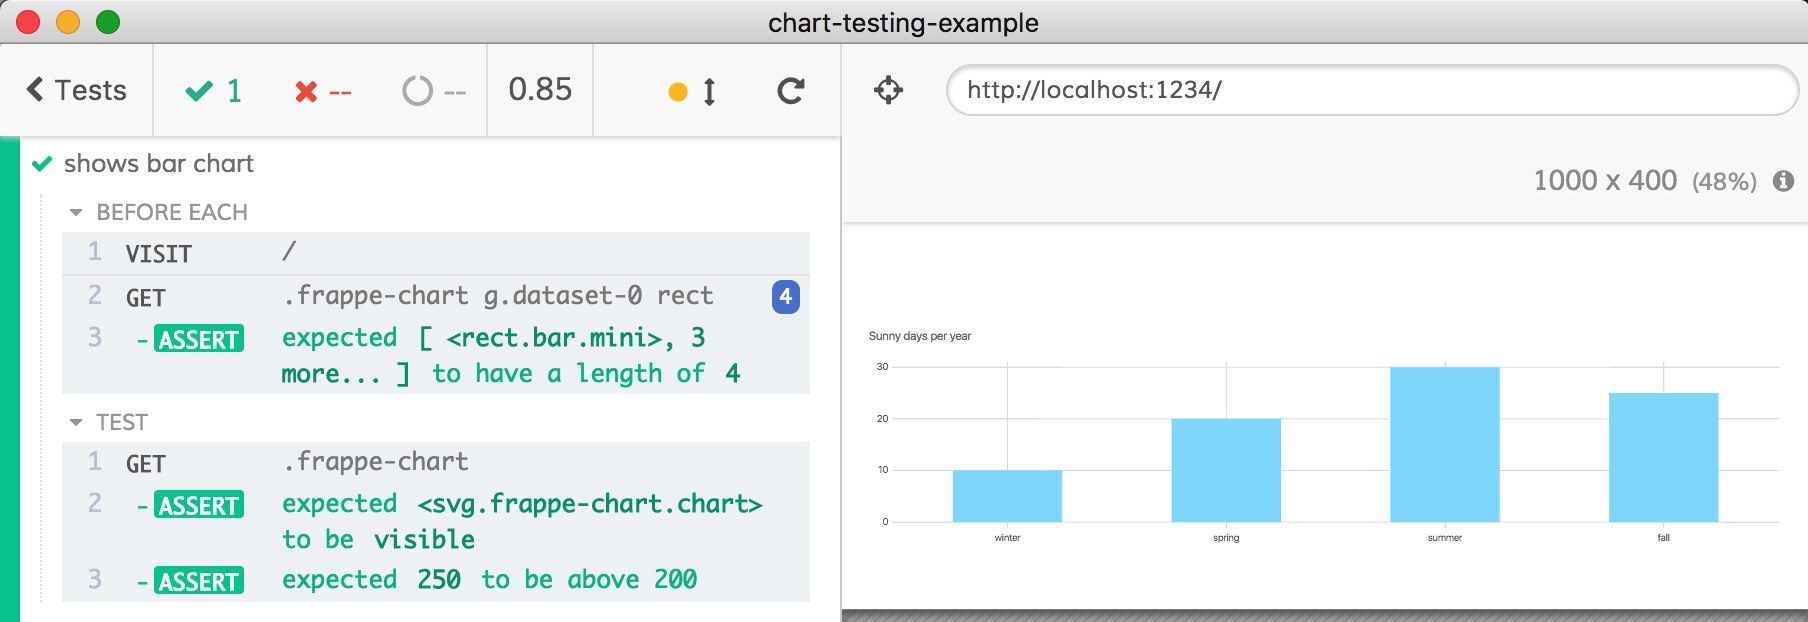
Do you see delayed data load with animation? It happens after the test has already finished. I would like my test to only finish when all 4 bars are rendered, so I will change my test to find the four SVG rectangles.
1 | /// <reference types="Cypress" /> |
The test now waits for the rectangles to appear - and then it finishes.

Since we are always going to load the chart, let us move the cy.visit and rectangle check to beforeEach hook. Even better, we can move the URL to cypress.json settings file.
1 | { |
1 | /// <reference types="Cypress" /> |
The beforeEach commands are shown in its own top section of the Command Log.
Testing tooltip
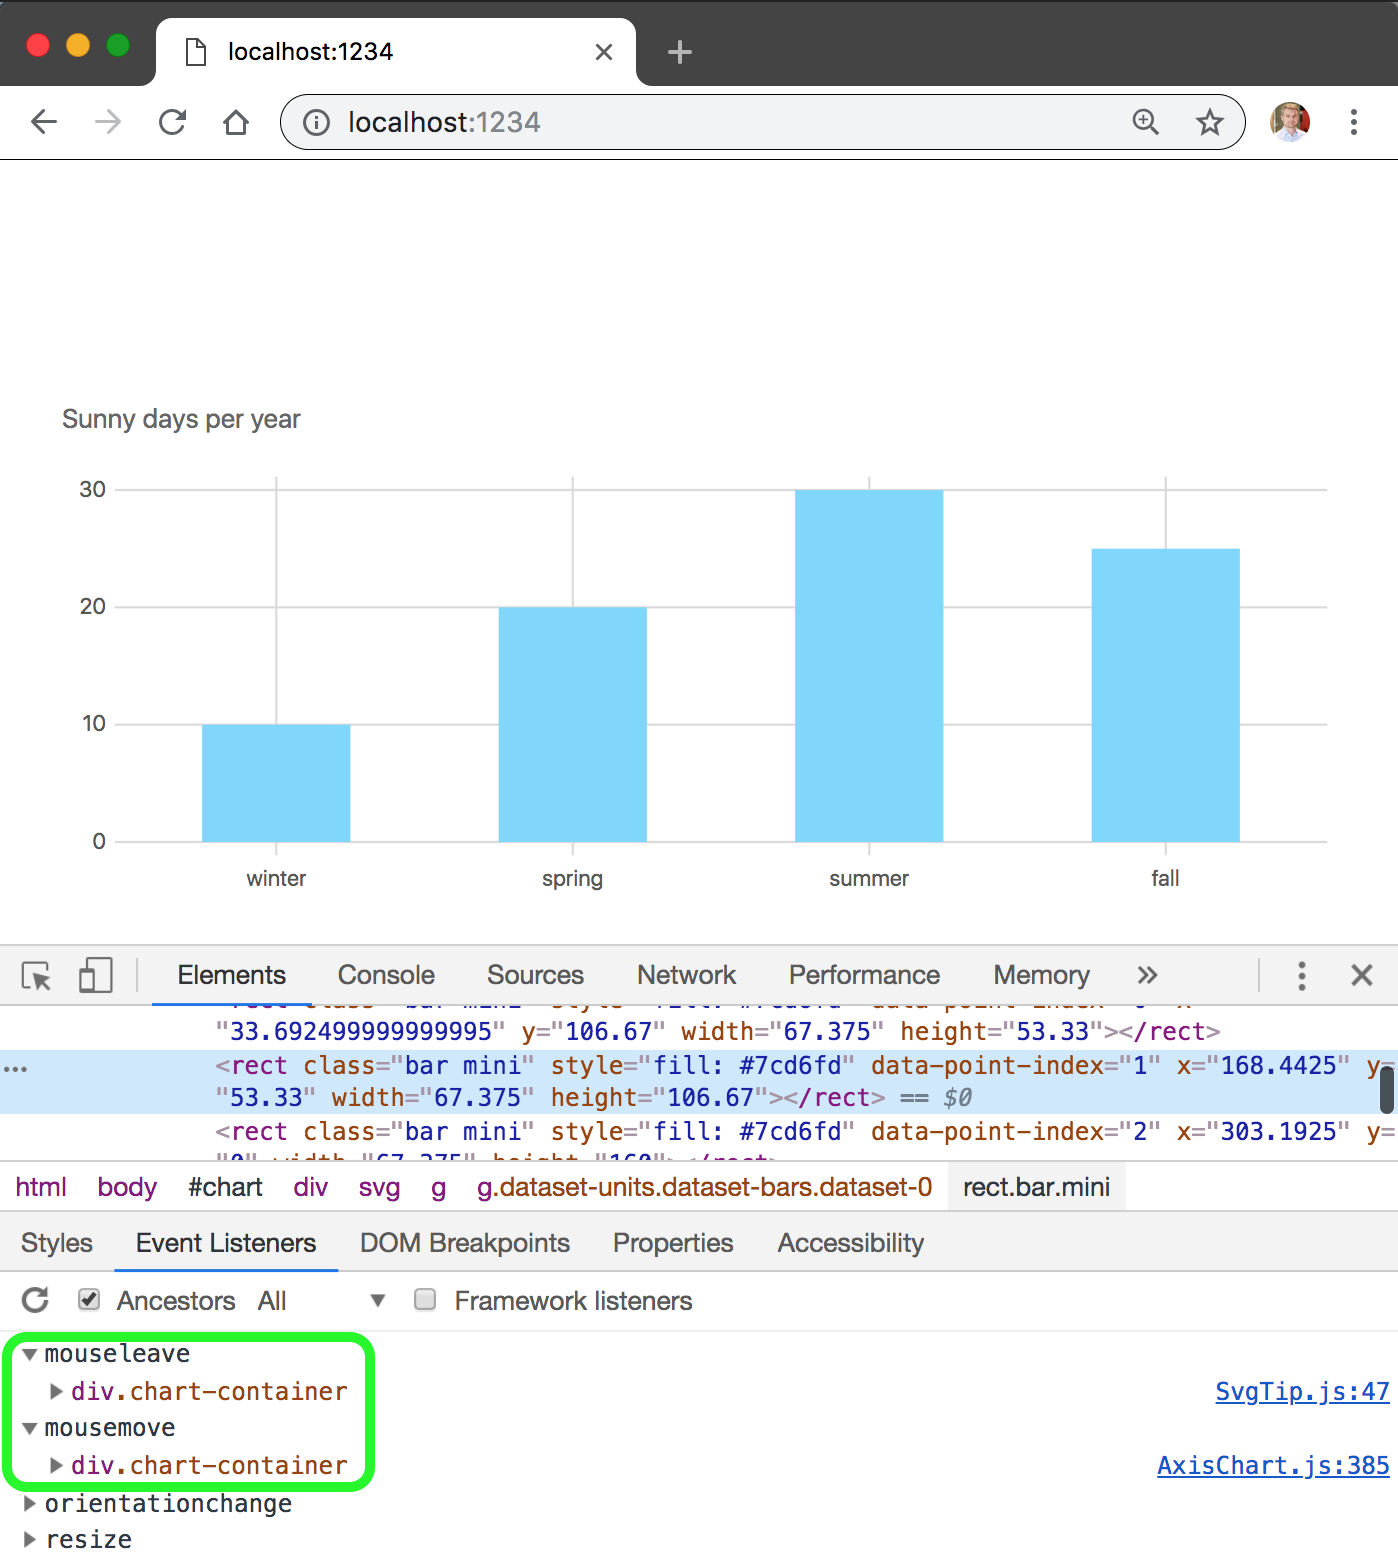
When I hover over a bar in my chart, a tooltip pops up. Can I test that it does? Cypress does not support :hover yet, but looking at the event listeners for the SVG rect element I notice that the tooltip is connected to mousemove and mouseleave events.
Maybe I can get the tooltip to show up by using cy.trigger('mousemove') command?
1 | cy.get('.frappe-chart g.dataset-0 rect') |
Yes! The tooltip shows up. Let us confirm it - and because the tooltip is hidden with style="opacity: 0" attribute, we can assert that it is initially hidden, then shown, then hidden again by writing small utility functions tooltipHidden and tooltipVisible.
1 | const tooltipHidden = () => |
I have added cy.wait(1000) to pause the test and make the tooltip visible.
Tooltip for each bar
A different tooltip appears when the mouse moves over each bar. Let us test it. For now, I will hardcode the season labels in the test.
1 | it('shows tooltip for each season', () => { |
The test runs through the four vertical bars and confirms the tooltip has the right label
Reading labels at run-time
Instead of hardcoding the labels in the test, we can read the labels from the application at run-time. First, we need to expose the chart reference or its data object reference during Cypress tests. Here is my preferred way of doing this:
1 | if (window.Cypress) { |
From now on, if you open DevTools during Cypress tests, and point the context at the application's iframe, you will be able to walk to the labels via window.chart object.
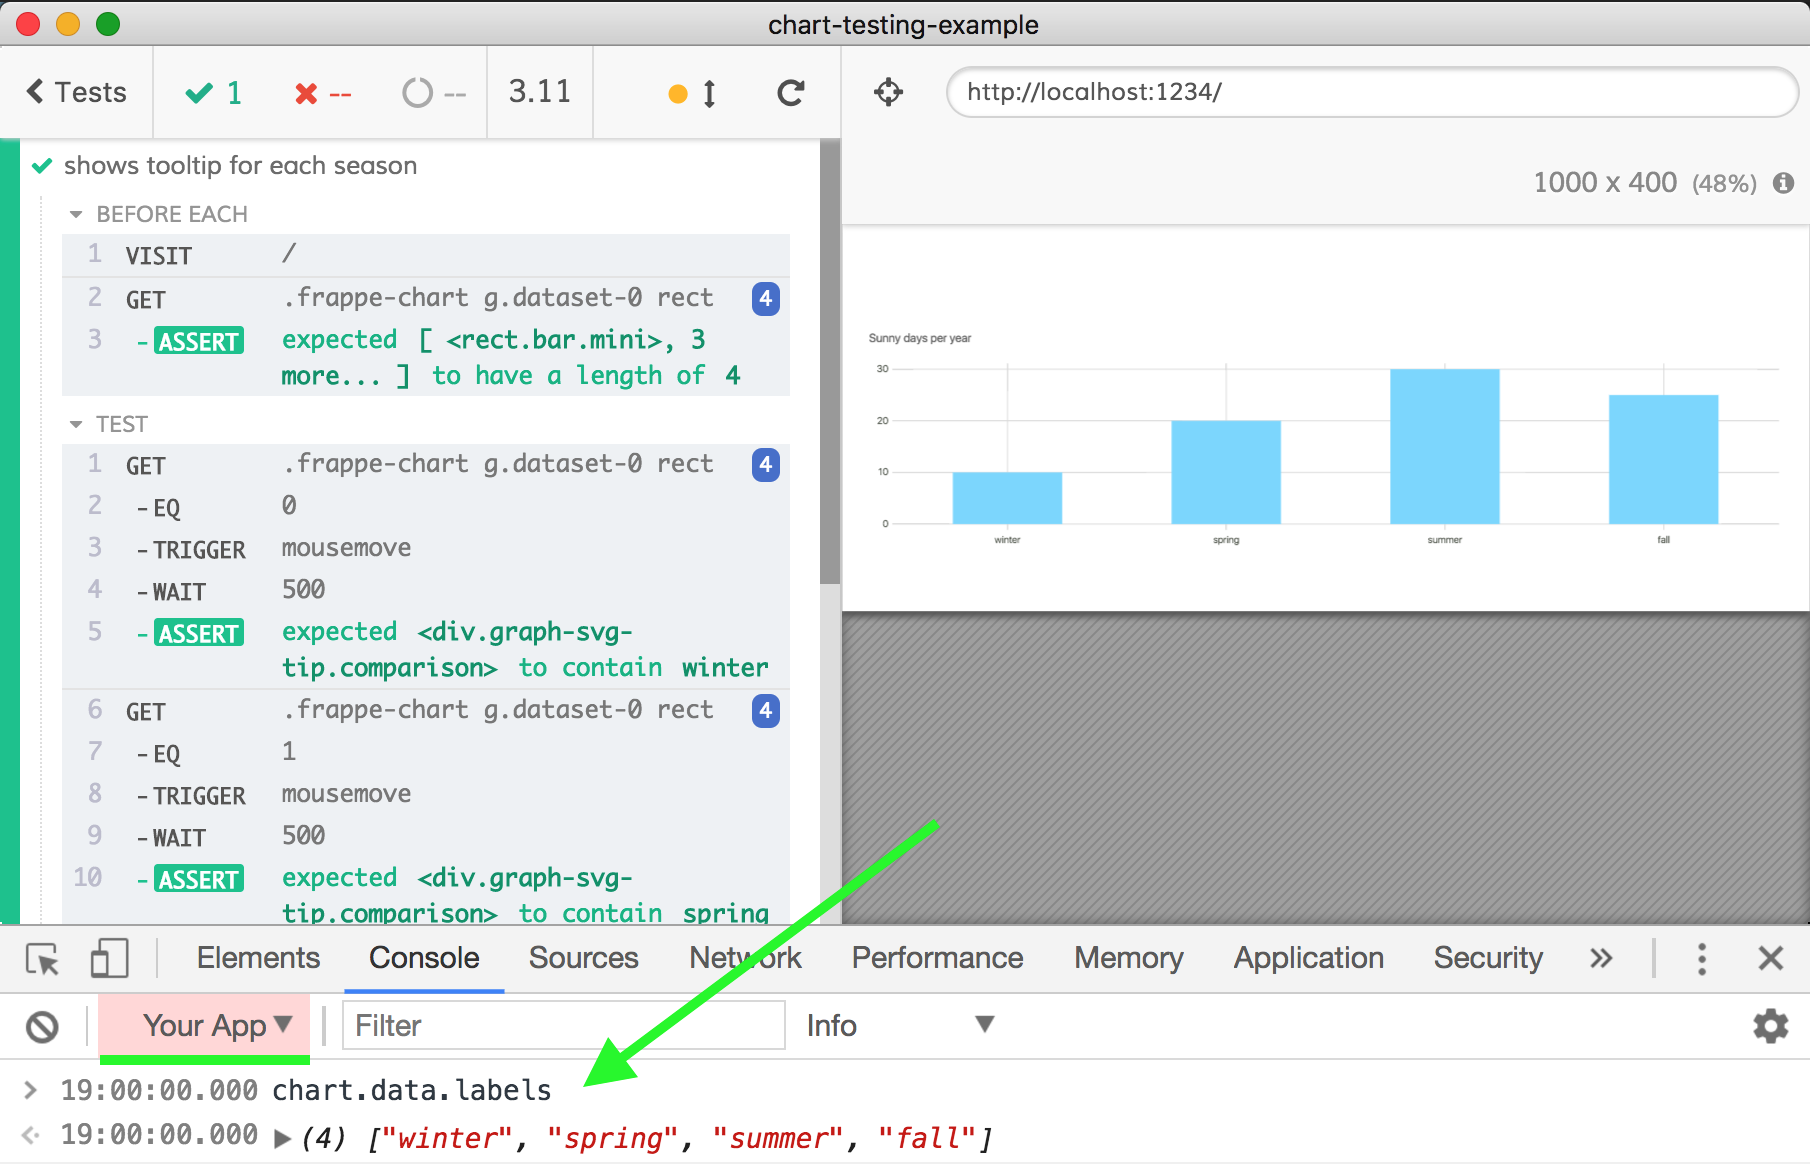
We can read these labels from our tests too using cy.window() and cy.its()
1 | it('shows tooltip for each defined label', () => { |
Super, the test is passing, just like before, but now the labels are not copied.
Reading labels at compile-time
Instead of exposing the application and reading labels during the test, we can factor the labels into its own JavaScript module and share them between the application and the test code. We are already using parcel-bundler to serve our code, so we can just extract the labels into its own file.
1 | export const labels = ['winter', 'spring', 'summer', 'fall'] |
1 | import { labels } from './labels' |
The application is bundled using parcel-bundler and served - just like before.
Cypress includes its own bundler, so we import labels from the spec file.
1 | /// <reference types="Cypress" /> |
Great, all working, and there is no code duplication.
Visual diffing with Applitools plugin
But what if the charts library publishes a new version, changing the appearance of the bar chart? Or what if someone comes and changes the beautiful blue color in app.js from #7cd6fd to the ugly #816c30? The functional tests like we have written above cannot check if the chart looks the same. Yes, we could check each positional property and every style property of every element on the page ... and that will super painful to write as a test.
Instead let's set up image diffing testing, in this case I will use Applitools Cypress plugin.
First, I will install the Applitools Cypress plugin
1 | npm install @applitools/eyes-cypress --save-dev |
Then I need to run
1 | npx eyes-setup |
Which should do 2 things: load Applitools from Cypress plugins file and load Applitools commands from the support file
1 | module.exports = (on, config) => { |
1 | // added by Applitools |
I then made an Applitools account using my GitHub account and grabbed my Applitools API key. The image below comes from the Applitools Cypress Quickstart tutorial.
Then from the terminal I have exported the key once
1 | export APPLITOOLS_API_KEY=<my api key> |
And now I am good to go. I have updated my tooltip test to use cy.eye... commands created by the Applitools plugin.
1 | it('shows tooltip for each season', () => { |
I run Cypress locally (with APPLITOOLS_API_KEY environment variable). A few seconds after the test completes, the Applitools web application dashboard shows the 4 images.
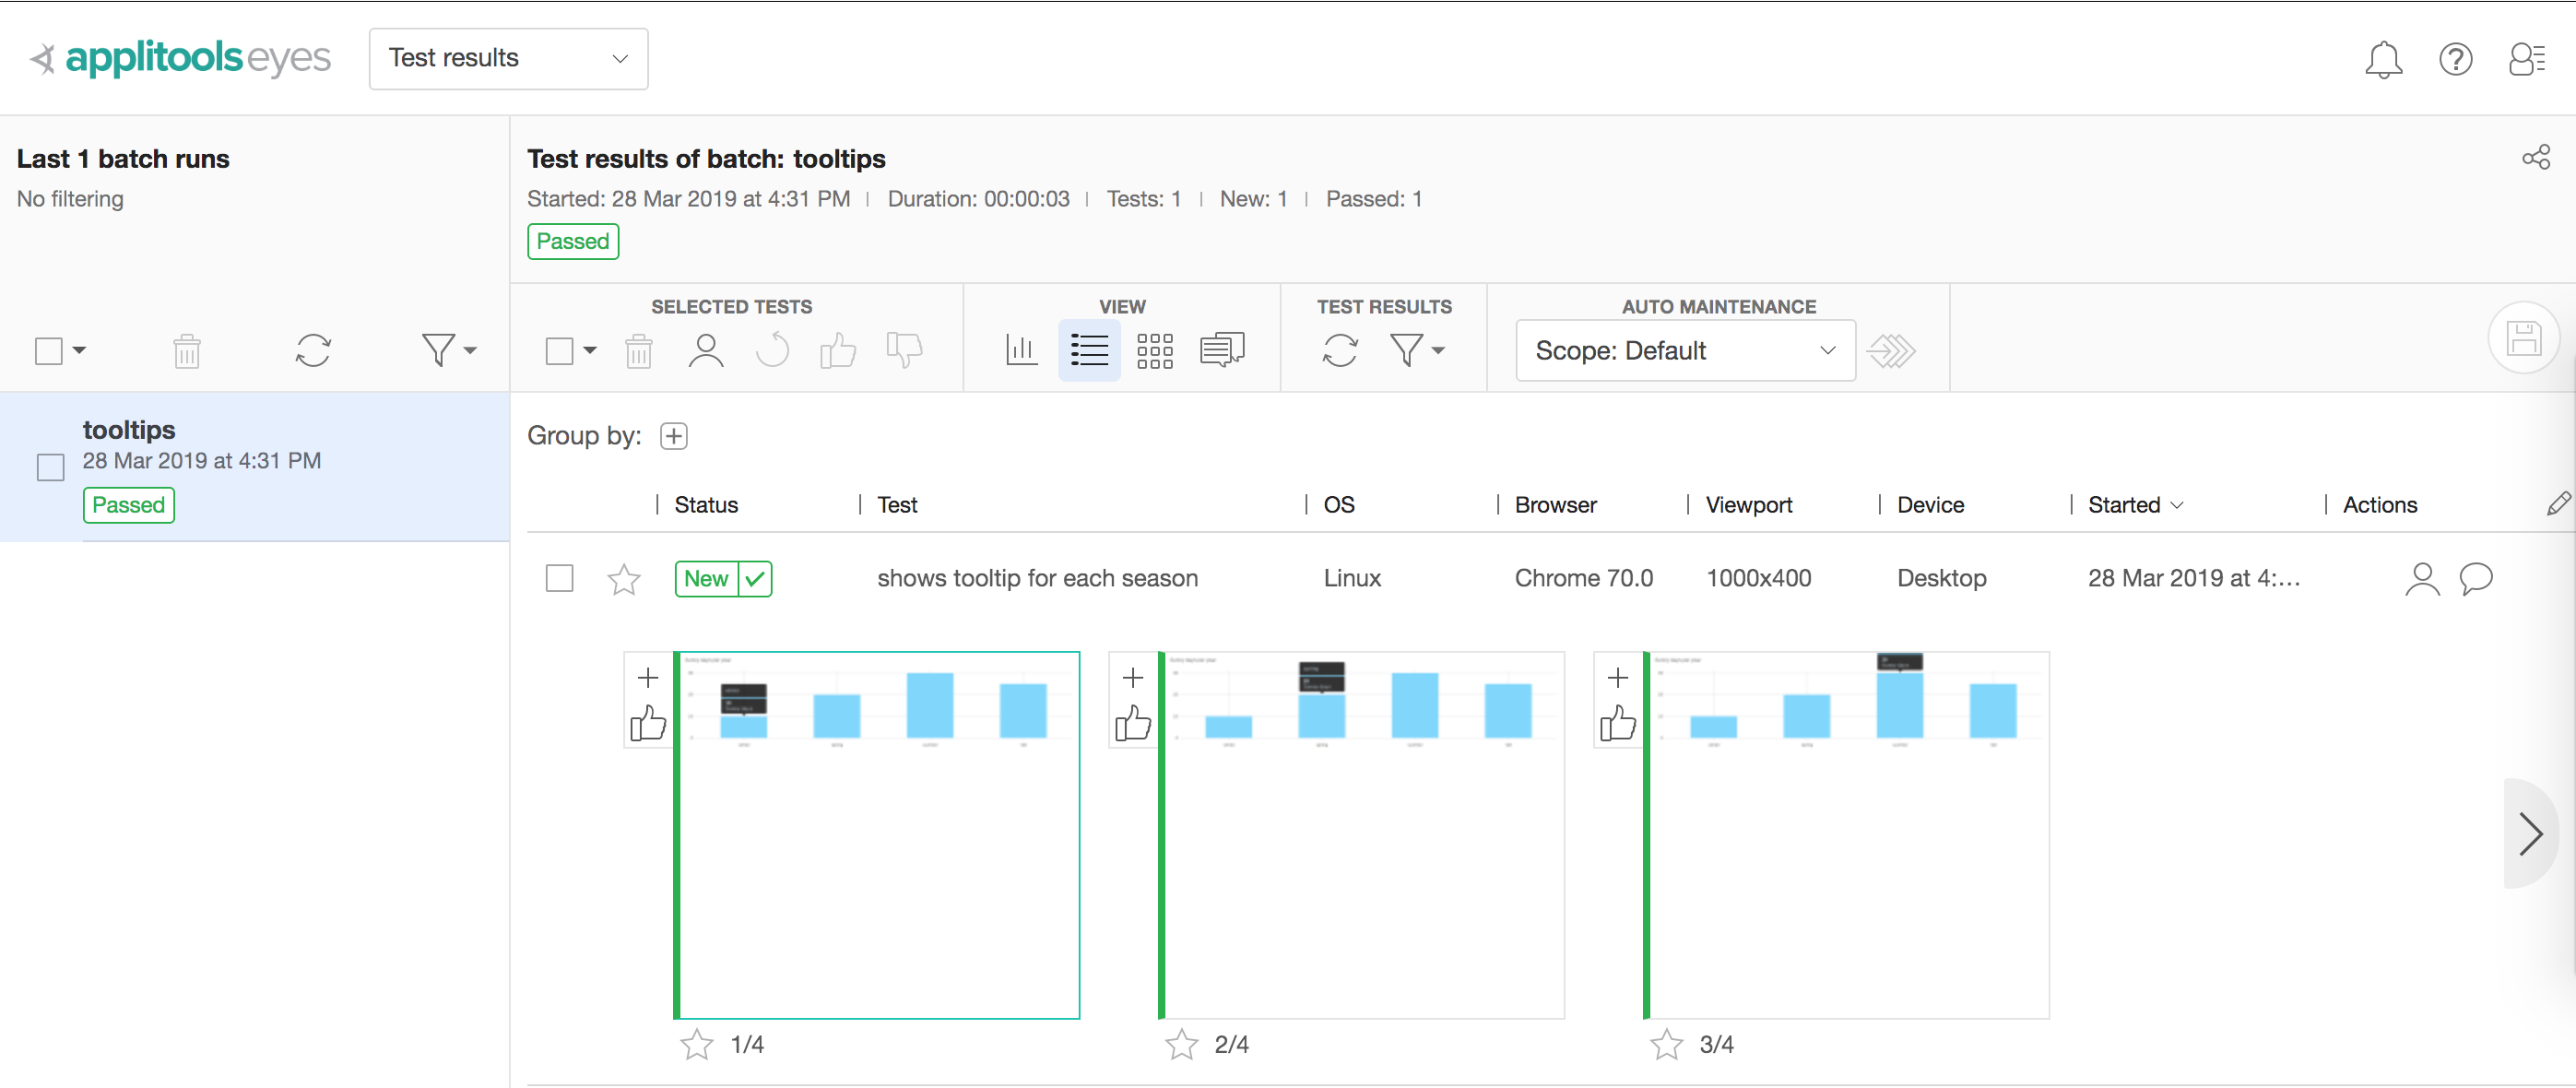
Because this is a new batch, all images were automatically accepted and saved as baselines. Let us change the color of the bars to my least favorite color #816c30 and just push the code to CI. I am using CircleCI and I have already set the APPLITOOLS_API_KEY as an environment variable there.
The CI run has failed, see https://circleci.com/gh/bahmutov/chart-testing-example/4 - and it has failed after the Applitools cloud that actually does image rendering and comparison has reported the changes asynchronously back to the test runner. That's why the failures are not reported immediately during the test, but inside the after test callback.
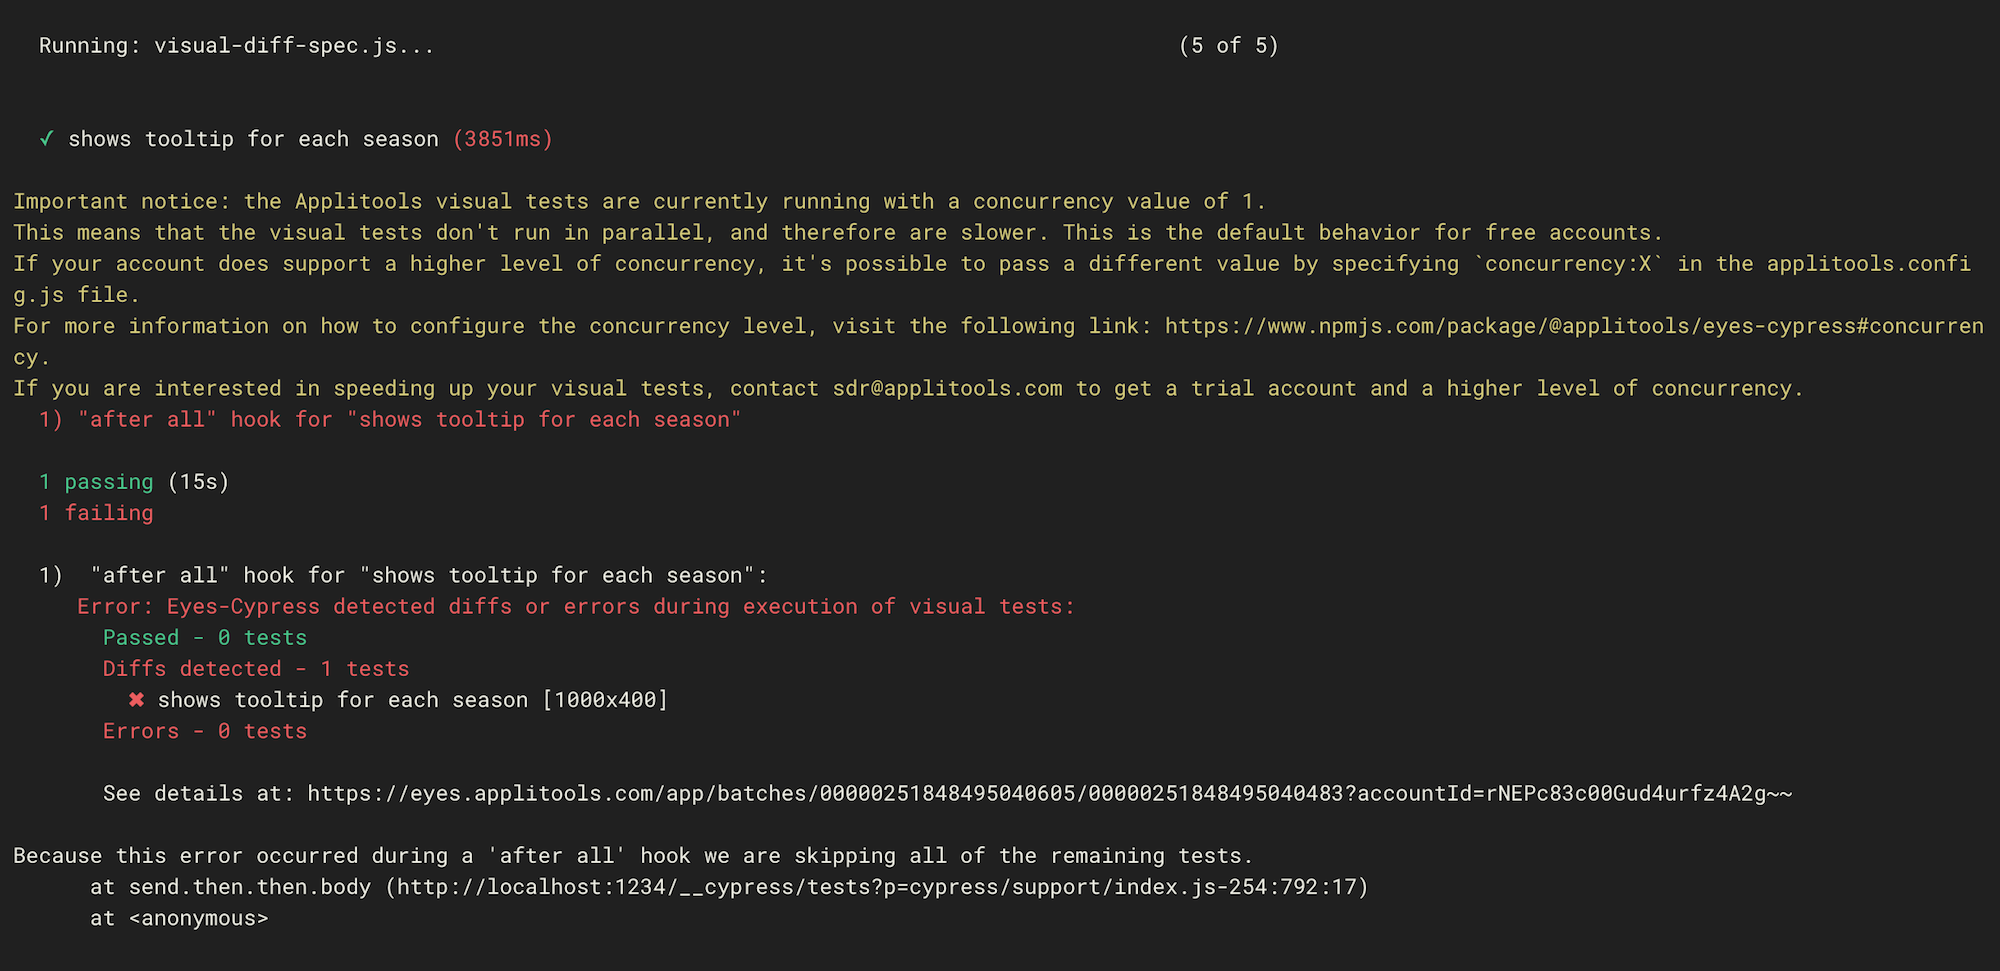
Let us go the Applitool dashboard to see why the test has failed visual comparison.
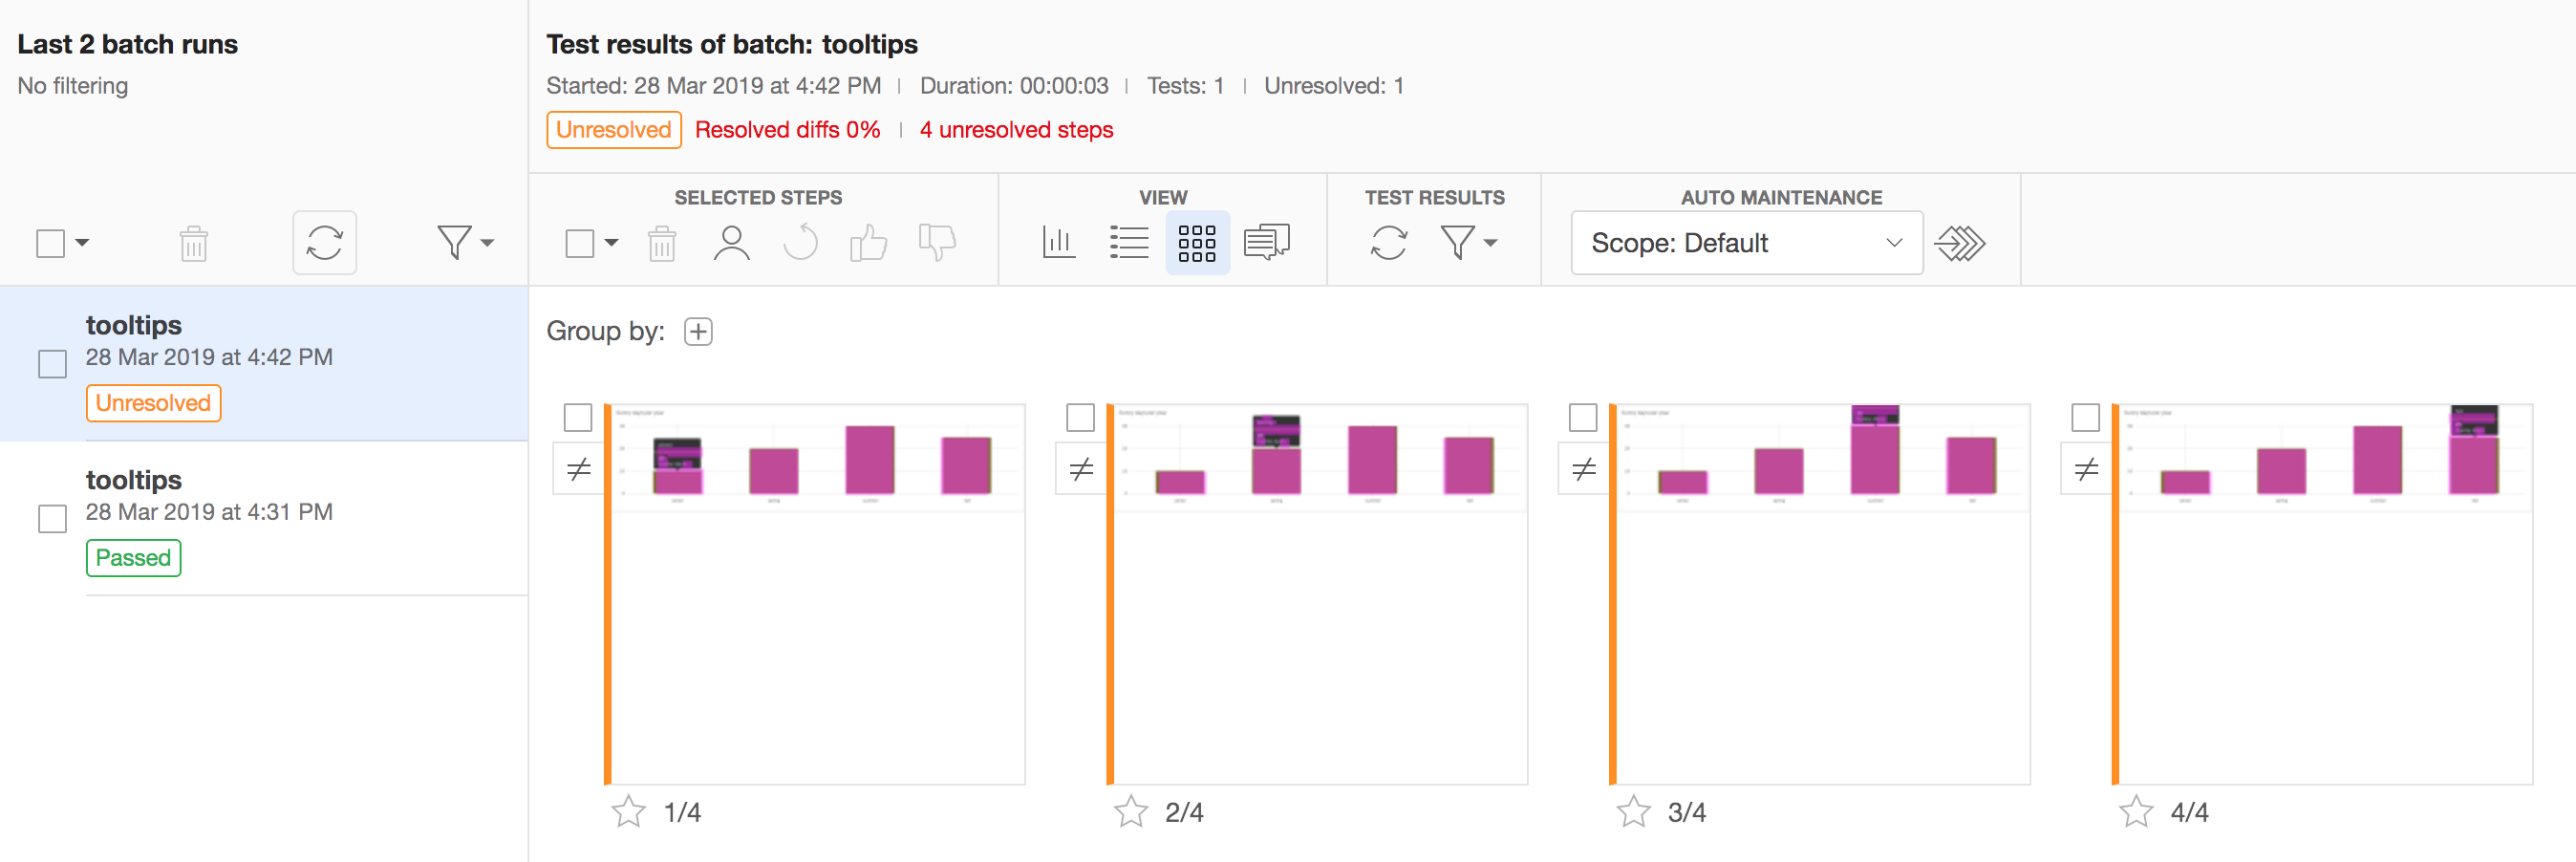
We can go into each image to see the difference with the saved baseline image. For example we can toggle (T) between the new image and the baseline.
We can even highlight the changed areas (although it is pretty clear in this case where the changes are)

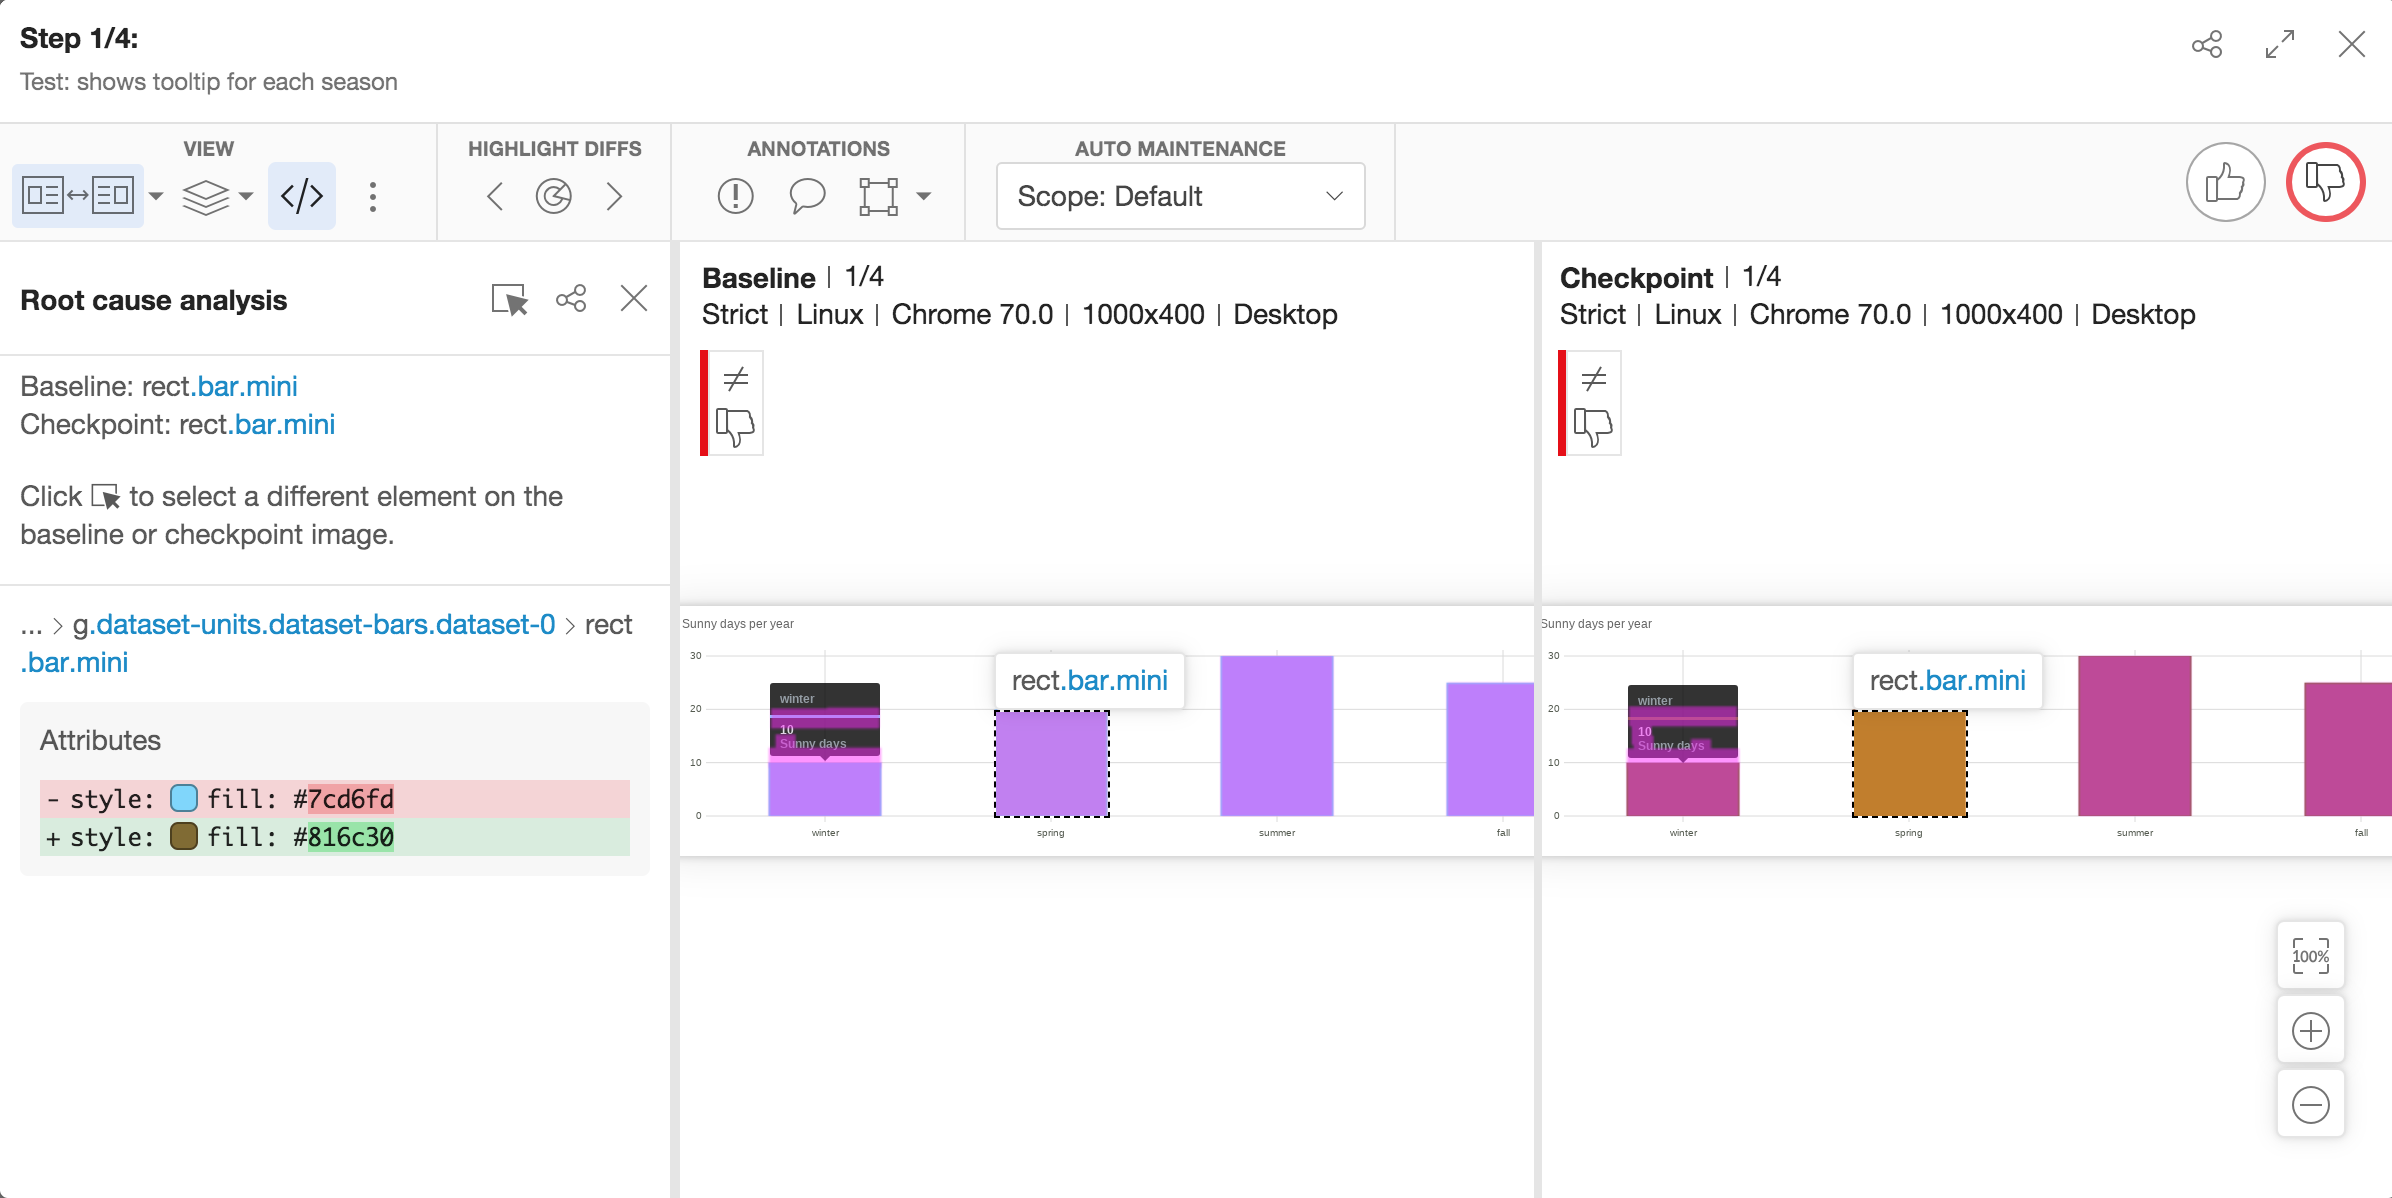
There is one more interesting feature the Applitools analysis offers. I can click on the "<>" button which opens a root cause analysis view. In this view, if I show the "diff" of the images, it also shows WHY the images have changed. In our case it correctly shows the root of the problem: the change "style: fill" property!
I don't like the new color, so I will revert the commit and push again.
Conclusions
- testing an SVG chart is pretty close to testing a regular DOM using Cypress
- for visual regressions, consider using an image diffing tool. There are several choices, both commercial and open source
Note: you can find the source code for this blog post at github.com/bahmutov/chart-testing-example.