Chrome DevTools code snippets became my favorite tool when investigating performance bottlenecks in web applications. A JavaScript fragment can be stored as a named snippet in the "Sources" DevTools panel and executed in the current page's context, just as if it were a code executed in the browser's console.
To create a new code snippet, open the Chrome DevTools, select the "Sources" panel, and then the "Snippets" tab on the left. It is next to the page's own scripts and loaded extensions' tabs. Right click anywhere in the snippets' list and select "New" option.
To quickly execute a code snippet, press CMD+Enter or right click and select "Run" option.
Simple examples
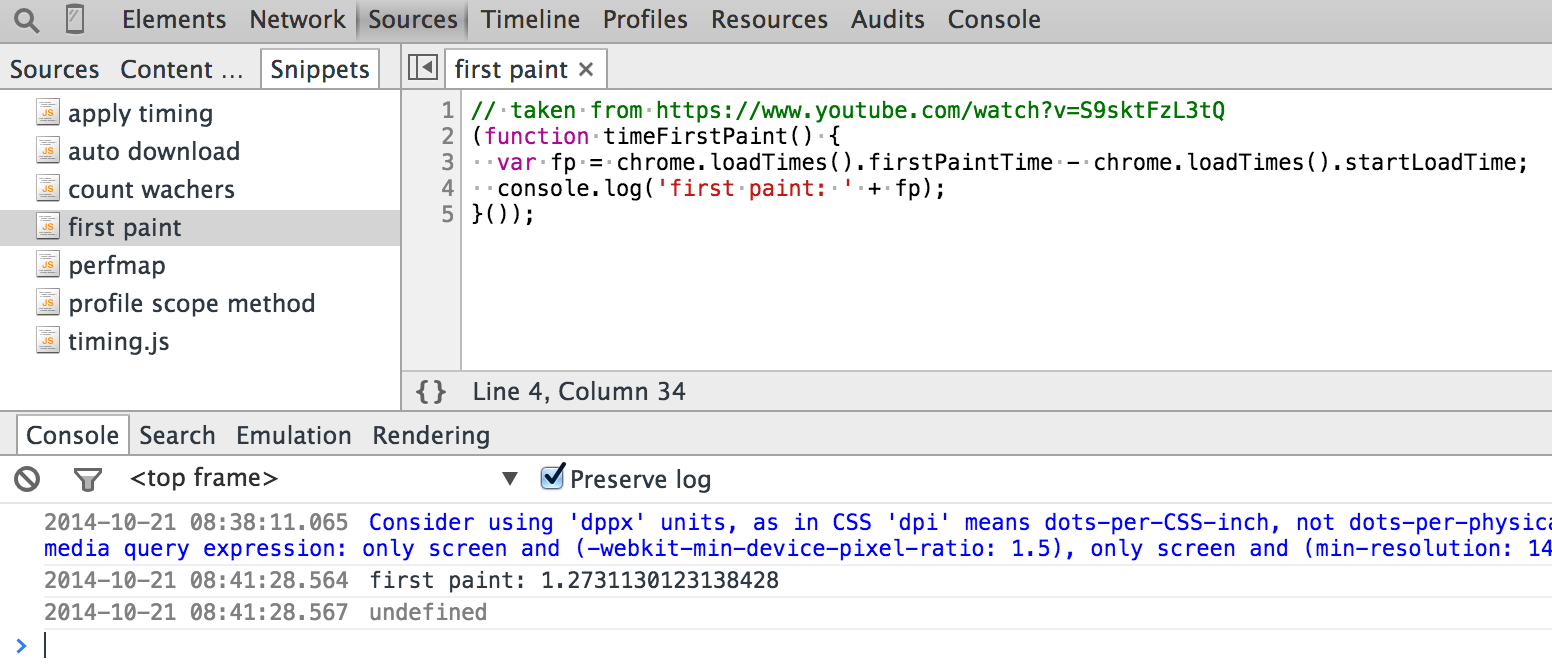
A simple code snippet could show time to first paint event using the browser's performance structure. This example is taken from the excellent Wait, Chrome DevTools can do that? video.
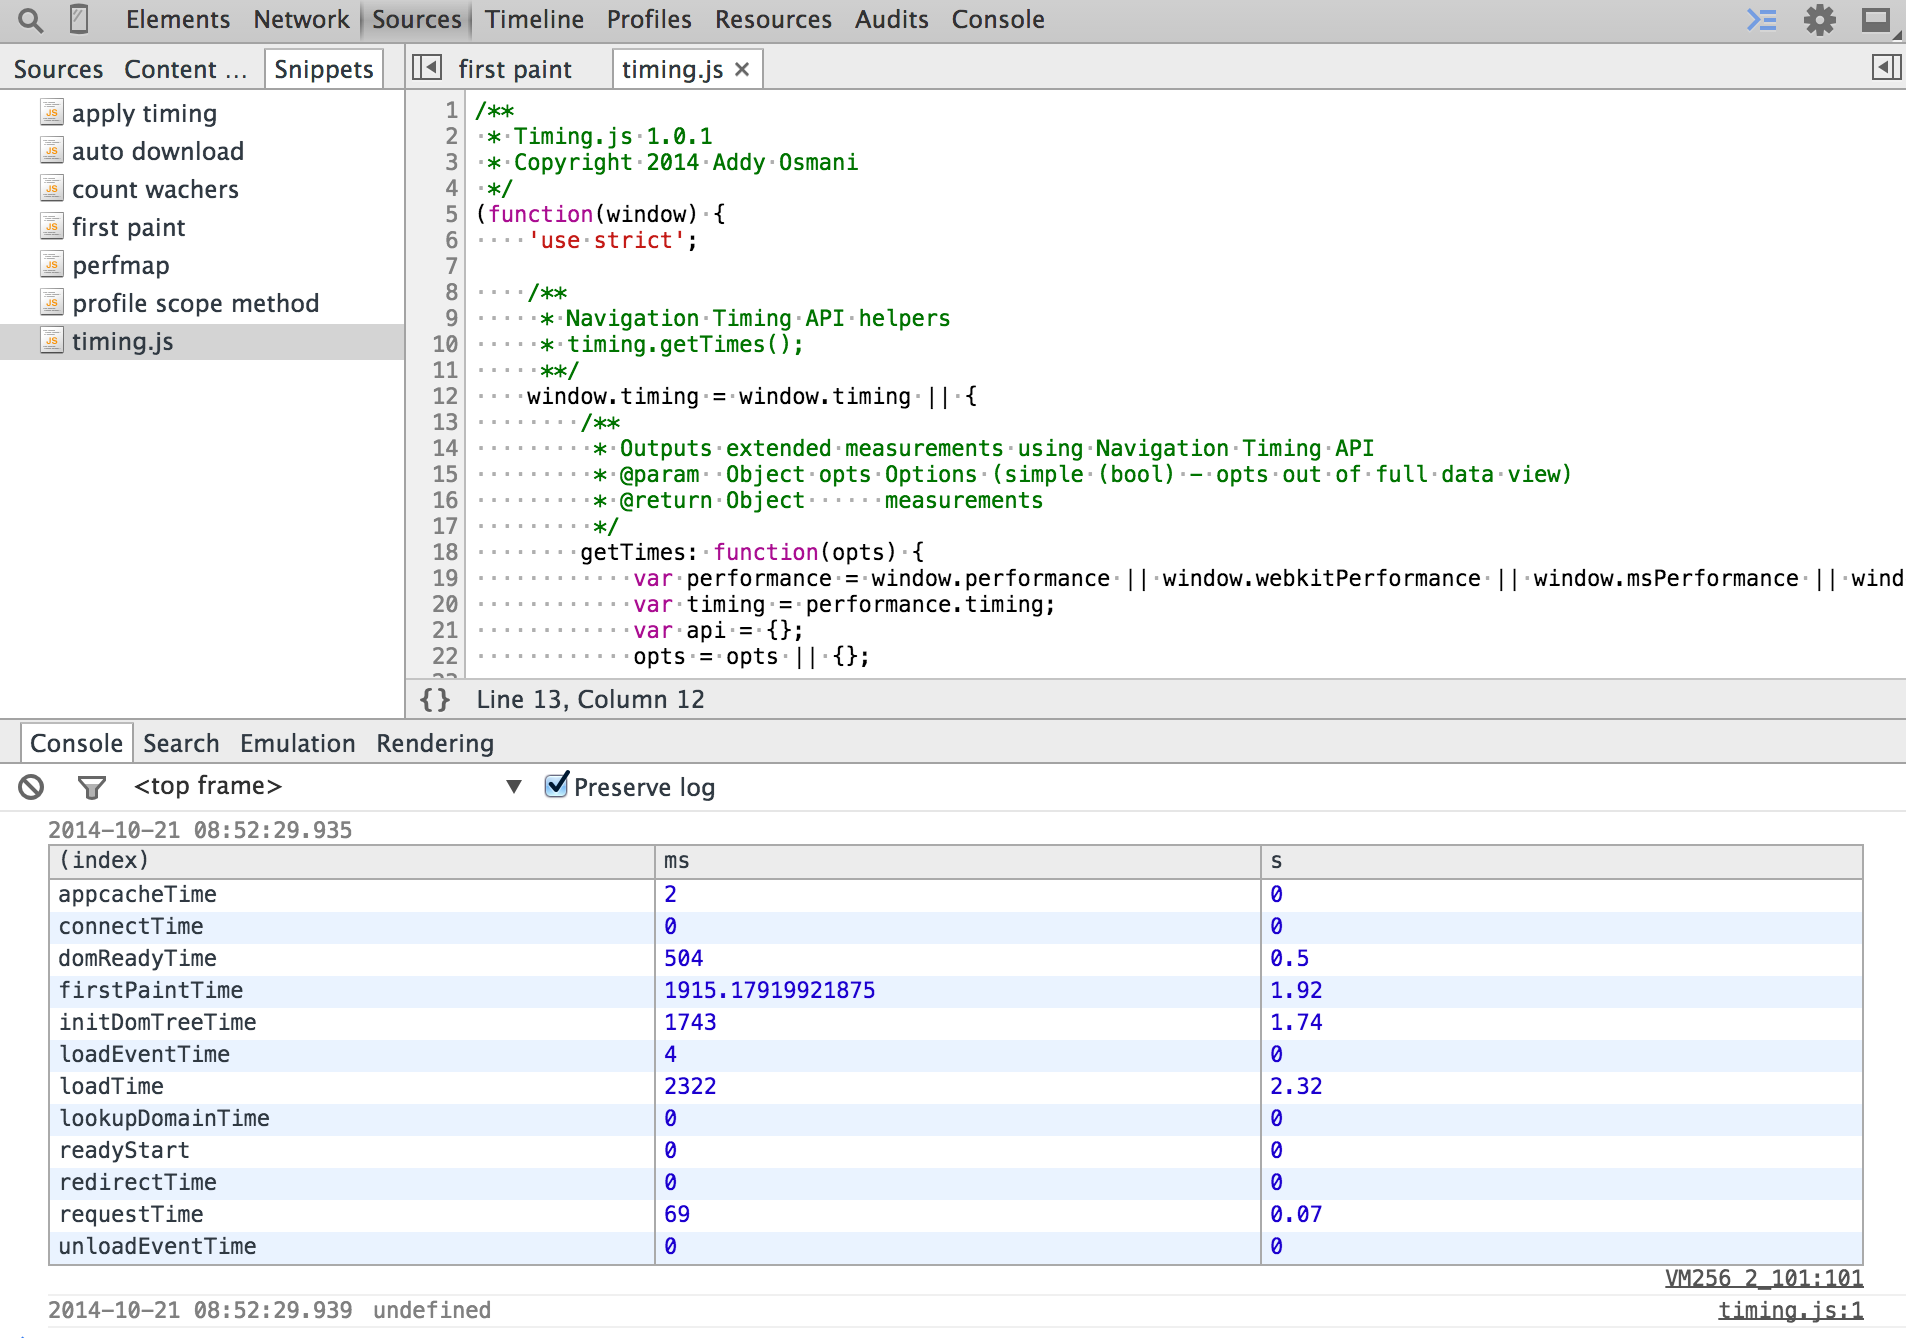
Building up on the previous example, one can get all the page's time information by creating a code snippet that contains addyosmani/timing.js. Running this snippet gives lots of interesting numbers for the current page.
Main Code Snippets features
The above two examples give a taste of the code snippets. Their important traits are:
- You can set breakpoints and debug the snippet's code just like a regular JavaScript source file.
- You are targeting the latest Chrome browser only, thus the cross-browser compatibility and the obsolete browser support are not a problem.
- Any library already included on the page or a global variable can be used from the snippet.
- Remember to wrap the code snippet in a closure to prevent leaking variables into the global namespace.
- The returned value from the code snippet is printed by the console, thus it prints
undefinedin the examples above. - You cannot pass any arguments to a code snippet, thus you need to modify the snippet itself.
- The code snippets are a lot more user and developer friendly than the bookmarklets - the code is clearly visible and can be modified and saved at will.
- One can even include an entire library in a code snippet, or download new scripts dynamically, see remote download section.
I have already shown two useful code snippets that report the timing information for the current page. There are lots of useful general snippets one can apply as performance tools. I will show several performance CPU profiling and space measurement snippets.
Profiling live applications
Compared to the synthetic benchmarks, code snippets allow us to profile a specific feature in a deployed web application. For example let us find first N prime numbers when a user clicks a button.
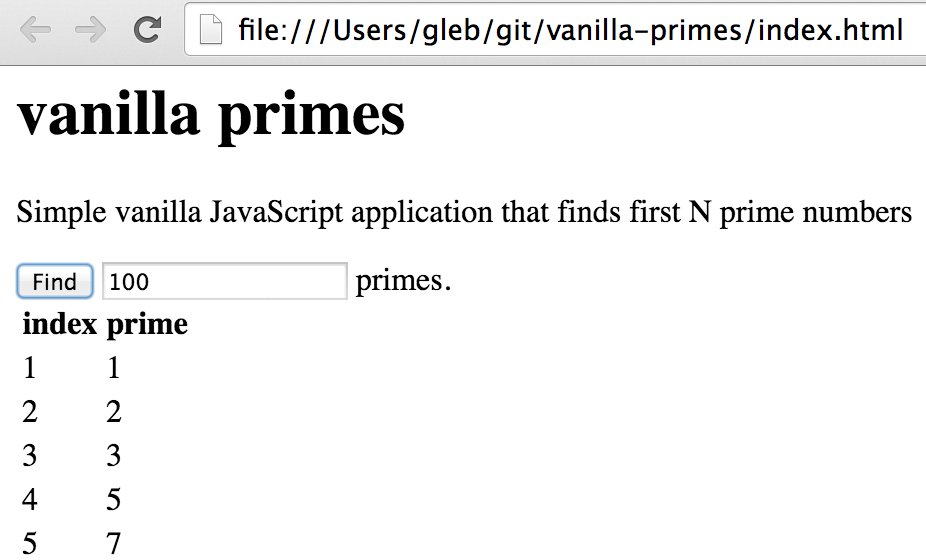
In a typical use case scenario showing, the application performs fine when N is small. Then the users who enter the larger values of N start complaining that the application takes too long to compute the result. To resolve the complains, we will analyze the application performance using the code snippets.
We can inspect the application's source to find that the application executes a callback on the button click event.
1 | var primesApp = { |
We can start the performance improvement process by first measuring how long the method primesApp.findFirstPrimes
takes for different values of N. It is a method of the object primesApp and thus can be easily wrapped from the outside.
To show how long this method runs, I am using console.time and console.timeEnd calls from the
Chrome console api. The code below is in the
time-method-call.js code snippet.
1 | // create new code snippet time-method-call.js |
We can run this code snippet multiple times to discover by how much the find method slows down for larger values of N
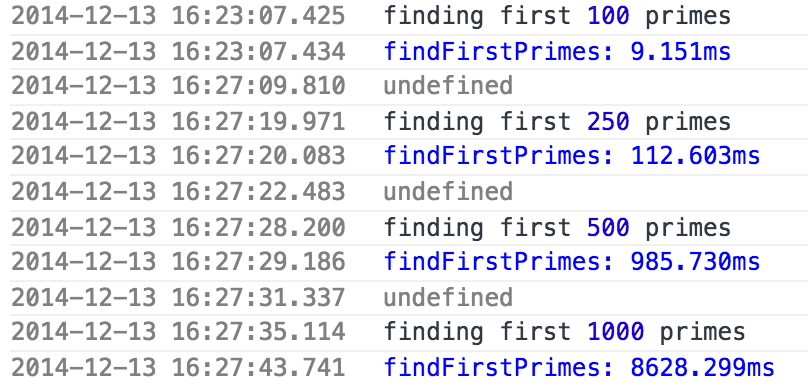
We now see that the method's performance clearly deteriorates for larger values of N.
But which part of our code is the actual bottleneck? Let us get this information by
using the profile-method-call.js snippet.
This snippet uses profile(); ... profileEnd(); instead of time(); ... timeEnd(); to wrap the desired method.
This creates the detailed CPU profile, shown below as a chart. The CPU profile collected by the snippet
is a lot more precise than starting and stopping the profiler manually, especially for short method calls.
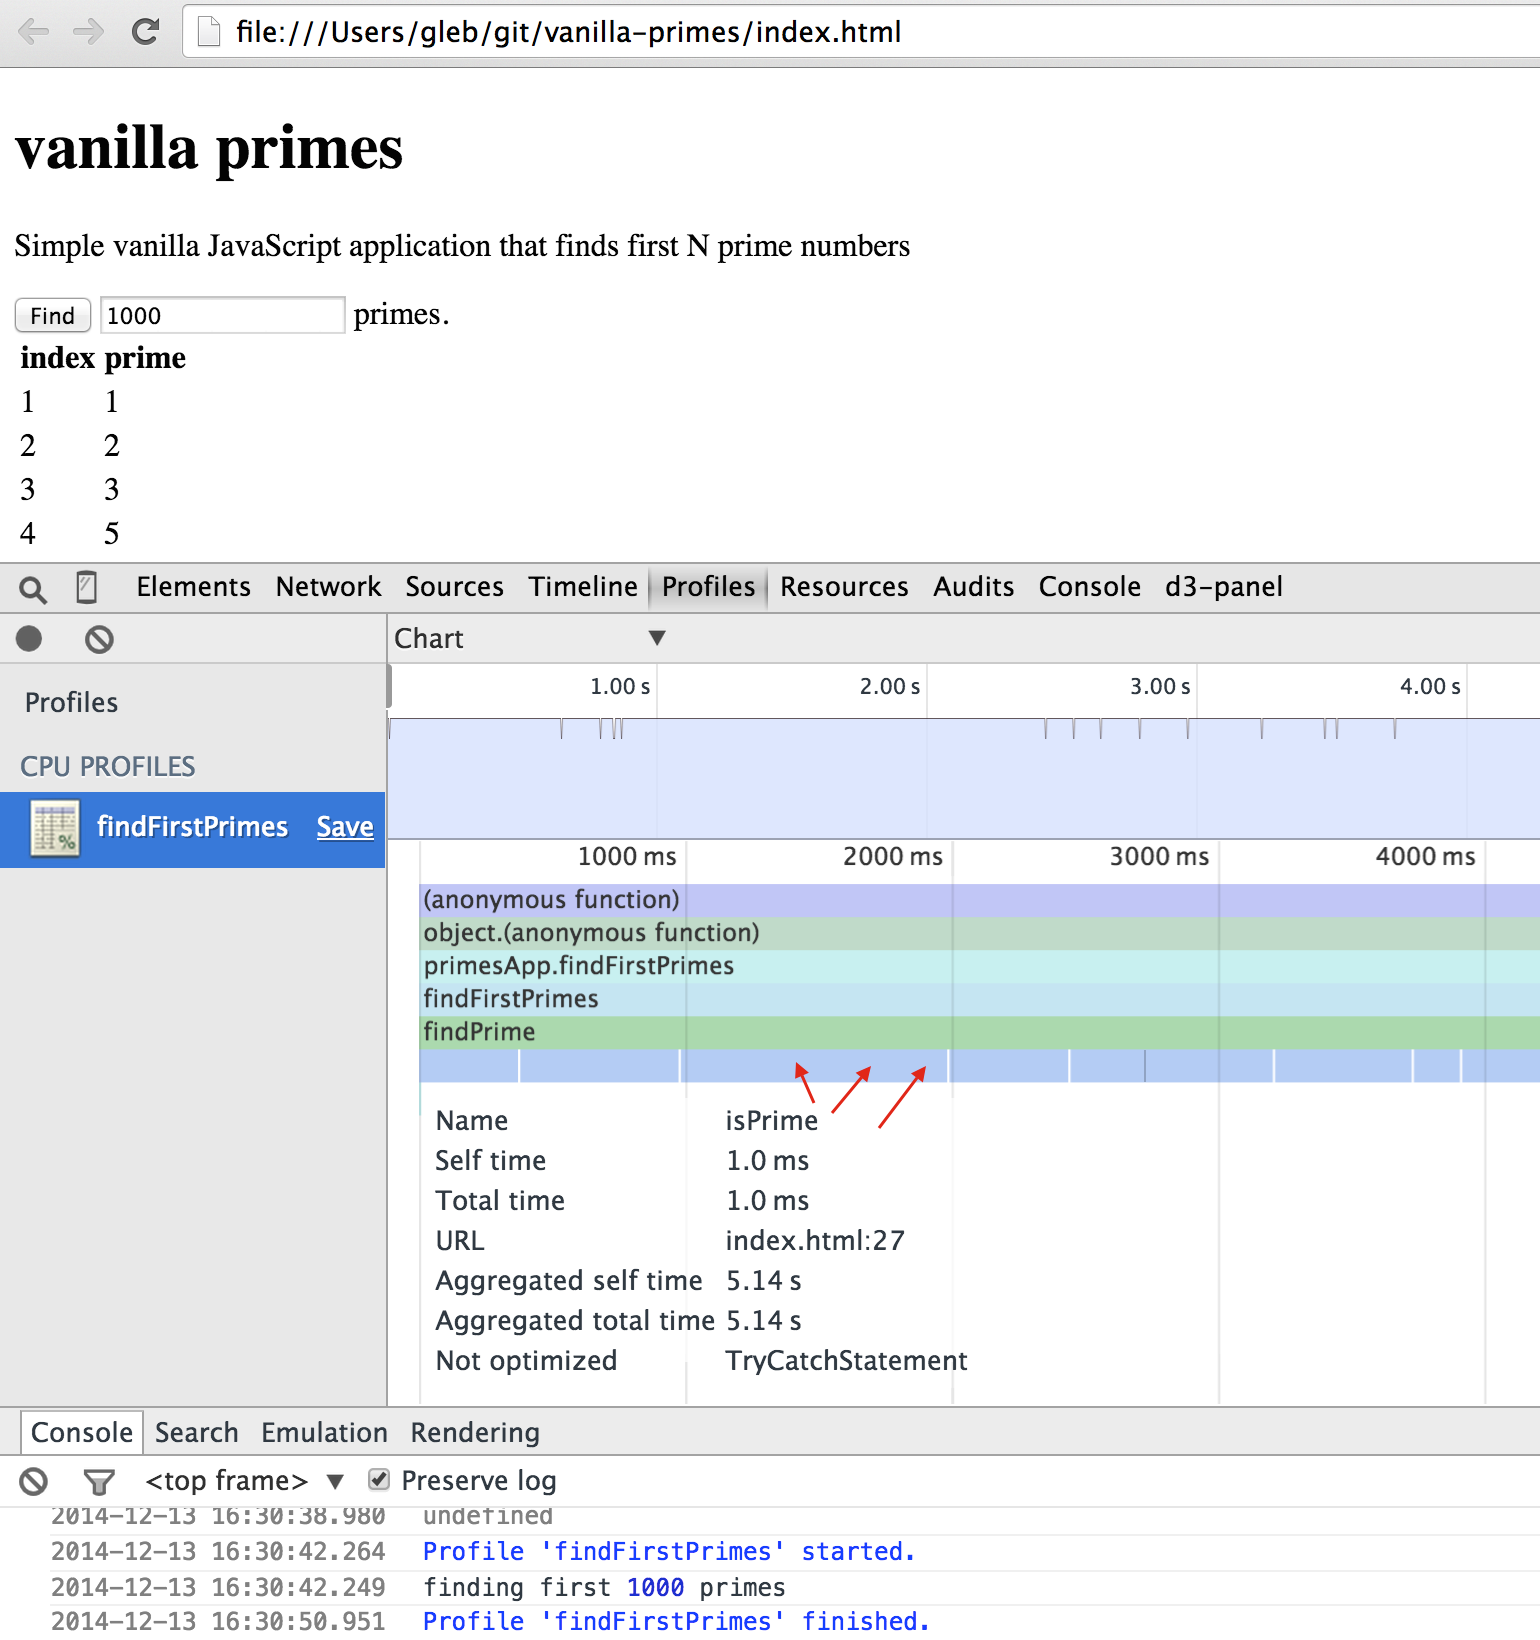
The bottom row of the chart shows the individual calls to the isPrime function.
The individual calls are too small to see, but there are thousands of them.
We can get a better picture by switching to the Heavy (Bottom Up) view:
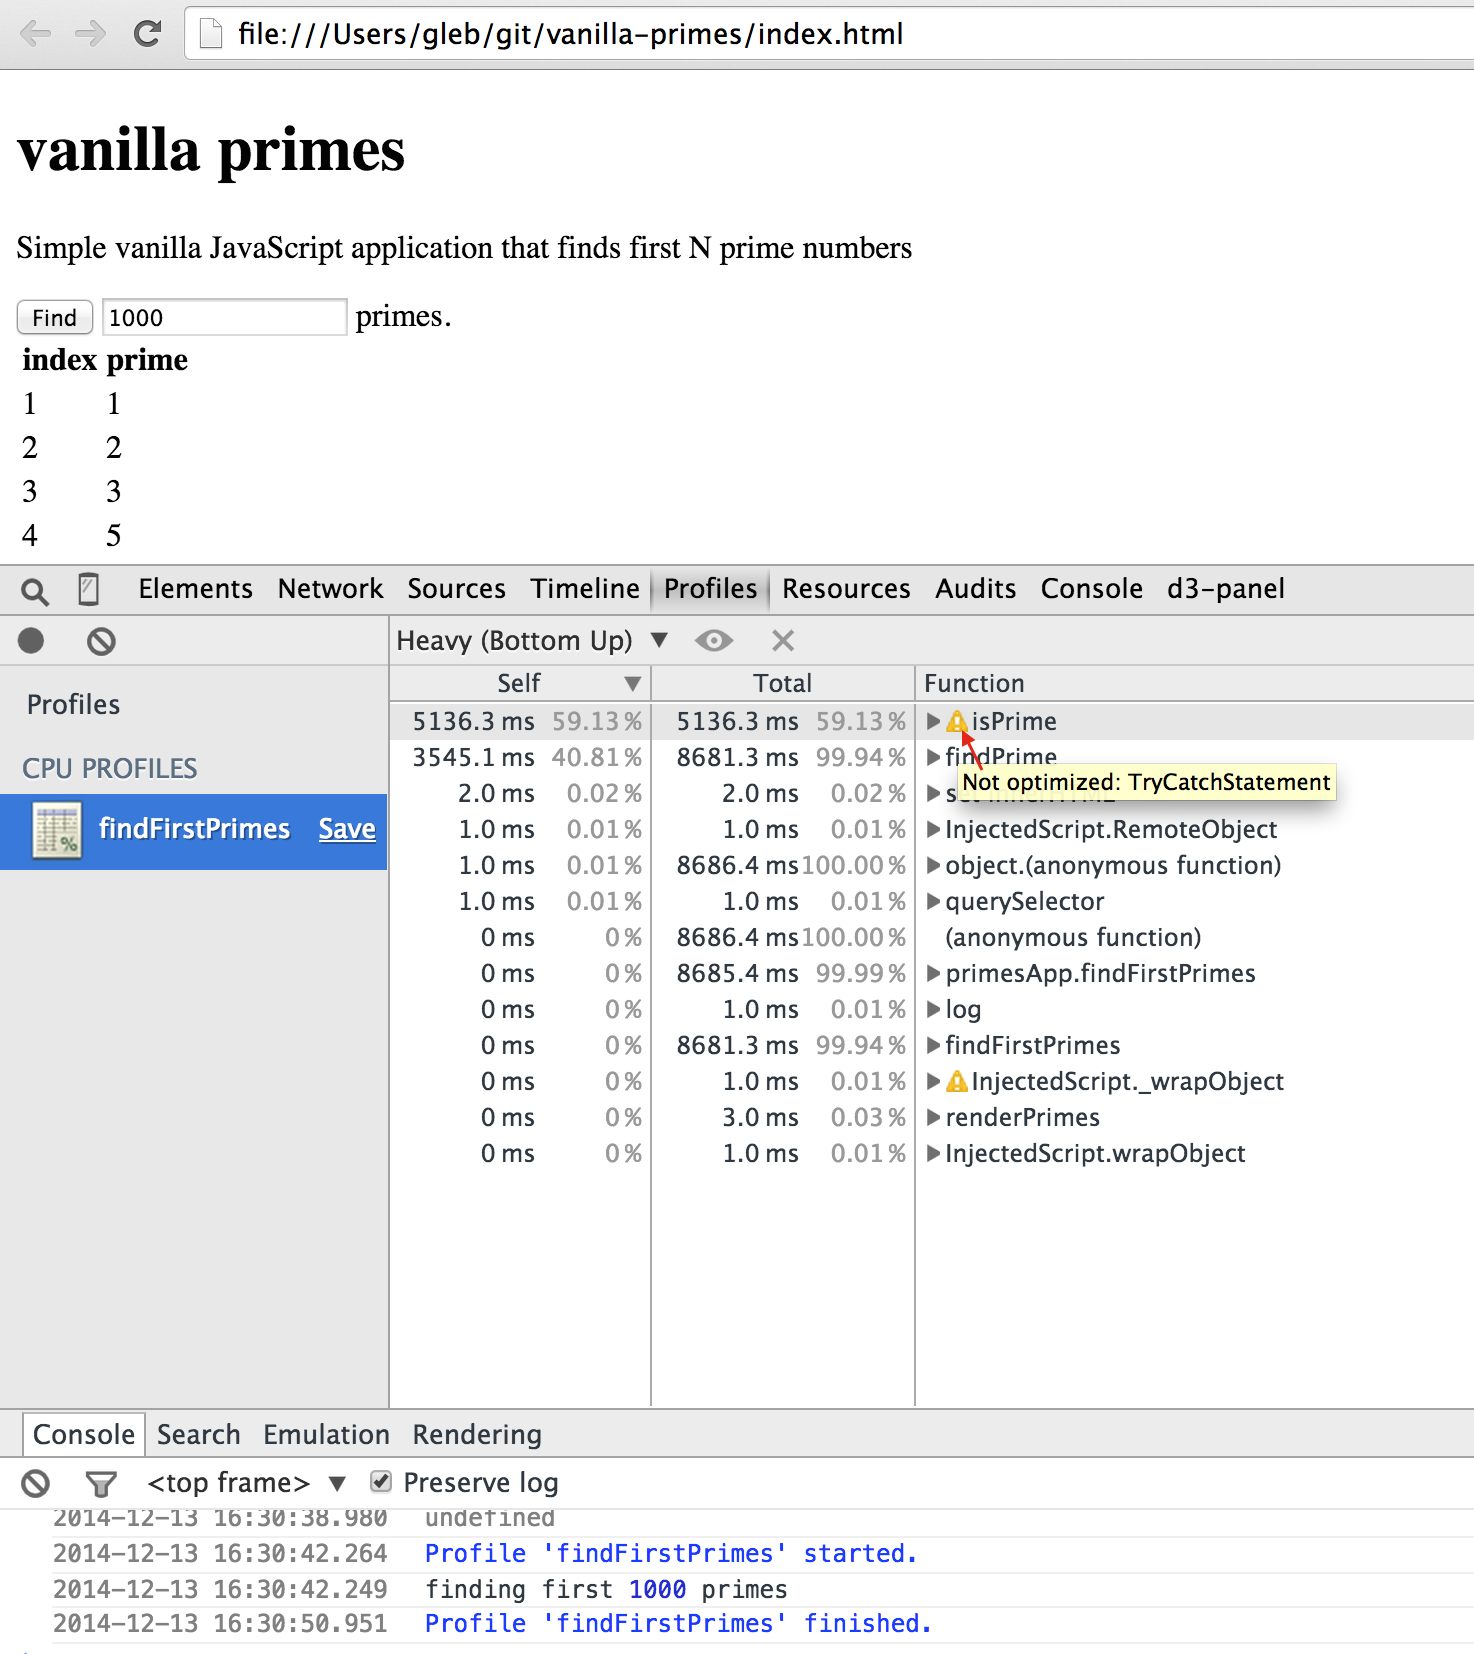
Not only we see that the function isPrime takes the majority of the execution time,
Chrome v8 JavaScript engine also warns us that it cannot optimize this function because it contains the try - catch block.
1 | function isPrime(n) { |
In this case the try - catch statement is completely unnecessary.
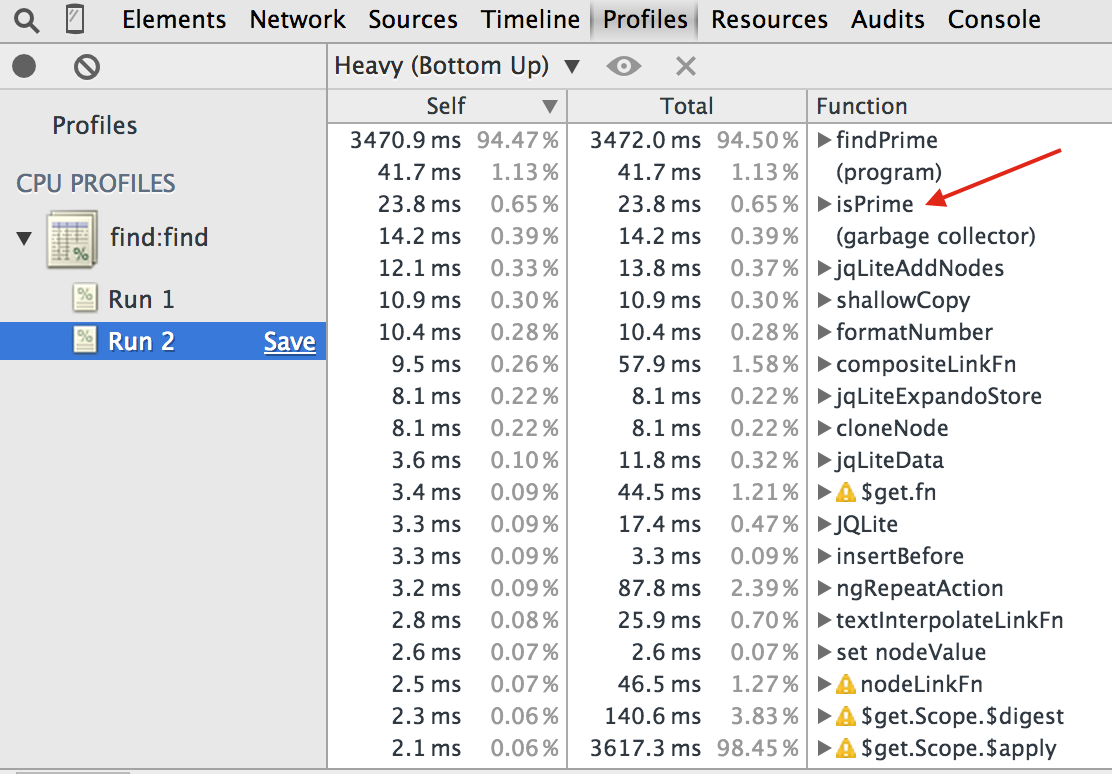
Let us remove it and profile the application again. The time to find the first 1000 primes drops from 8 to 3 seconds.
The bottleneck in isPrime has been completely removed - it now takes just a few milliseconds.
The difference between the original unoptimized JavaScript and optimized can be extreme. Using these code snippets against the live application and executing the same use case scenario as the actual user, we can continue profiling the application and removing bottlenecks one by one until we are happy with the overall performance.
Space storage measurements
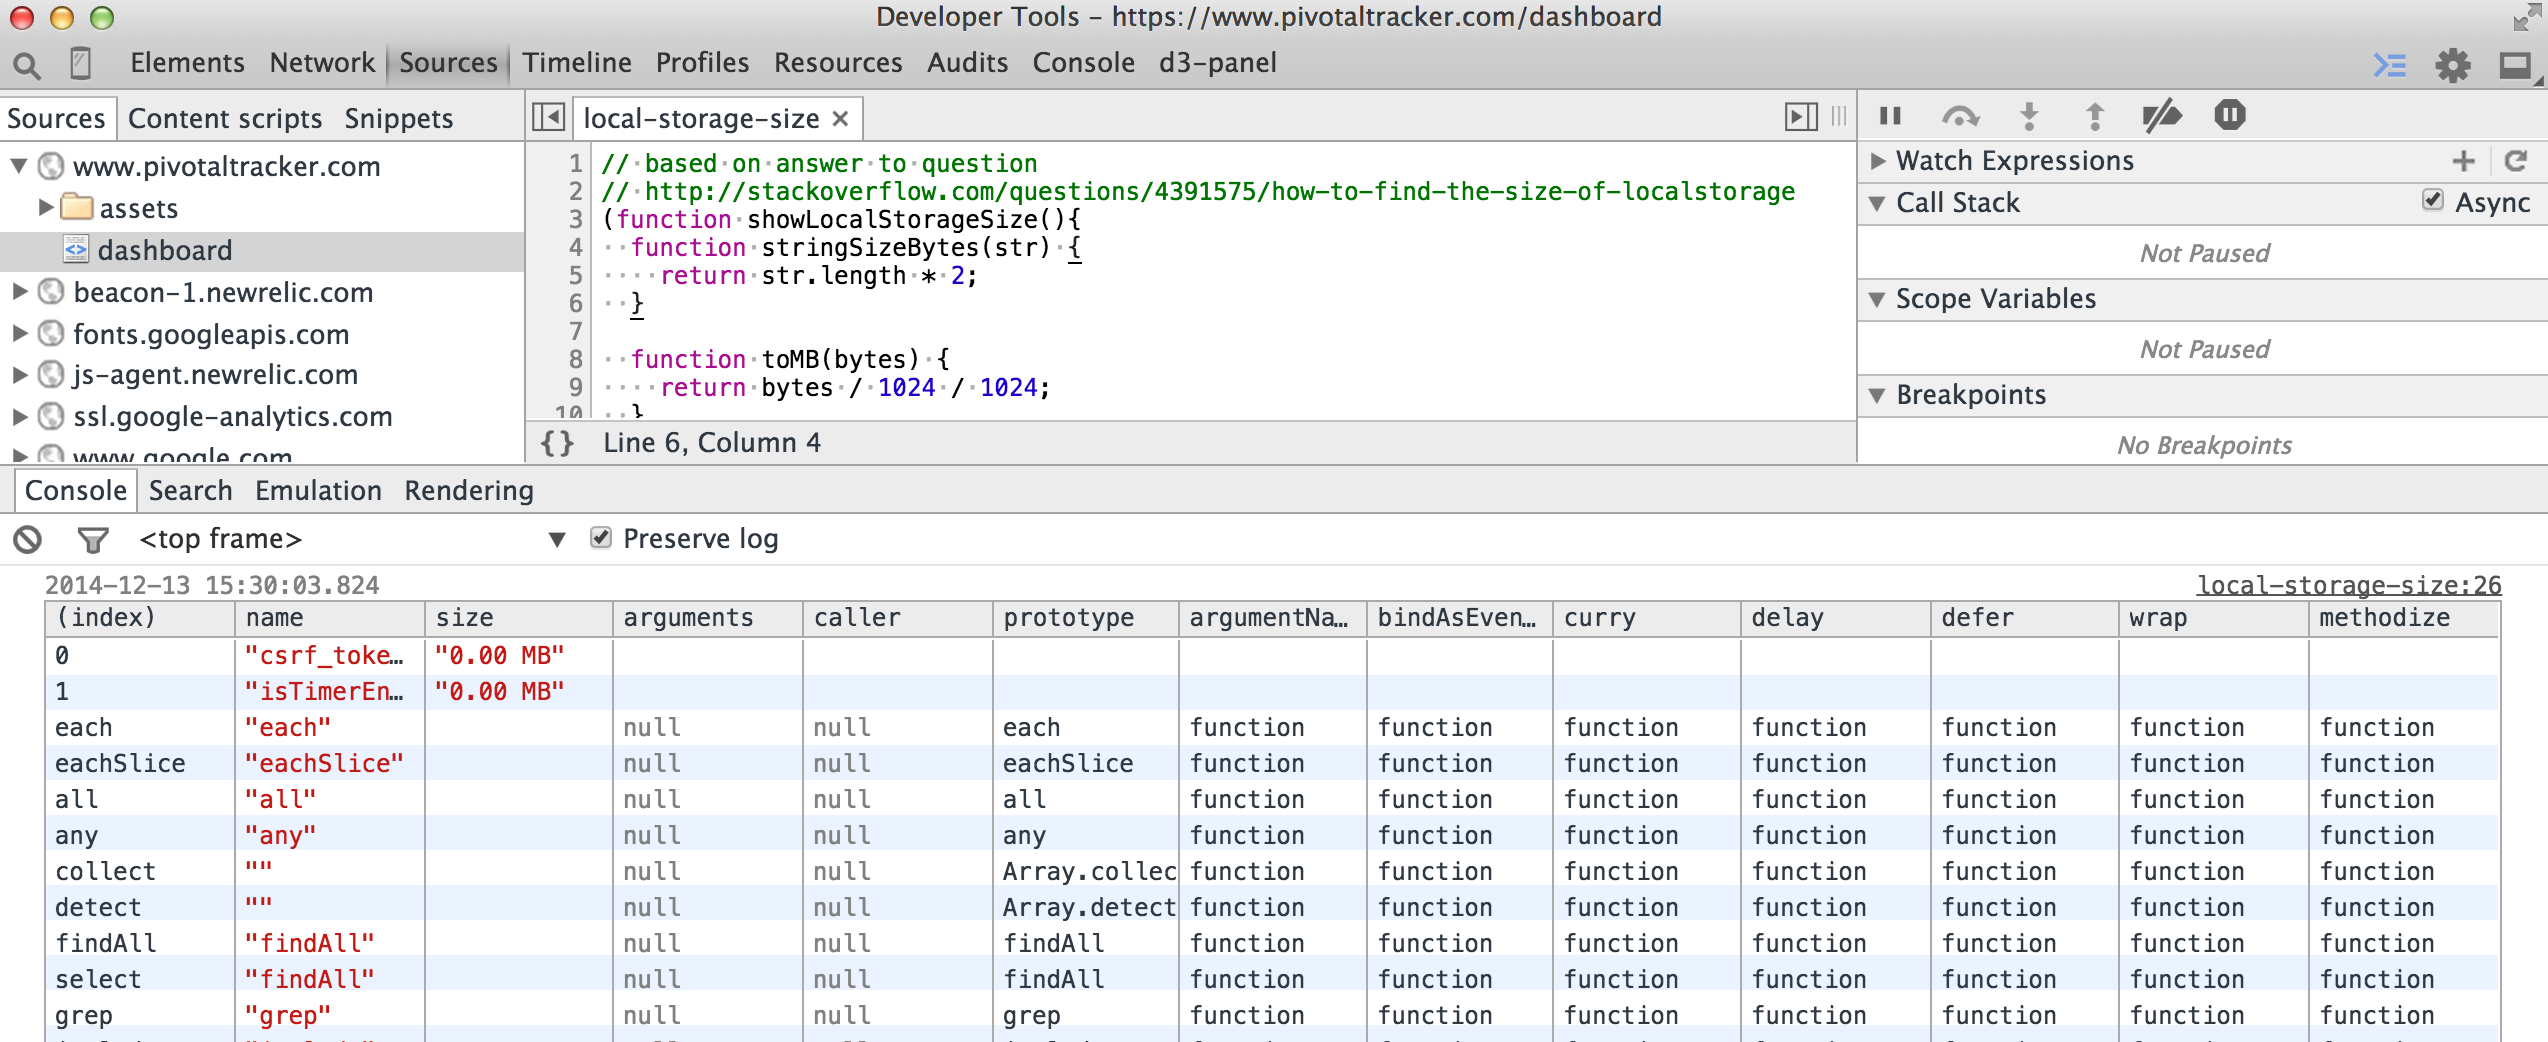
The application's performance depends often on the amount of storage and memory used. For example, if loading previously saved data from the local storage becomes slow over time, we can quickly measure the amount of data stored using local-storage-size.js
1 | // based on the answer to the question |
Running this script shows the entries with large space requirements, and sometimes shows additional interesting facts. For example the pivotaltracker.com dashboard stores its JavaScript functions in the local storage to speed up the startup.
There are other scripts that can help analyze storage requirements in a live web application:
- expensive-keys.js - measures how much space individual keys and their values take up in a collection of objects, read Measuring Space Allocation for more details.
- keys-vs-values.js - measures length of keys vs length of values in an array.
Conclusions
Code snippets are powerful and useful tools for profiling live applications. They are external to the application's code and the development workflow, yet execute in the context of the application without any restrictions. They can time, profile and measure almost anything in the application. The only limitations are constraints of the JavaScript language itself and your imagination.
Additional information:
- This blog post has been featured in the Perf Planet calendar.
- My collection of code snippets, including the examples above bahmutov/code-snippets.
- Chrome DevTools Snippets - my earlier intro to the code snippets, including the auto-download feature.
- Intro to DevTools snippets - a blog post by Brian Grinstead.
- Improving Angular web app performance - very large example with lots of AngularJs-specific techniques. Most of the steps include using code snippets to find bottlenecks.