TL;DR AngularJS performance lessons.
Once your Angular application has the features you need, the next step is usually focused on improving its performance. Initial load time, responsiveness to user's commands - the application has to execute quickly in order to be useful. There are general guides to improve an angular application's speed by order of 2 magnitudes. For example Scalyr blog post suggests the following:
- Cache DOM elements
- Use fewer watchers
- Defer element creation
- Skip watchers for hidden elements
I find these suggestions valid, but too difficult to implement right away. Instead I suggest the following steps to optimize Angular web app's performance.
- Profile individual actions
- Optimize obvious JavaScript (non-Angular code) bottlenecks
- Measure and optimize the idle digest cycle
- Simplify watched expressions by removing filters
- Remove unnecessary watchers by replacing two- with one-way data binding
- Analyze the model update / DOM repaint cycle to identify bottlenecks
- Large work can be split into batches
- Some work can be potentially moved to the web workers
- Minimize garbage collection events
- Reuse memory instead of continuously allocating new space.
This step by step example shows practical scripts to run when you need to speed up an Angular application. The scripts will be run repeatedly to diagnose bottlenecks, so it is helpful to add them to Chrome DevTools as code snippets. I described how to use code snippets in several blog posts 1, 2. The scripts used in this article can be found in bahmutov/code-snippets repo.
The example uses Angular 1.2, but the techniques for profiling the application and finding bottlenecks should be applicable to future versions too.
Example application
I wrote a small Angular application to be a runnable example. You can follow along by cloning bahmutov/primes and trying the application itself at different commits. The entire example is a single index.html file that can be loaded in Chrome without needing a webserver. The application computes and prints first N primes. We will start with a very inefficient implementation and will improve it in several steps.
git clone [email protected]:bahmutov/primes.git
cd primes
bower install angular-bindonce jquery angular-vs-repeat --force
git checkout step-0
open index.html
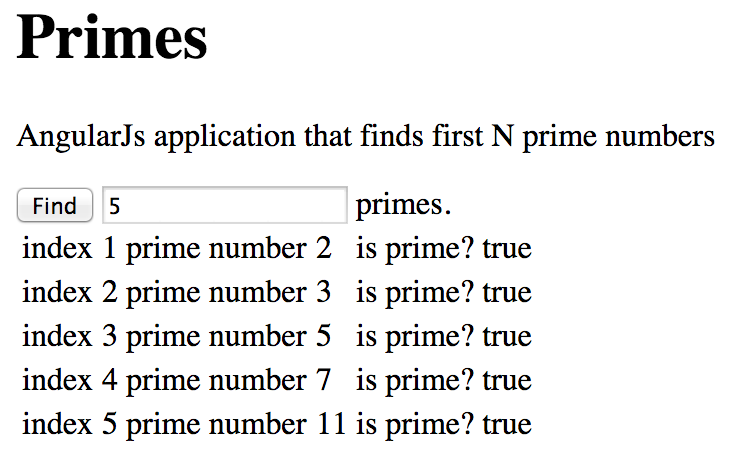
The page is very simple: user enters number of primes to find, then clicks "Find" button. The numbers are computed and displayed in the table.
1 | <div ng-controller="primesController" ng-cloak> |
The table has filters and sorting order just to show common performance problems. First 5 prime numbers look like this:
Initial performance
The first version (tag step-0) finds first 10 or even 100 primes very quickly. But when the user tries to find 1000 primes, there is an obvious pause while the browser is doing the computation. Why is it taking so long?
The angular application code is very simple
1 | function isPrime() { ... } |
$scope.find takes too long for larger values of $scope.n.
Usually we start by profiling JavaScript like this:
1 | $scope.find = function () { |
I prefer to use console.time call to profile - it needs fewer variables and provides sub-millisecond resolution.
1 | $scope.find = function () { |
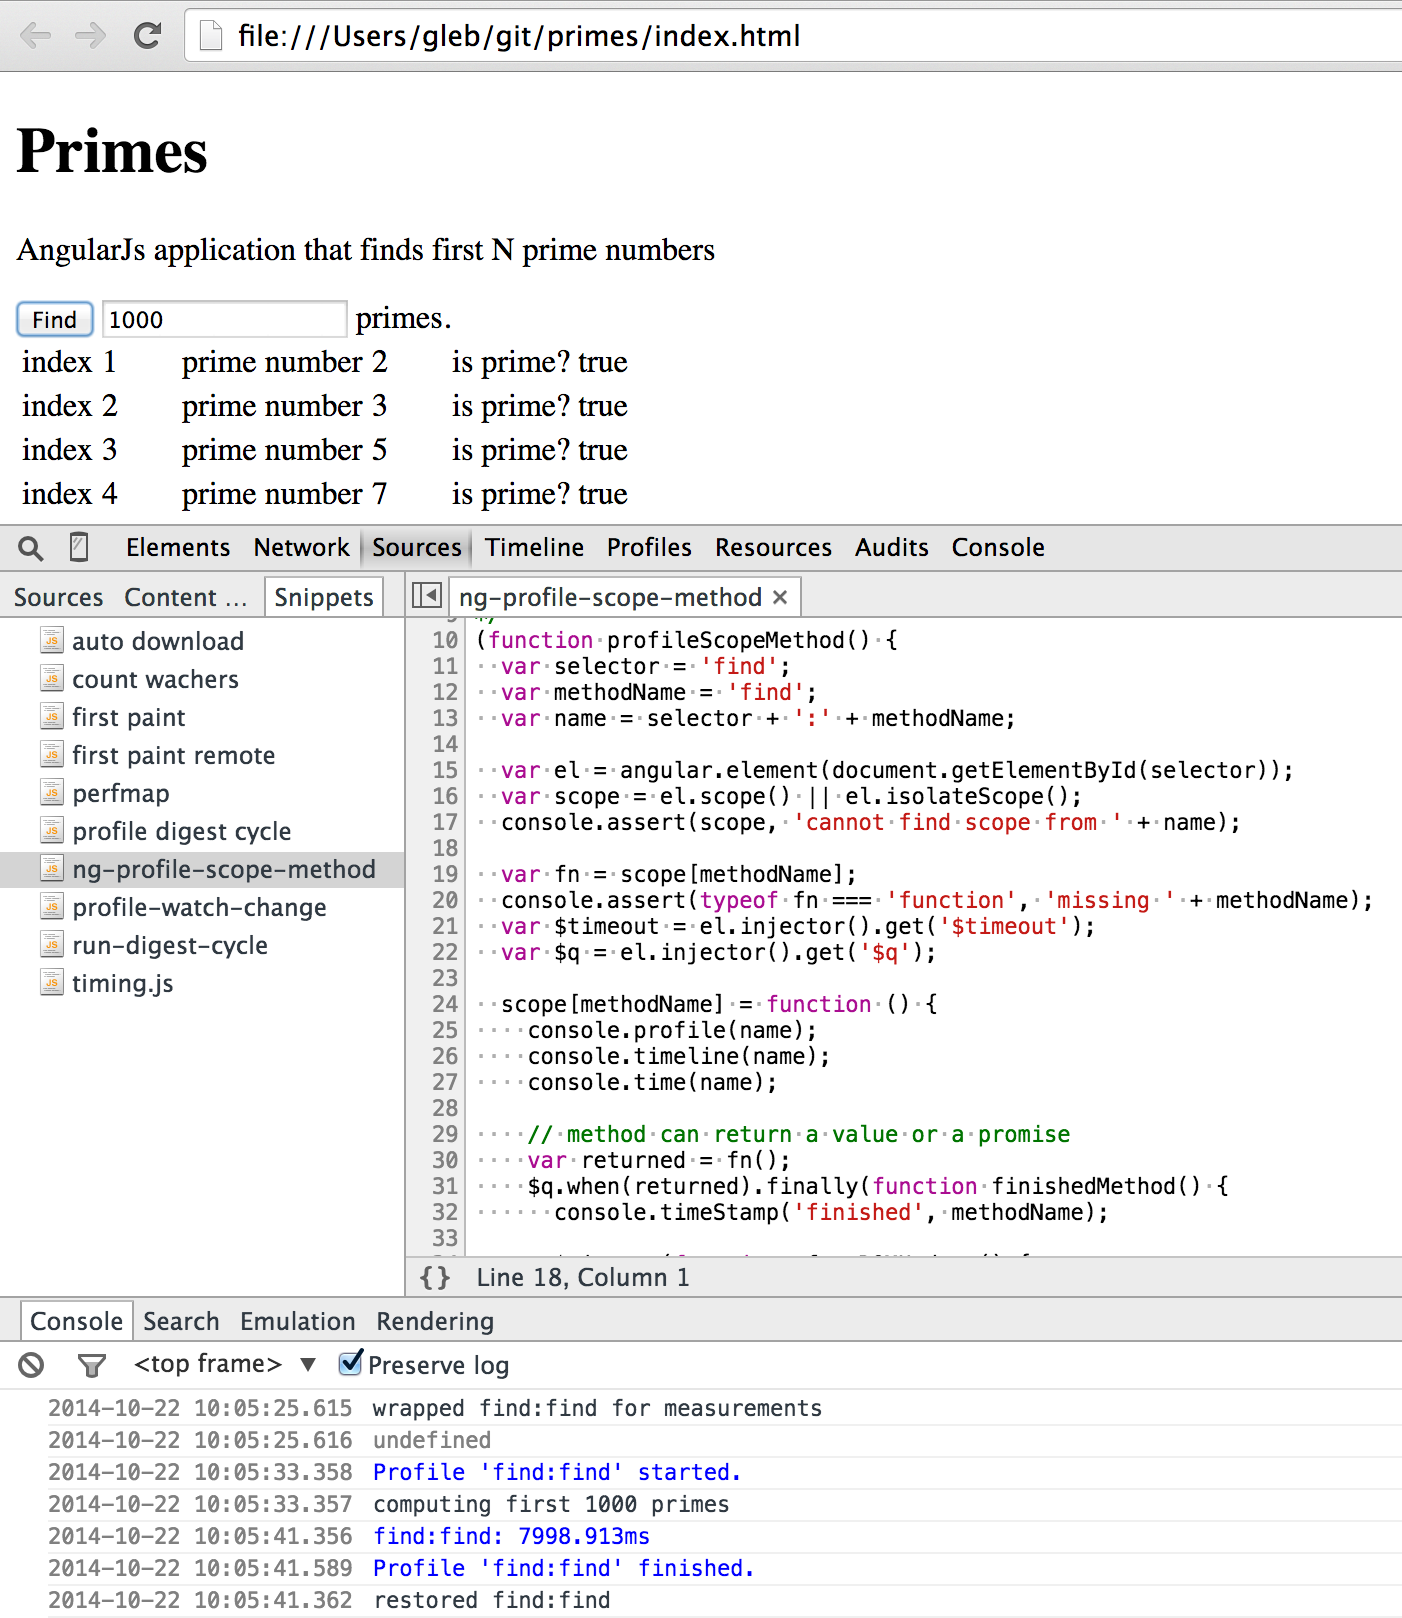
Computing first 1000 numbers takes almost 8 seconds!
Profiling using code snippet
Instead of modifying code and inserting time commands, I use my
ng-profile-scope-method
code snippet. I create new code snippet in DevTools, copy the source code and modify the selector
and scope method name to match my application (my button has id find and scope method is also find).
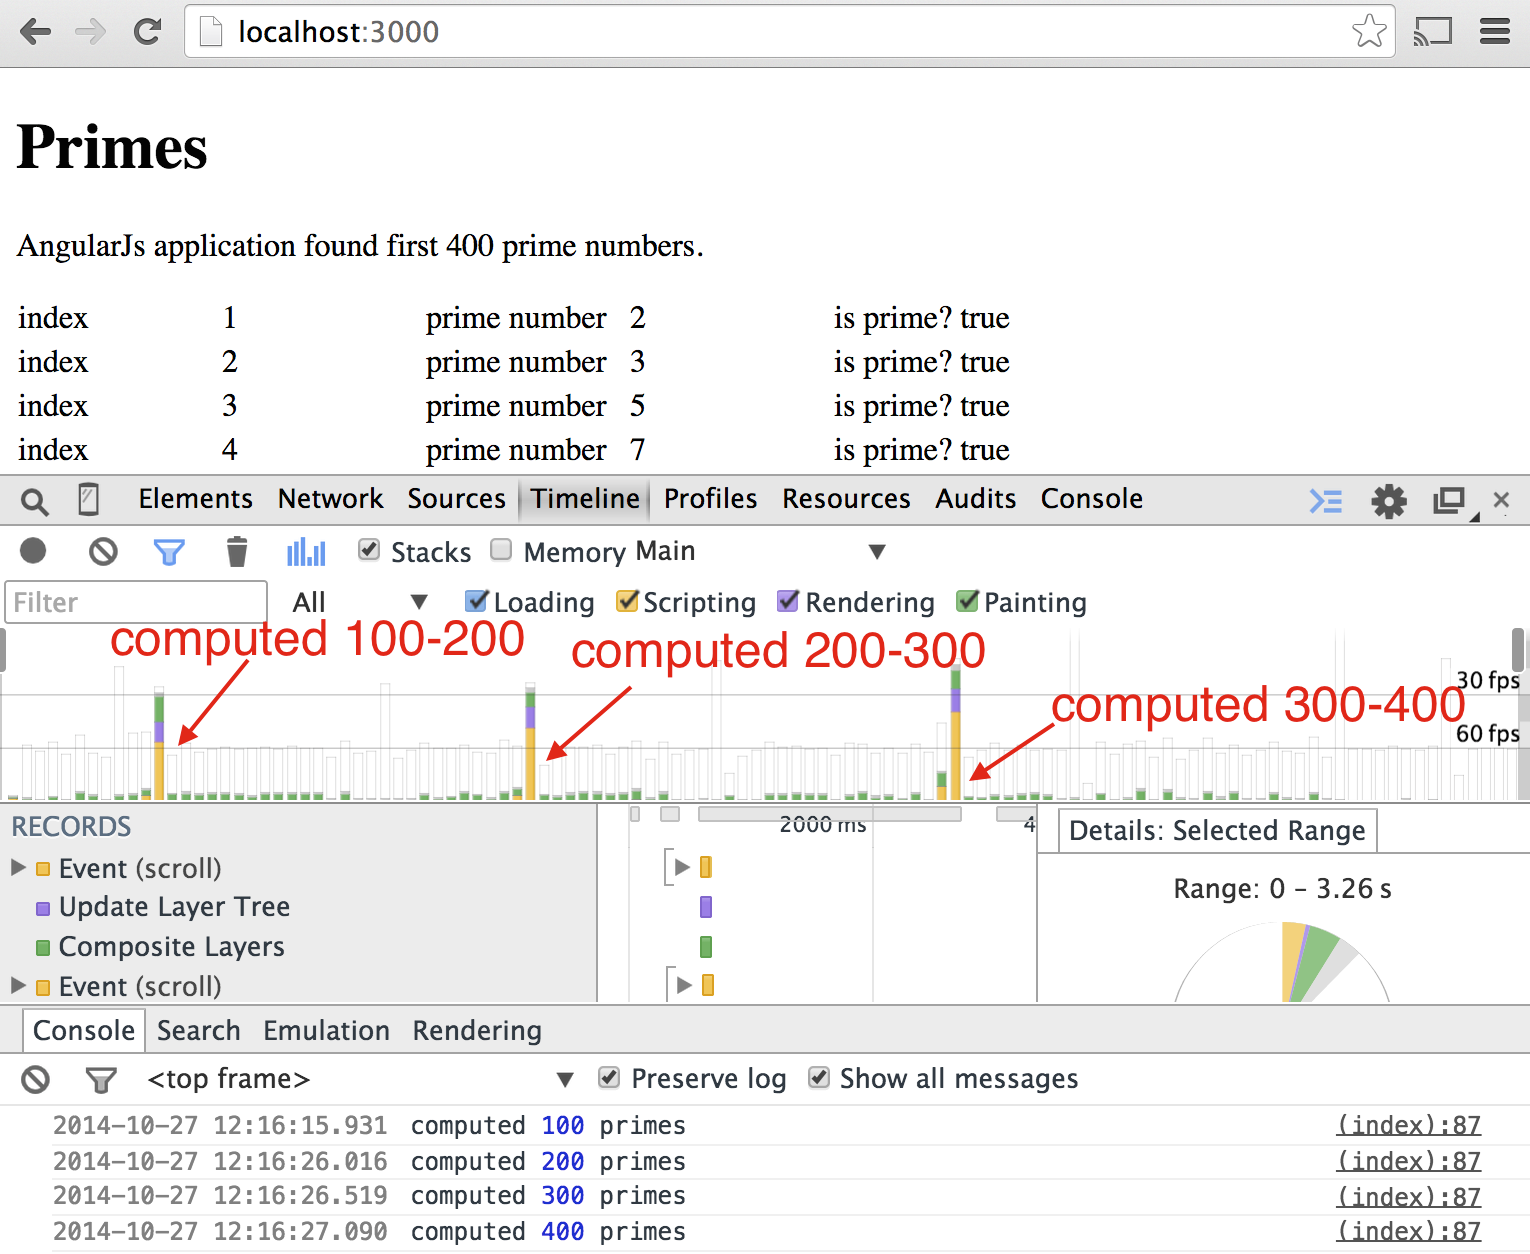
I first run the code snippet to instrument the method $scope.find. Then I click "find" button.
The browser console shows timing messages
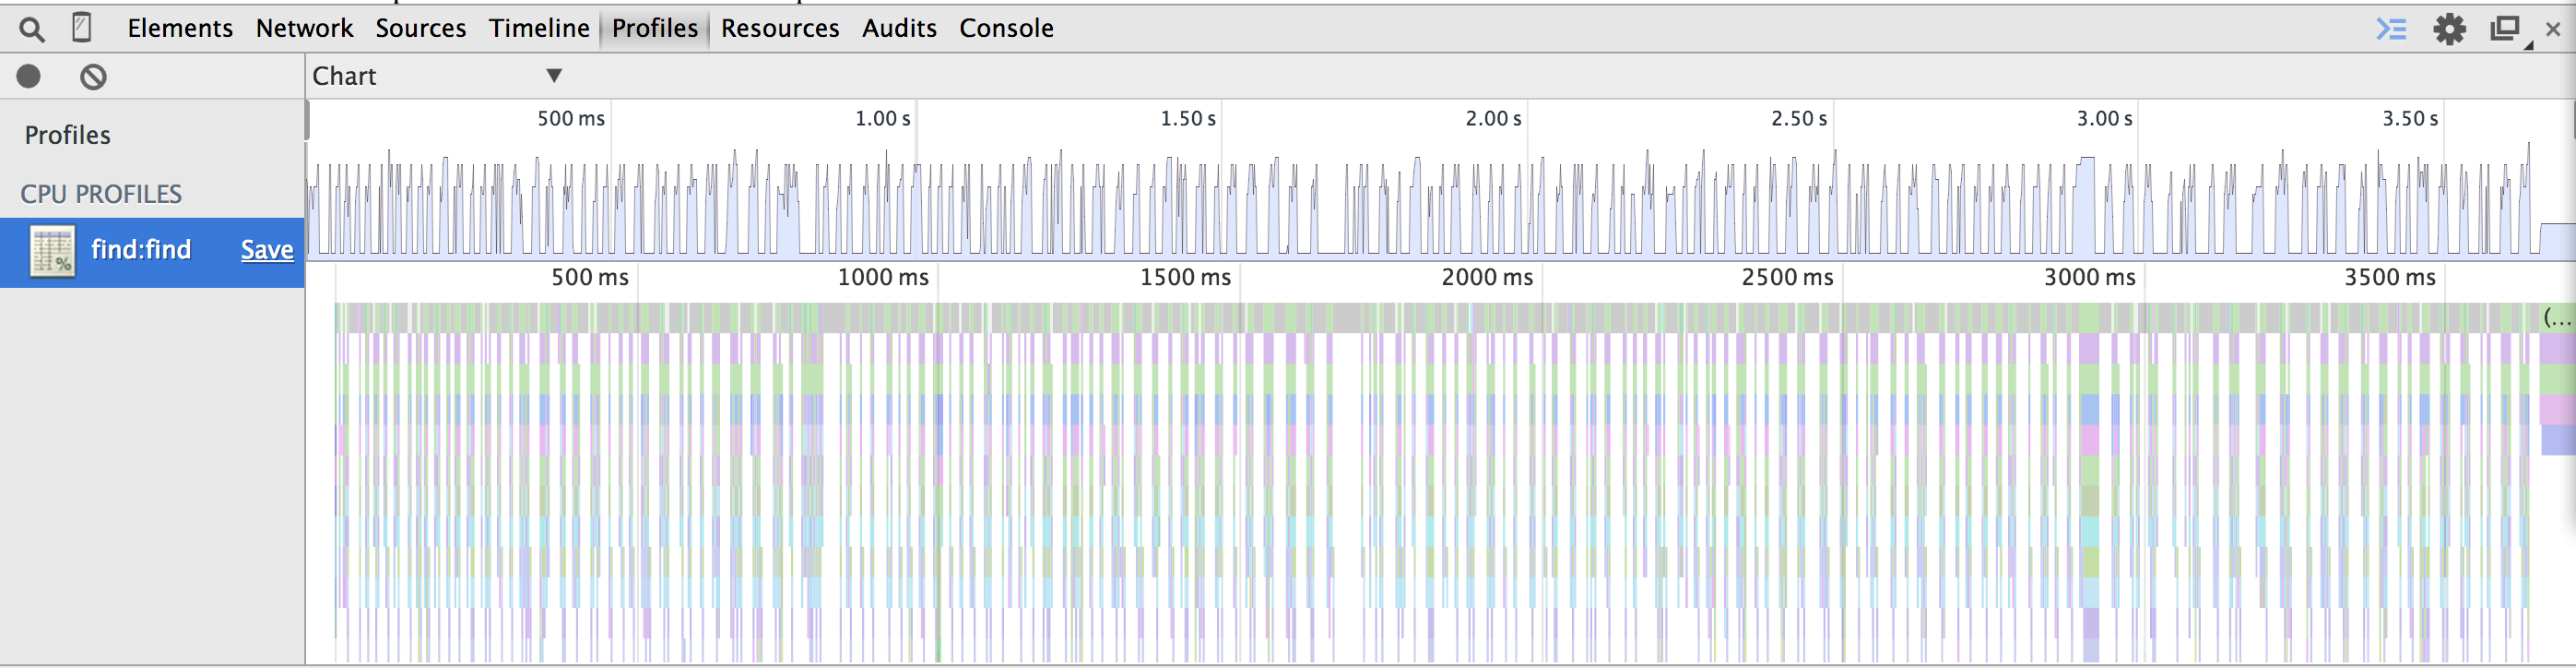
When the method finishes running, the instrumentation is removed. The DevTools now has CPU profile taken during the method's run. I first look at the chart view of the CPU profile
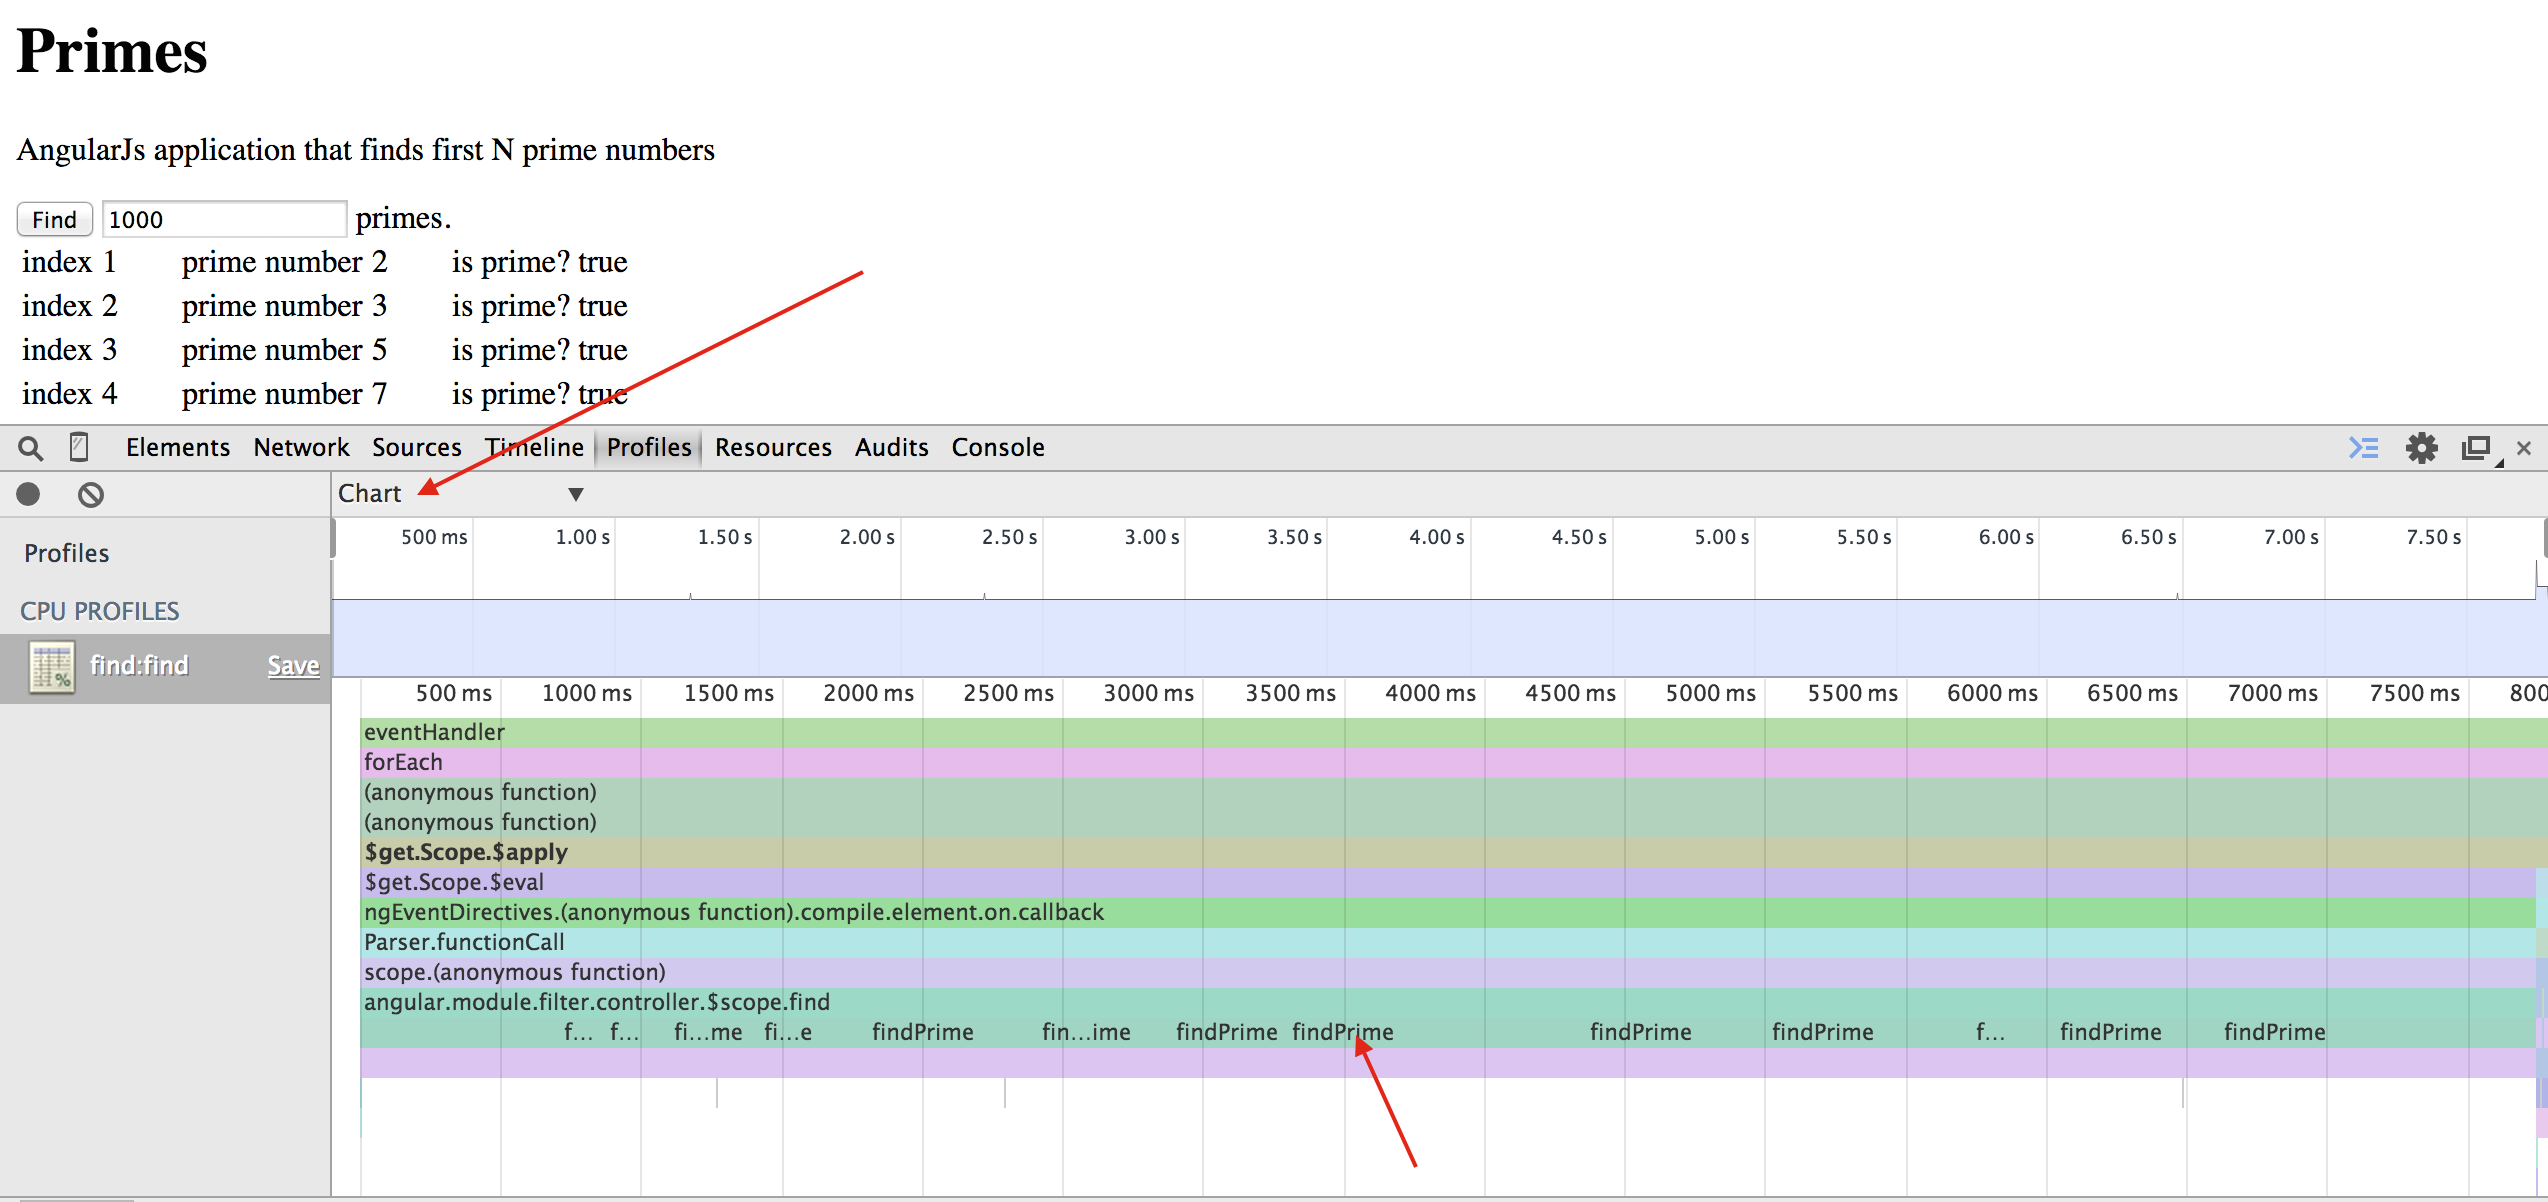
Notice that the pyramid of calls is pretty simple: event handler function runs the entire 8 seconds,
same as $apply, $eval, all the way to scope.find method. Inside our find method, we see multiple
calls to findPrime function. Let us see if findPrime is the performance bottleneck. Switch from
"chart" to "Heavy" view. This shows functions arranged from taking the longest aggregate time (self execution time)
to shortest (on the bottom).
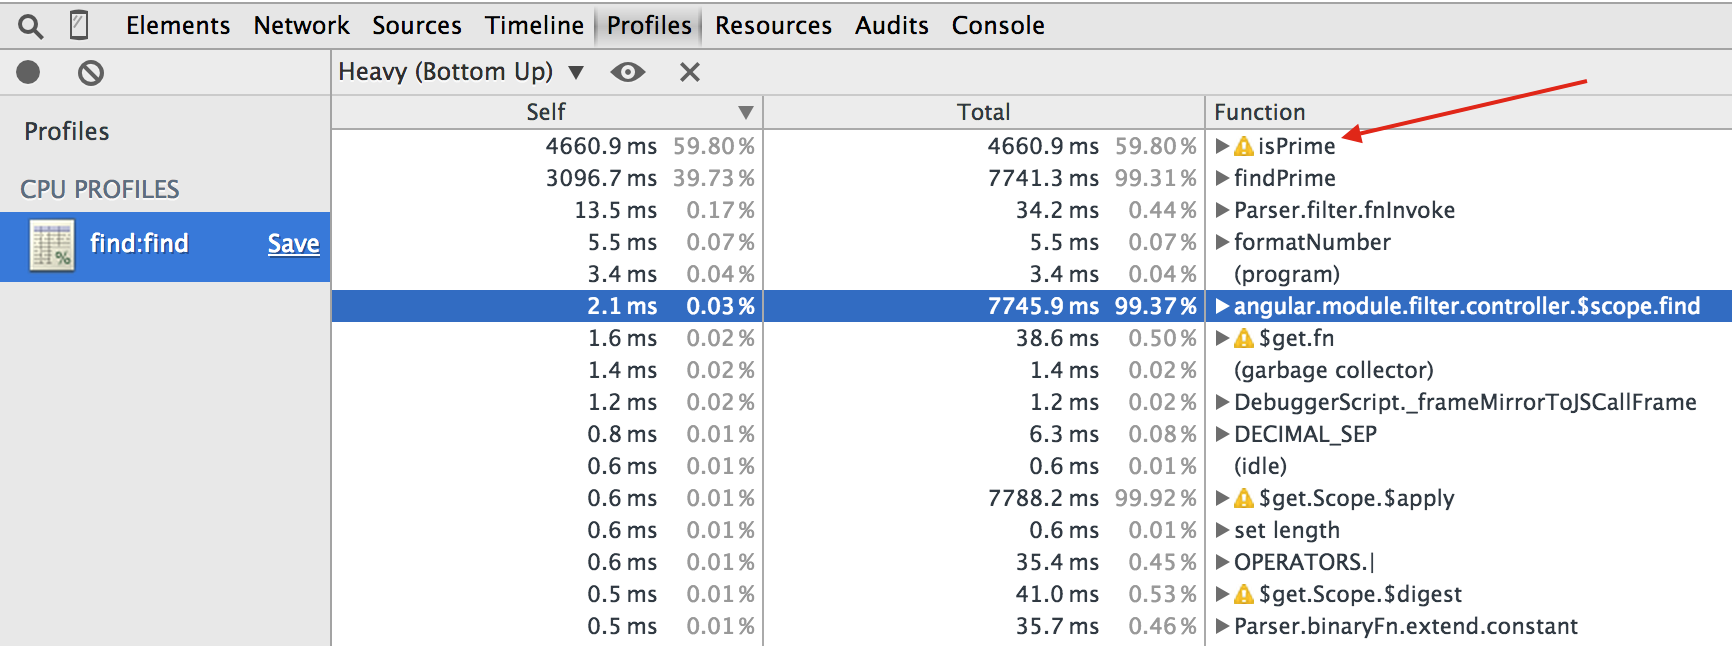
The top 2 functions are isPrime and findPrime that take almost the entire execution time. Notice
a small yellow rectangle next to isPrime. If you hover over it, Chrome DevTools will show why this
function cannot be optimized by the Just-In-Time compiler. In this case it is due to try - catch
statement inside the function. I have written about v8 performance optimizations
before in this blog post
- some language constructs are hard to optimize correctly, and the runtime engine just gives up.
For example, modifying
argumentsstructure or usingfor-instatement will disqualify your function from optimizations and forever put it in a "slow lane".
In our case, isPrime does not need try-catch block at all
1 | function isPrime(n) { |
I removed try-catch and reran the profile code snippet, see tag
step-1.
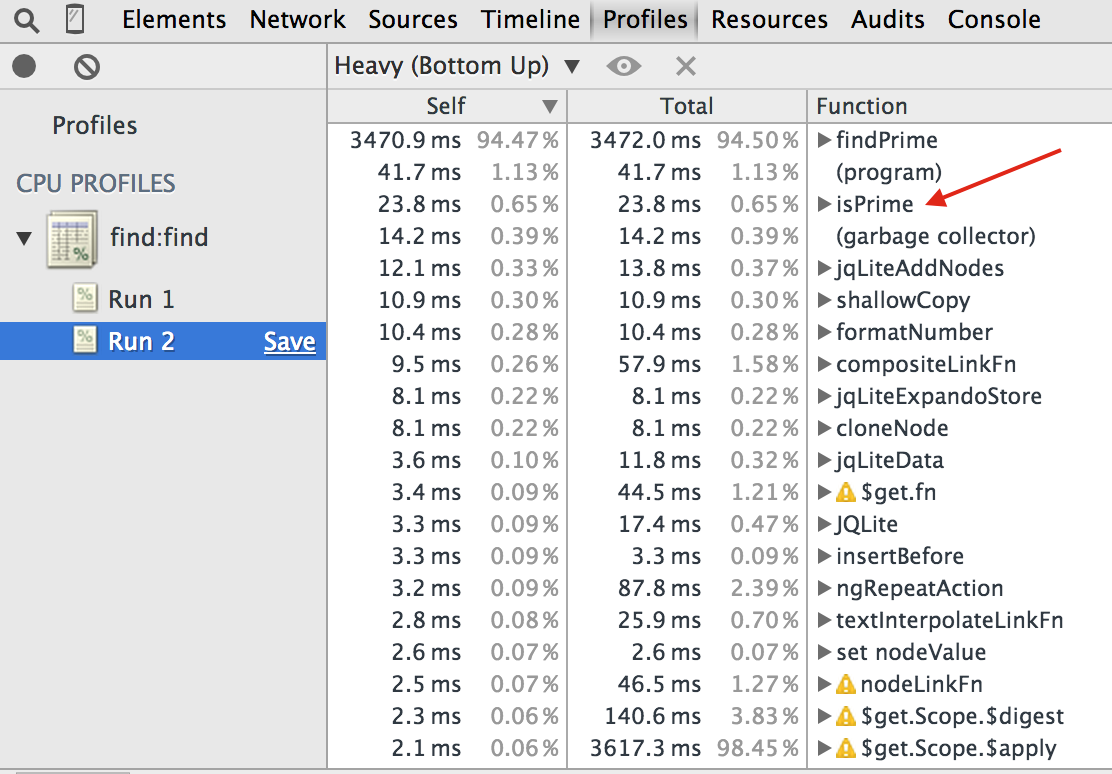
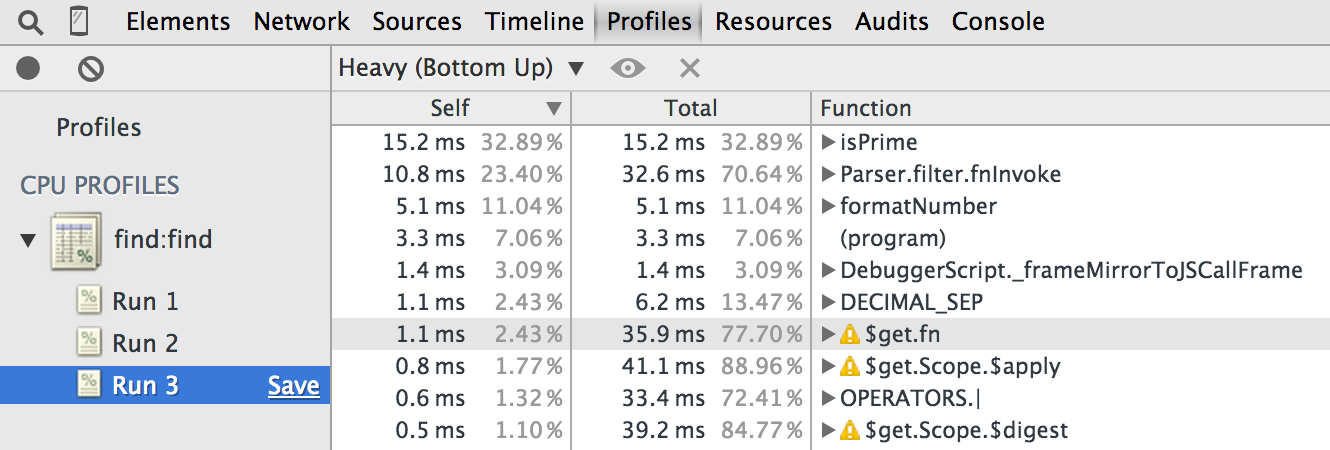
isPrime dropped from 4.5 seconds to 23 milliseconds, while the total time to find 1000 primes
dropped from 7.5 seconds to 3.5 seconds. Notice that if you run ng-profile-scope-method script,
it saved CPU profiles separately so you can compare code's performance between runs.
findPrime function is the new bottleneck. Let us look at its source
1 | function findPrime(n) { |
It finds Nth prime by computing every prime from first to Nth and return the last one.
Notice that if we ask for N + 1st prime, we still redo everything again. Let us
reuse the previously found primes by moving foundPrimes array outside the function to
avoid restarting from scratch. We will also start search from the last found prime + 1.
1 | var foundPrimes = []; |
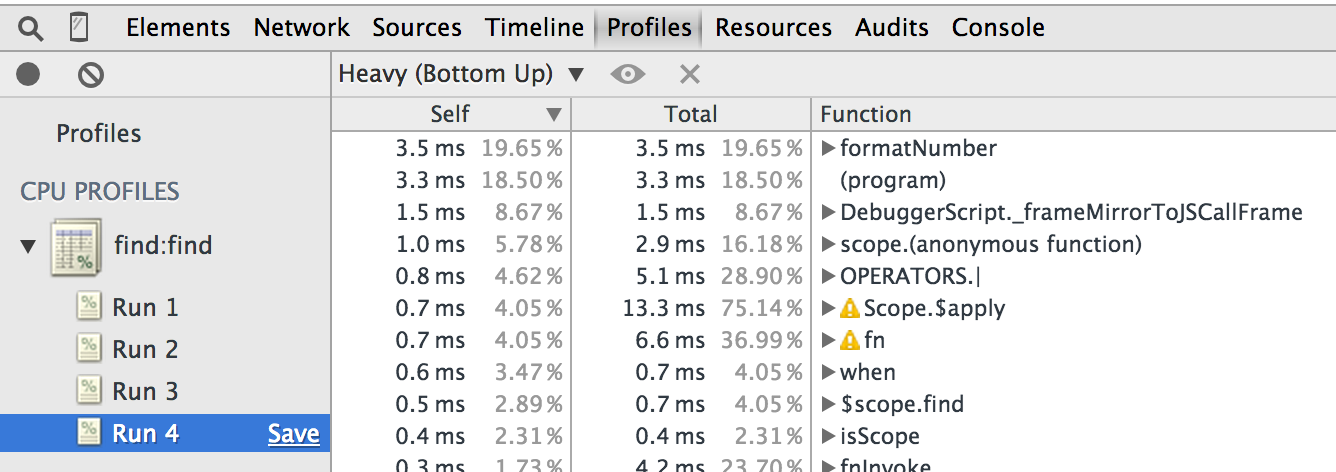
This change is available at tag step-2 and leads to huge performance improvement
The entire $scope.find method now takes 45 milliseconds, which is 100x speed up compared to our initial
code.
We can do one more easy optimization to remove the current bottleneck (function isPrime again).
When checking if a number N is a prime, we do not need to check every number smaller if it divides
it without a remainder. It is enough to check every number smaller than a square root of N.
1 | function isPrime(n) { |
This code version is available at tag step-3.
Profiling scope.find shows that we have removed every obvious bottleneck from our code.
Optimizing digest cycle
We have removed obvious bottlenecks from our application code by profiling a method invoked on a scope object. Let us improve the application's performance even further by looking how it handles large data sets.
First, I will change 1 tiny detail - I will add another two-way binding to show the number N of primes
1 | <button id="find" ng-click="find()">Find</button> <input ng-model="n" /> primes. |
The code is available at tag step-4
Let us generate 100k prime numbers. This will take a few seconds (DOM updates). Once 100k prime numbers are displayed, set focus on the input text field and try changing the number, for example by deleting '0'. Notice there is a noticeable delay between the button press and updating numbers. We are not modifying any model data, except for a single number. The table should not be updating, so why the pause?
To debug this problem, let us use another code snippet
ng-idle-apply-timing.
It just runs the digest cycle without modifying any data and collects the CPU profile. This measures
how long the dirty checking every piece of data in our application takes. Each two-way binding,
each $watch expression adds to the digest cycle duration. A quick look at idle digest cycle using
the code snippet reveals the following bottleneck:
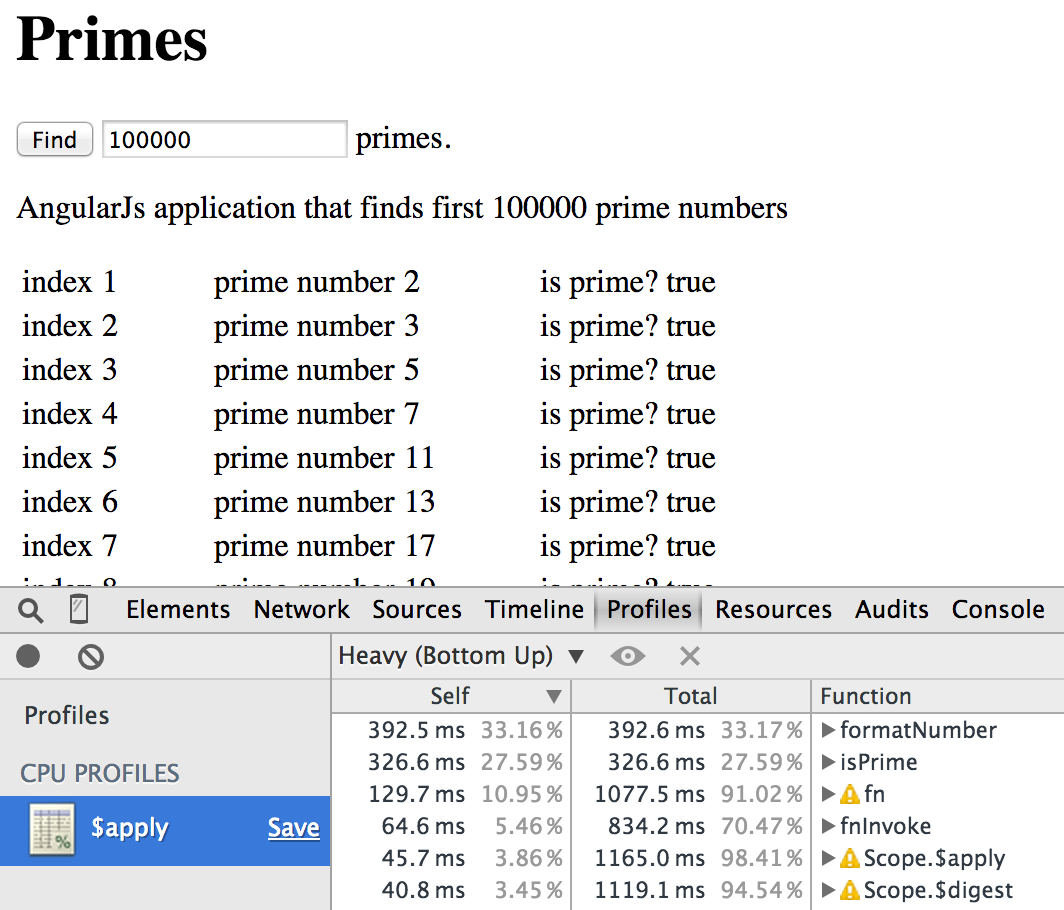
A single idle digest cycle takes 1 second! We need to speed things up. The surest way to speed up a digest cycle is to have Angular do less work by removing unnecessary watch expressions.
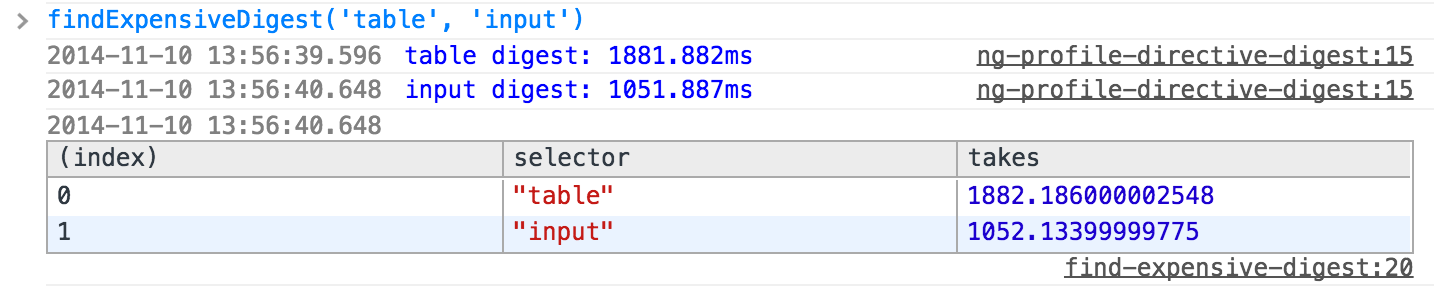
First we can try to pin point which element on the page has slowest watchers attached to its or its children scopes. See Local Angular Scopes for details. In this case we can measure using ng-find-expensive-digest.js the table and input elements (which overlap in scope) to see the result, showing the table being the element with slowest watchers.
We can get an idea how many watch expressions are evaluated by running another
code snippet ng-count-watchers.
It goes through every element's scope and sums total number of found angular watchers. When we have 100k
prime numbers in the table, the code snippet shows 500,003 watchers! There are 3 watchers that observe
the ng-repeat directive, entered text and template expression `{{ n }}`.
The rest (500k watchers) are watching the cells in the primes table.
1 | <tr ng-repeat="prime in primes | orderBy:$index "> |
Notice that we have a lot of unnecessary overhead for each row. For example, the template expression
"index" | lowercase is static text that will never change. Angular evaluates it over and over,
but the result never changes for a cell, even when number of rows changes. Let us remove the template,
including the lowercase, uppercase, isPrime filters - they do nothing.
1 | <tr ng-repeat="prime in primes | orderBy:$index "> |
The updated application has only 200,003 watchers for 100k prime numbers, with idle digest cycle running twice faster.
The code is available at tag step-5.
Use bind-once
We have cut the pause when typing in half by removing unnecessary templates and filters.
There is still room for improvements. Notice that while the table does not change, we still evaluate
two watchers for every row whenever we type into the input text box (which triggers application's
digest cycle). The data does not change, so we should not reevaluate the expressions. Angular 1.3
introduces one-time binding using ::prime syntax.
When using angular 1.2 that does not have this feature, I suggest using bindonce
library. The changes required to change from two-way to one-way binding are trivial.
The filter syntax is supported too:
1 | <tr ng-repeat="prime in primes | orderBy:$index " bindonce> |
The updated application has only 3 watchers despite showing 100k primes, and the idle digest loop takes 5ms, leading to very responsive user interface.
The code is available at step-6.
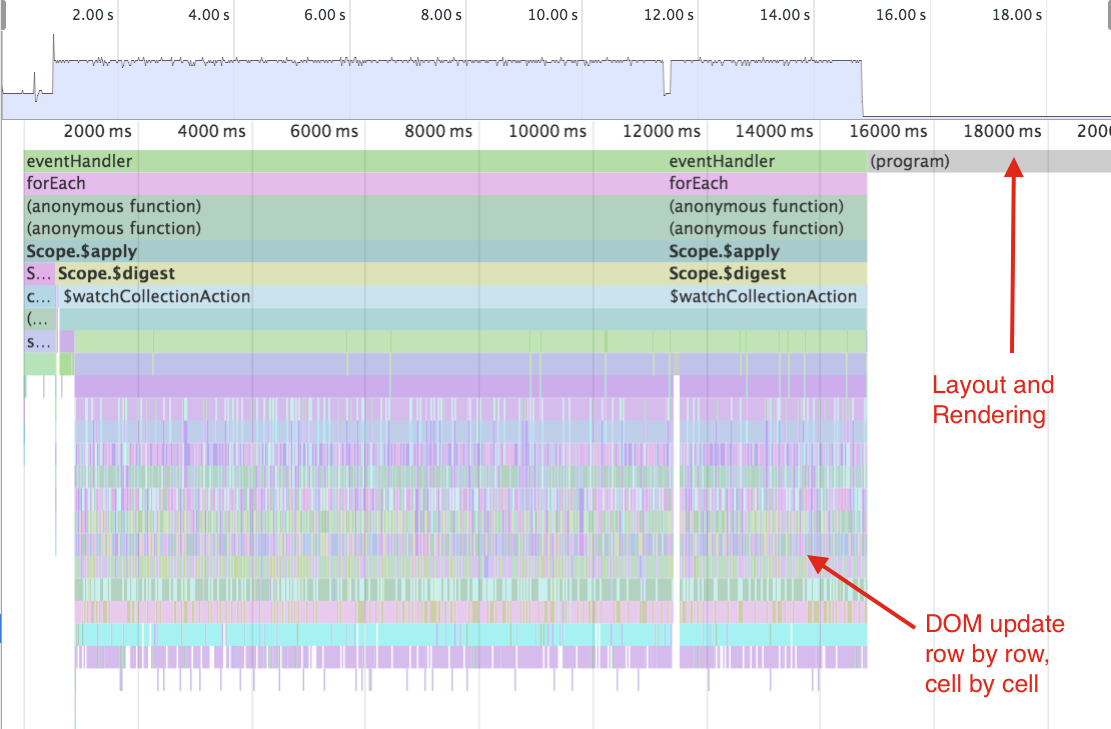
In-code markup generation
When profiling the table generation, I noticed a weird pattern: seems every row / cell generation caused several function calls. This takes 10 seconds when generating table with 100k primes.
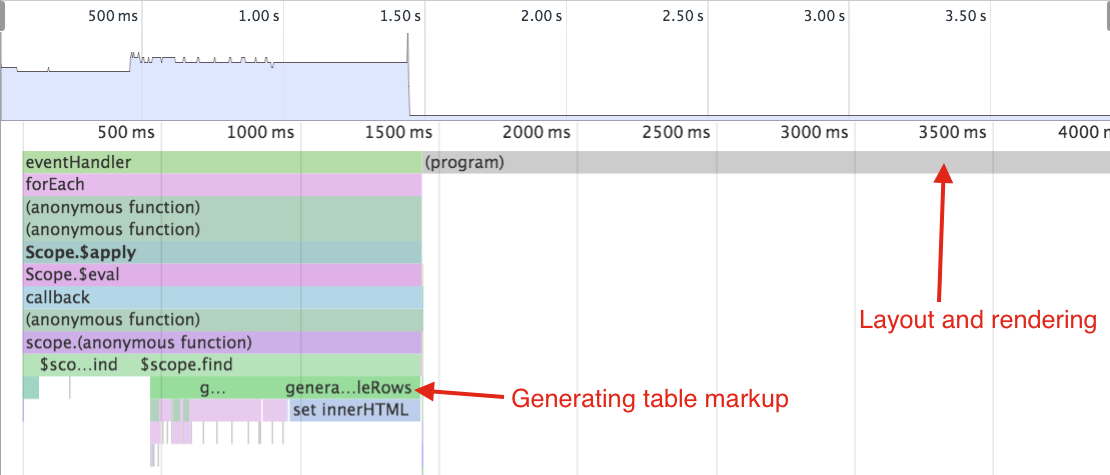
To further improve this part of the application, I tried generating markup string manually
and then setting the entire table in a single call using innerHTML property. The new markup
is an empty table <table></table> without any Angular templates. The markup is generated in
code instead
1 | // use AngularJs built-in filter |
The code is available at step-7.
This markup generation is much faster than individual cell binding. In my case, it was 10 times faster.
Of course, this gives up the flexibility of the angular model binding, and this substitution is only appropriate when the application's design and data flow are not going to change.
Improving initial rendering time
Let us approach the problem from a different view point. When a computation takes a long time,
we can show the initial results very quickly. The user can see the initial results, while the
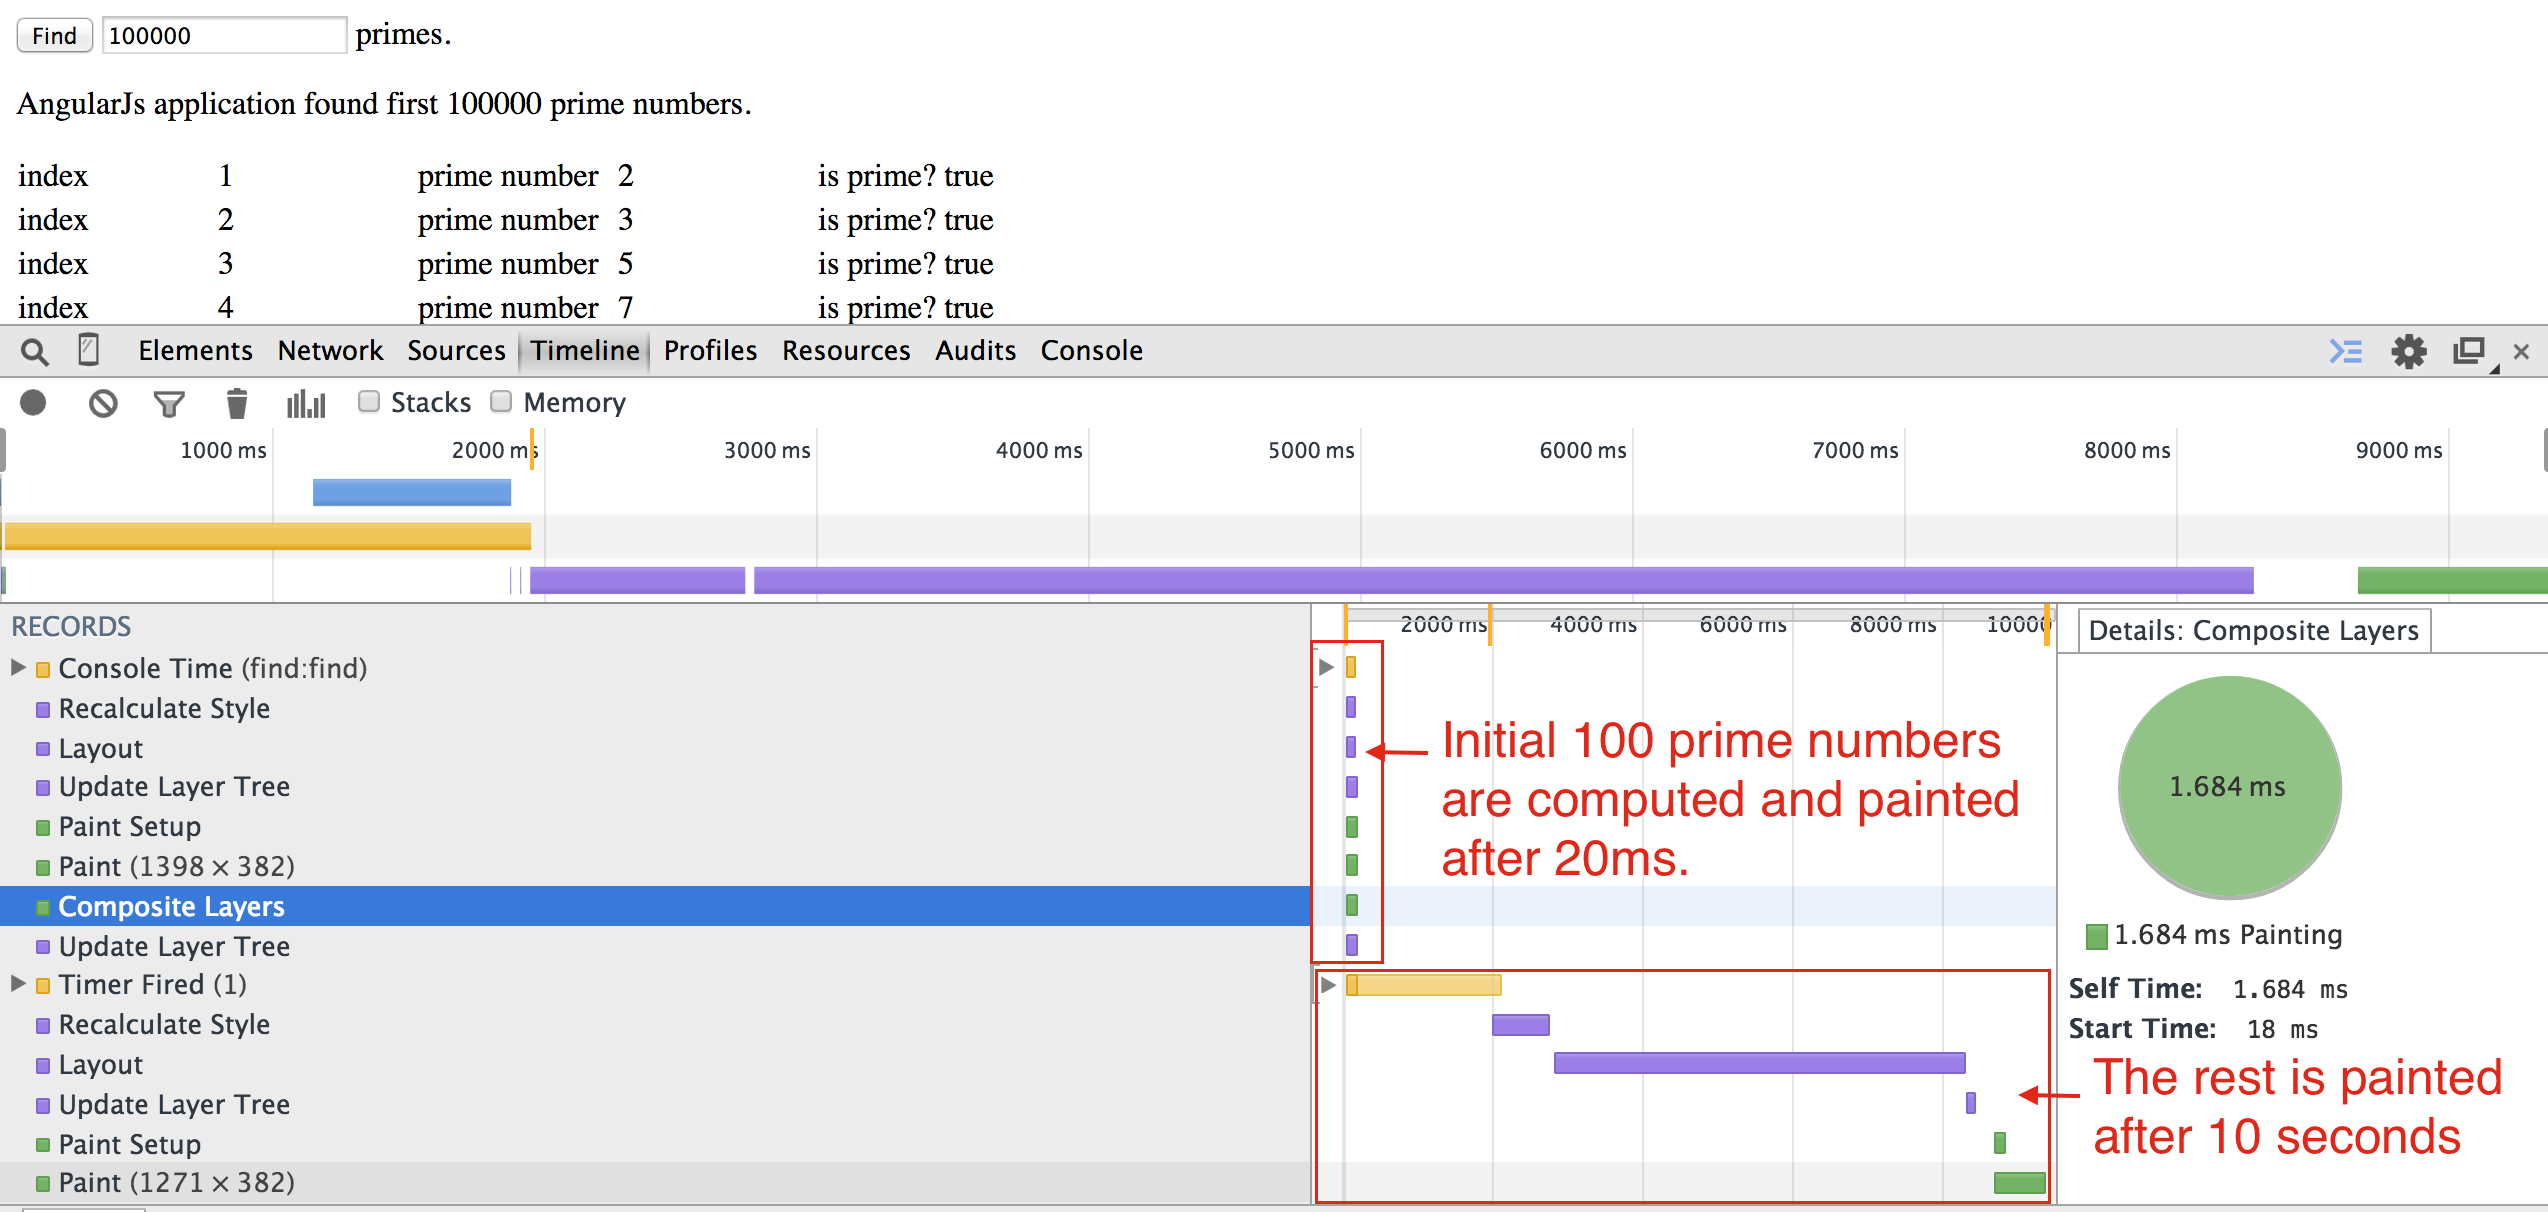
rest of the computation finishes. In our example, we can compute and render
the first 100 primes very very quickly ( < 30ms). I split the computation in two batches,
and used $timeout service to schedule the second batch to start after DOM have been updated
and the browser repaints the table with first 100 rows.
1 | $scope.find = function () { |
This code is available at step-8.
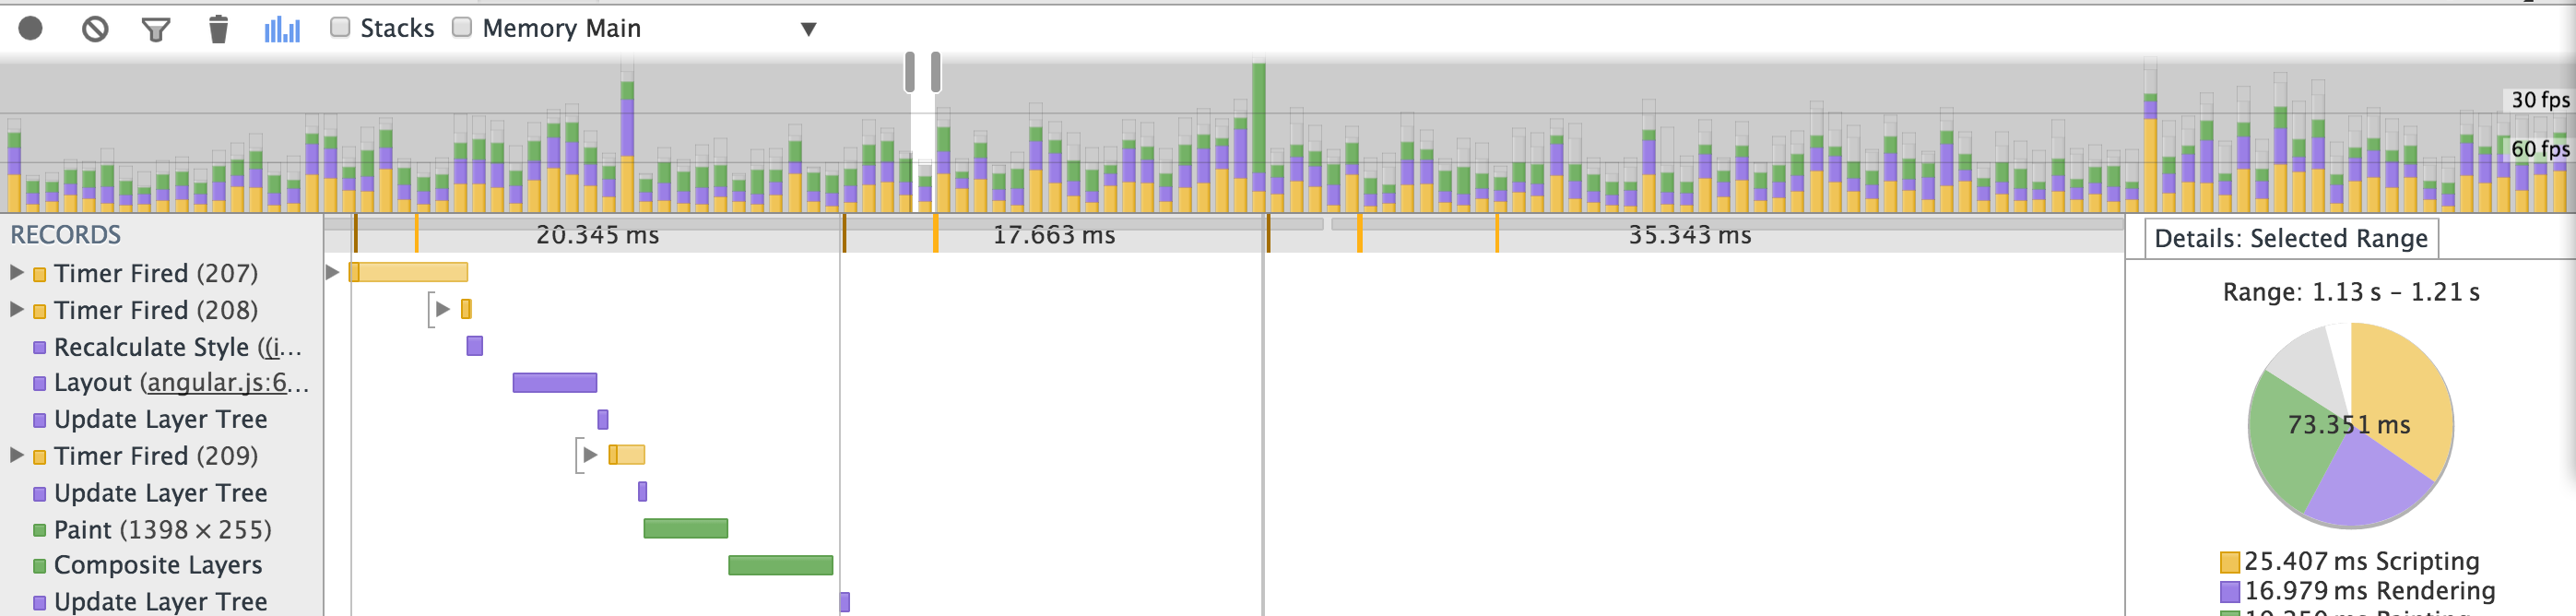
Timeline for this the two-step $scope.find method shows two actions very clearly. The first
repaint finishes after 20 ms after clicking find button. The user cannot interact with the
table though, because the second batch completely freezes the browser while computing
the rest of the primes and computing the layout again for the entire table.
Working in batches
When computing and showing these results, the browser performs 4 operations:
- JavaScript client (application) code execution
- Layout computation (position and size of each DOM element)
- Rendering each component into separate buffer
- Painting the buffers and showing the result
These actions all occur using a single thread. Conceptually simple, this might present a performance problem when one part takes too long. For example, complex CSS styles lead to longer layout and rendering times, blocking the client code from running again. Each iteration with these 4 steps should take less than 33 ms if we want to achieve 30 fps, or less than 16 ms if we target 60 fps.
We split our application into two batches in the previous step: a small initial batch that quickly shows first 100 primes and the remaining very large batch that shows after a long delay. Because the second batch takes long time to compute and render, the browser was completely frozen, not letting the user to look at the results from the first step.
Let us split the entire computation into lots of small batches. Each batch will compute and display only 50 primes. The entire loop (code execution, dom updates and rendering) should take less than 30 ms, allowing user input to go through (for example to scroll).
To schedule code to run after the browser layout / rendering / painting actions,
I will use $timeout service call after calls to the DOM.
1 | function computePrimes(first, last) { |
The main computation method $scope.find now creates a giant chain of promises, that will run
one after the other. (Read Chaining promises for more
examples how to connect steps into promise chain).
Each step will compute 50 primes, generate new rows markup, then will add the new markup to the DOM
and will let browser repaint itself.
1 | $scope.find = function () { |
The result profile shows a nice sequence of computations and dom updates
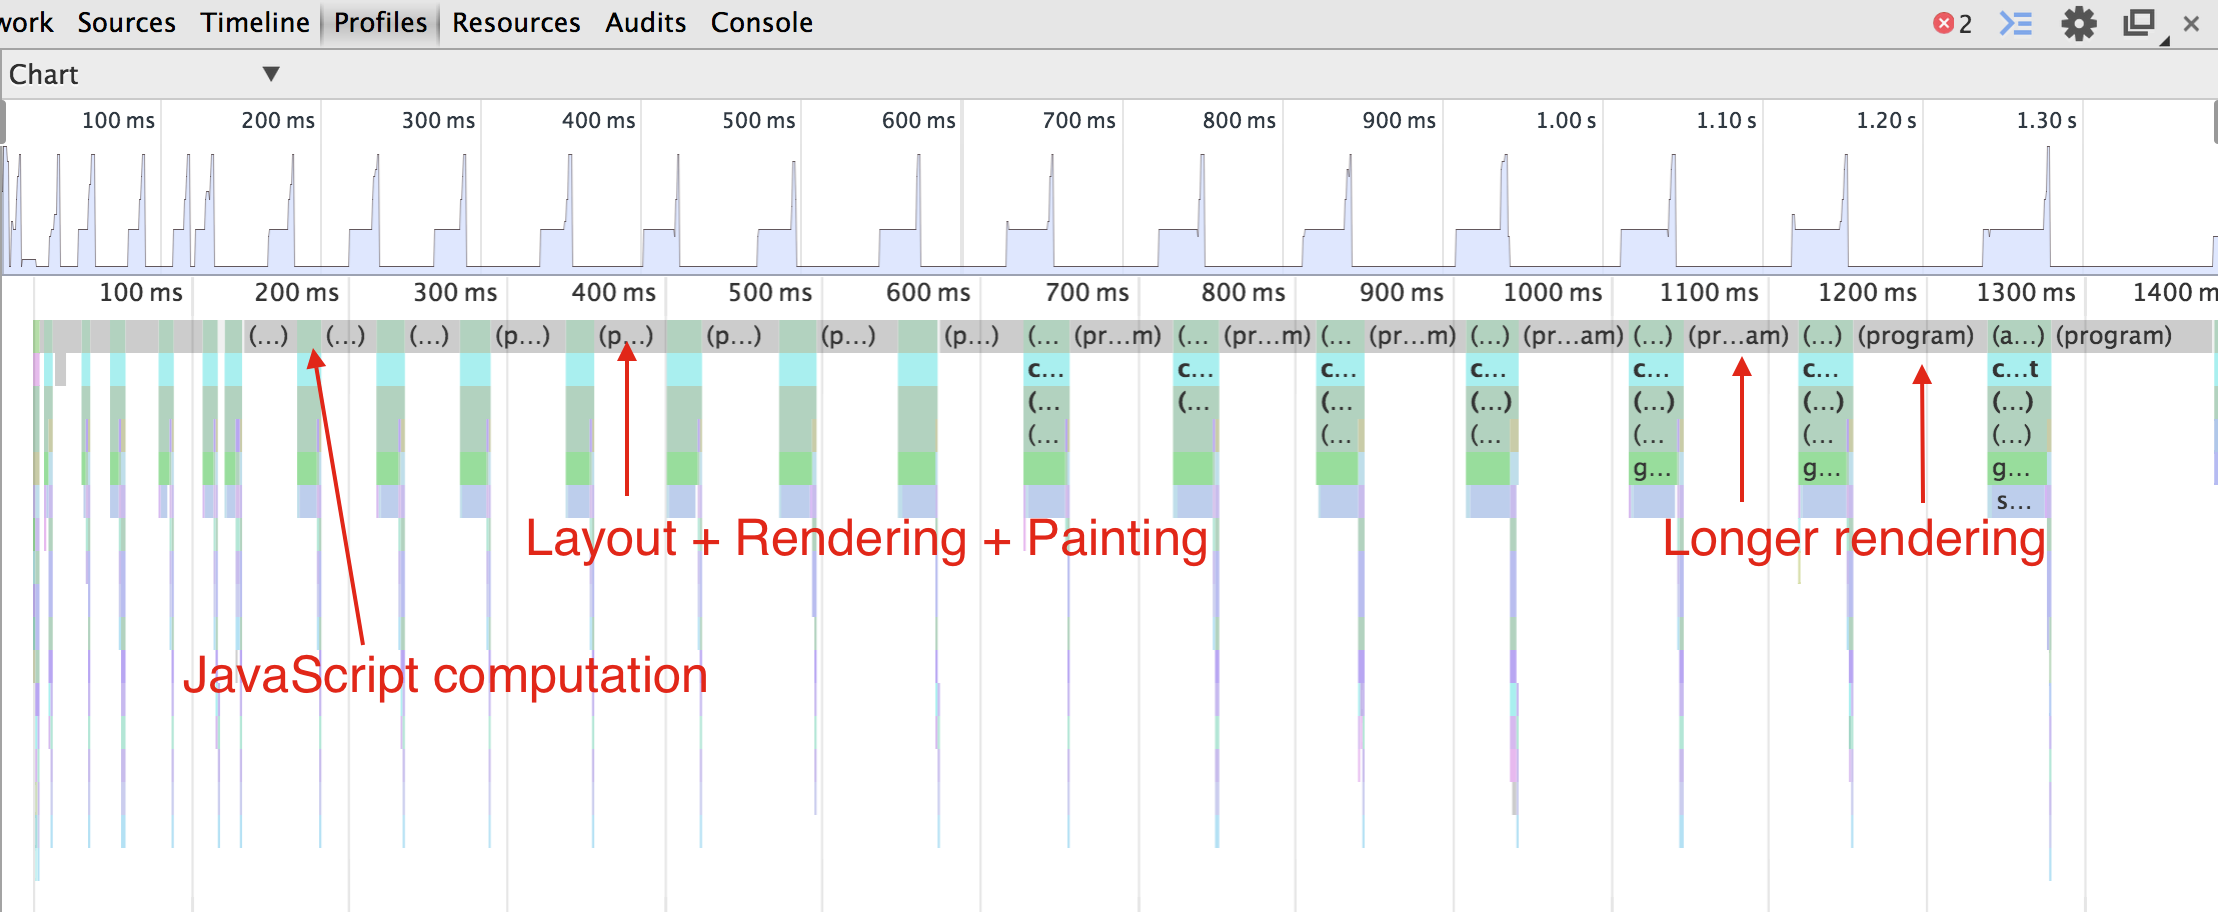
The code is available at the tag step-9.
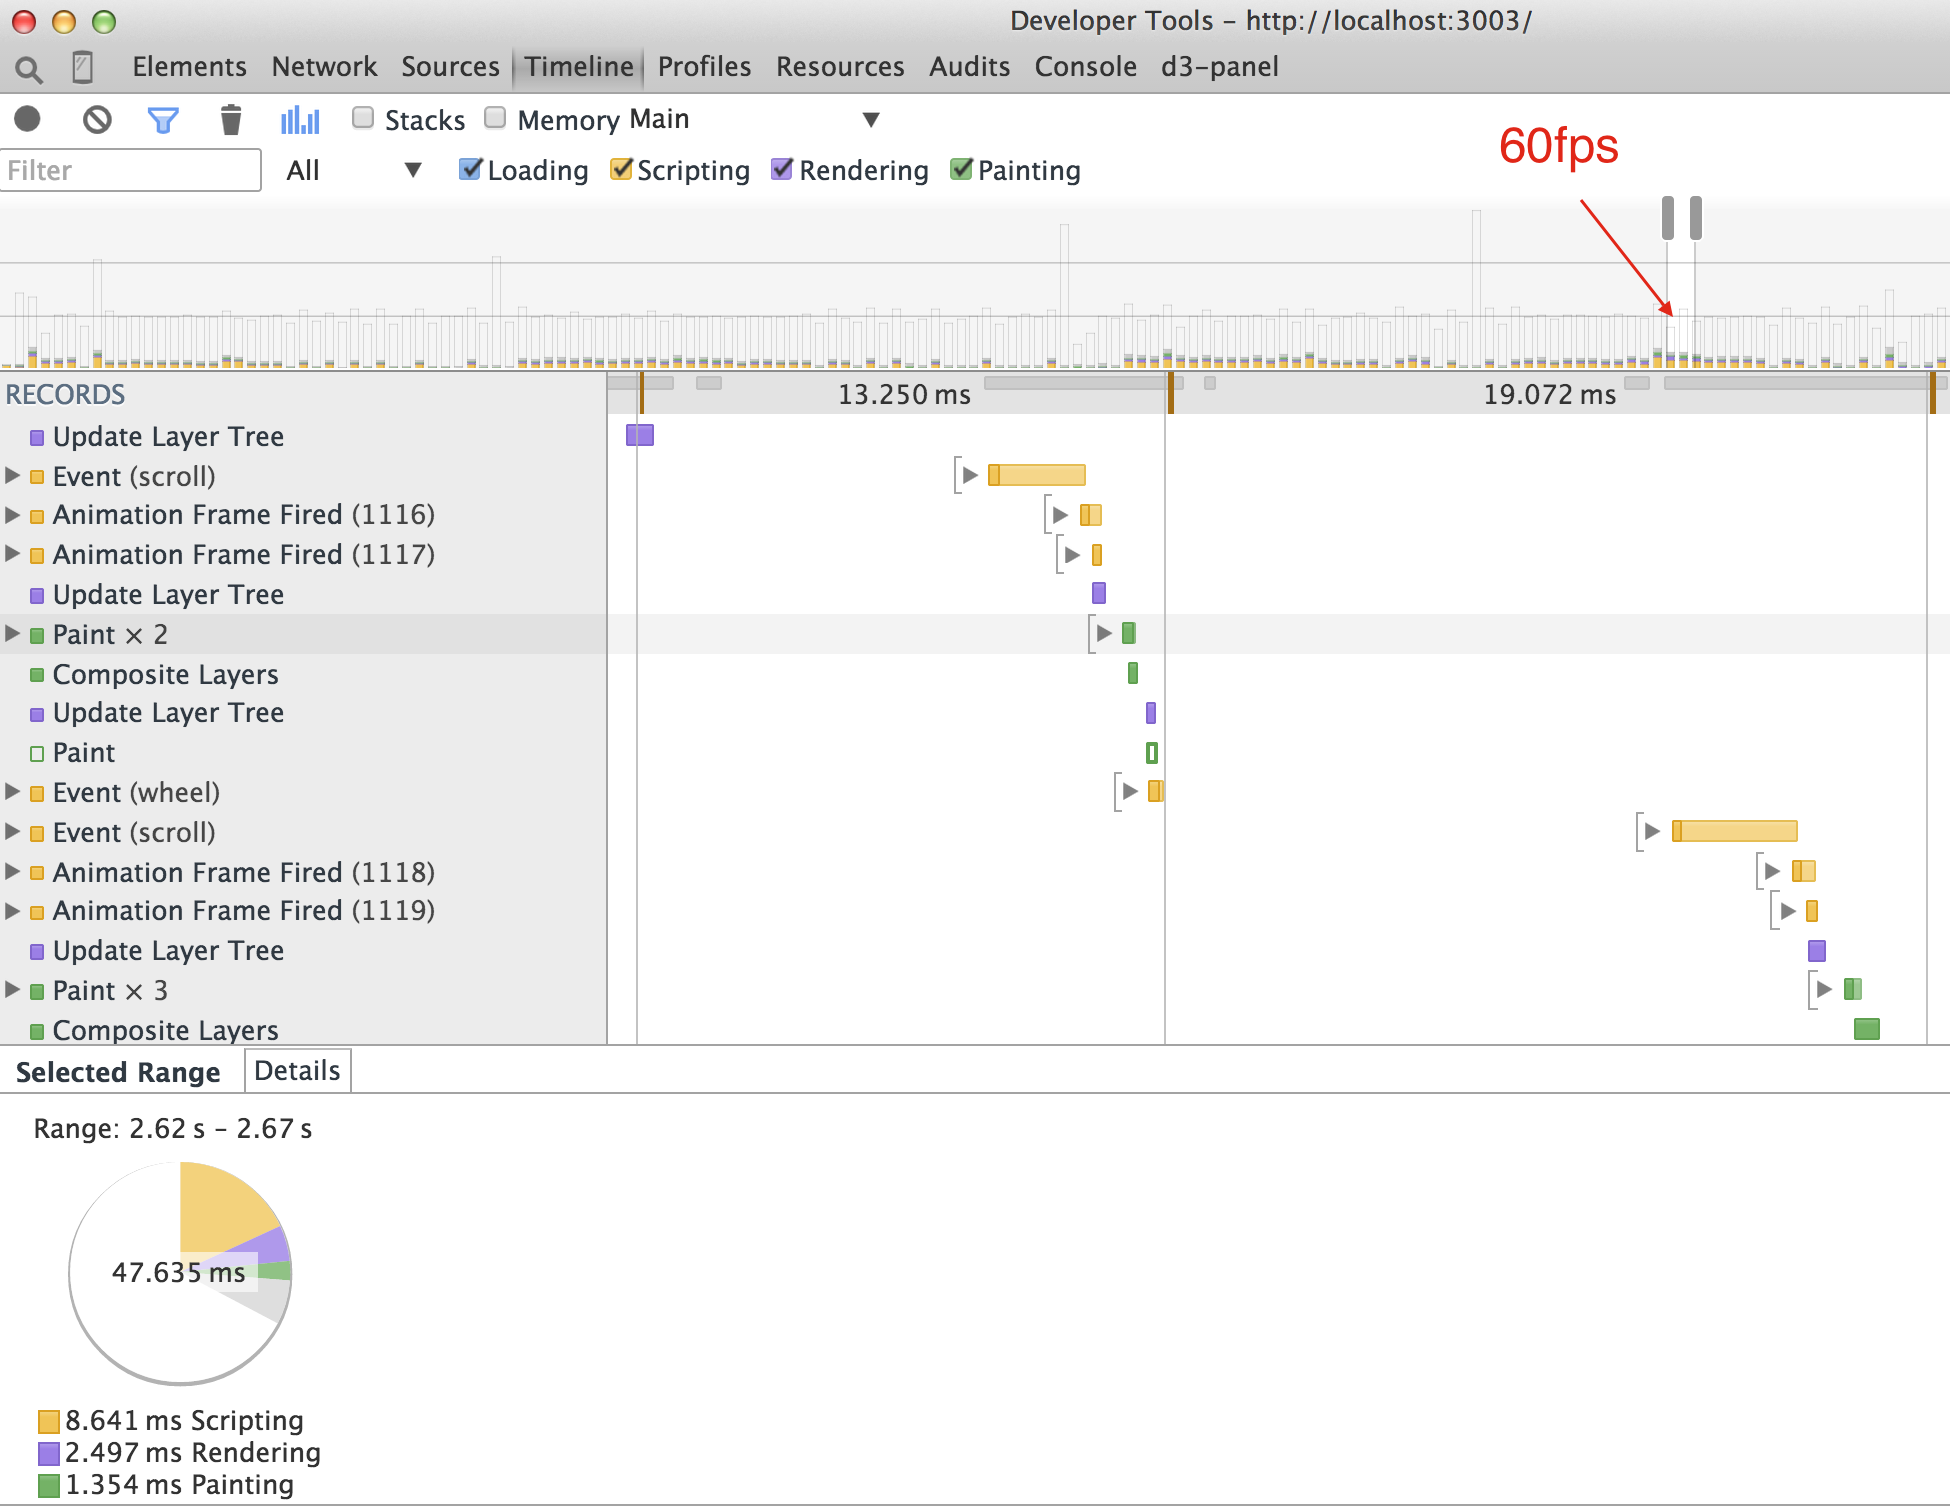
We can look at each batch in the timeline individually to confirm that our actions execute one after another
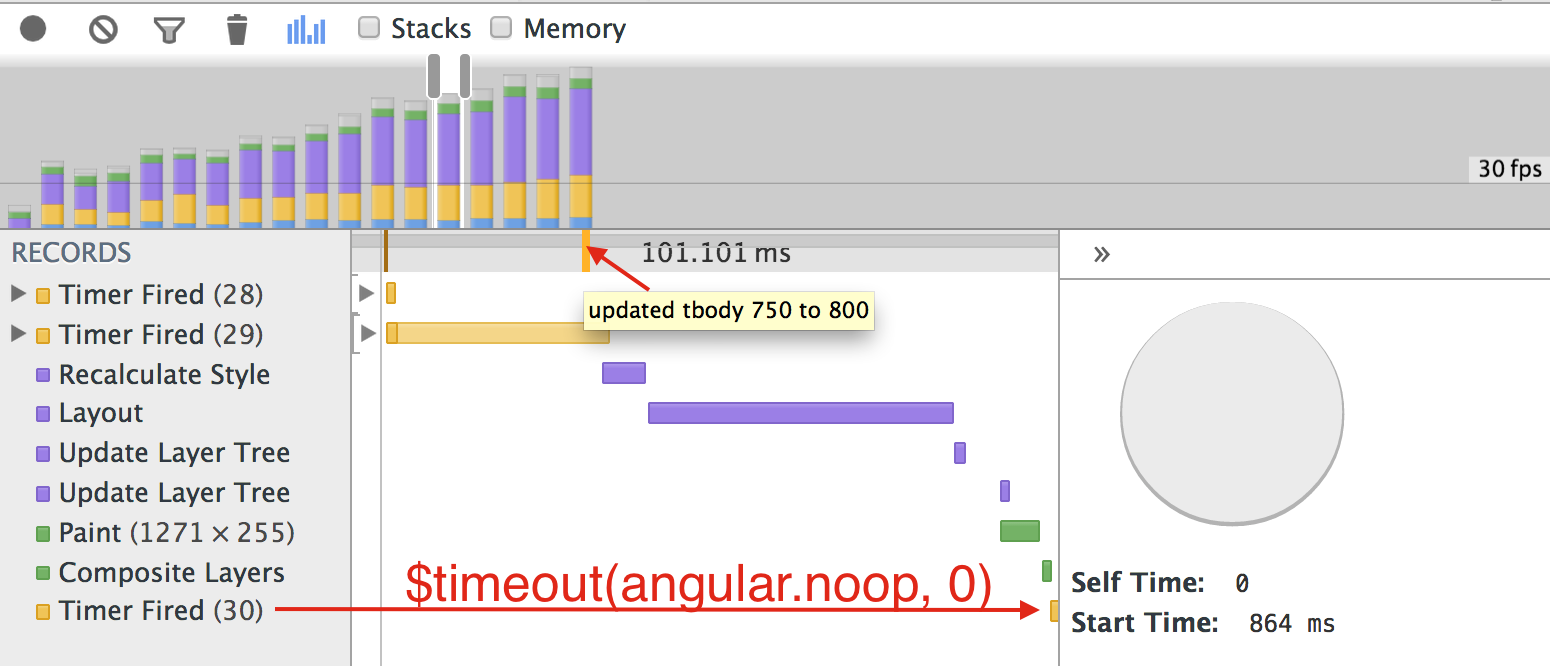
But we can also see how the updates slow down after a while. The violet bar (rendering) is becoming longer and longer with each batch.
The problem is how we place new rows' markup into the table. We append the new text to the existing on, forcing the browser to compute layout and re-render the entire table!
1 | function generateTableRows(first, last) { |
Instead of replacing the entire table's HTML, we can create new table and append it to the document's body. We could also append another tbody element to the single table instead, but I have not measured that case.
1 | function generateTableRows(first, last) { |
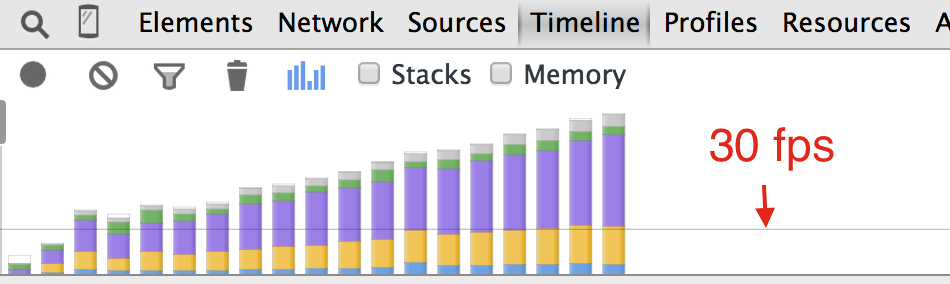
The modified application shows 30 fps behavior. You can freely scroll why the new numbers are being generated.
The code is available at the tag step-10.
Offloading computation to web worker
Finally, I decided to parallelize the computation by computing the primes in separate web worker thread.
I moved isPrime and findPrime functions into primes.js file. It communicates with the main code
via messages
1 | // primes.js |
To simplify main code to web worker requests, I created a service
1 | angular.module('Primes', []) |
The $scope.find method has to handle computation asynchronously, becoming
1 | .controller('primesController', function ($scope, $filter, $timeout, $q, PrimeWorker) { |
This code is available at tag step-11. In order to load the web worker script, you need to run a web server in the main folder. I often use http-server for lightweight testing.
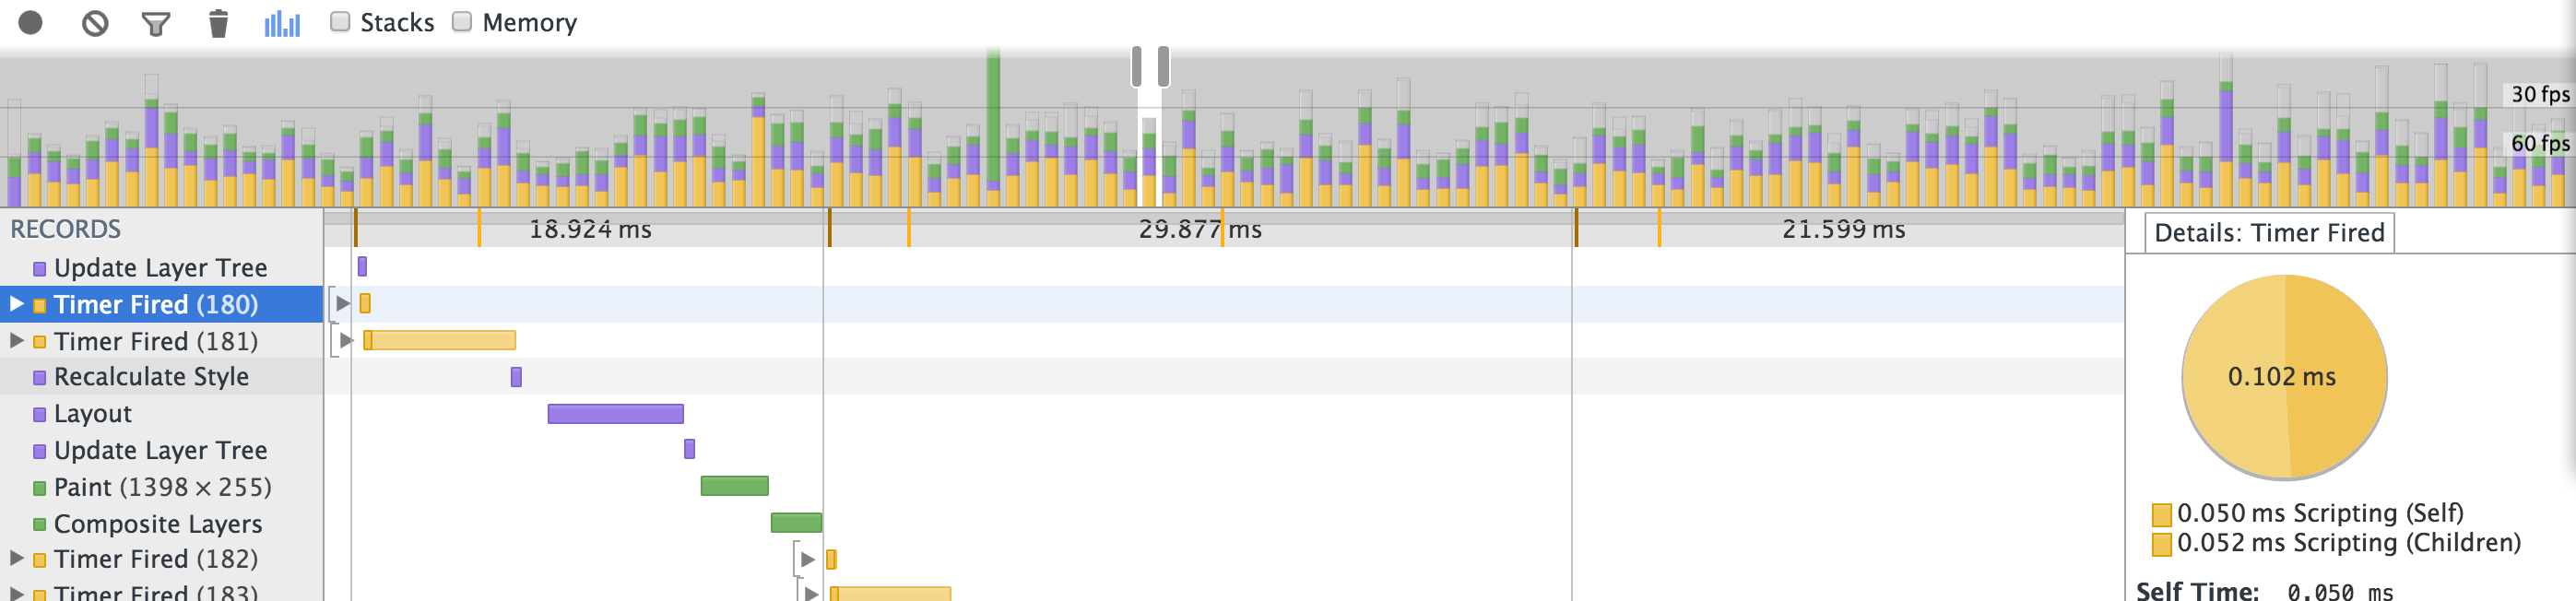
The CPU profile now shows nice narrow spikes for the main code
The timeline shows shorter computation bars, and majority of batches coming under 60 fps target.
Optimize memory allocation
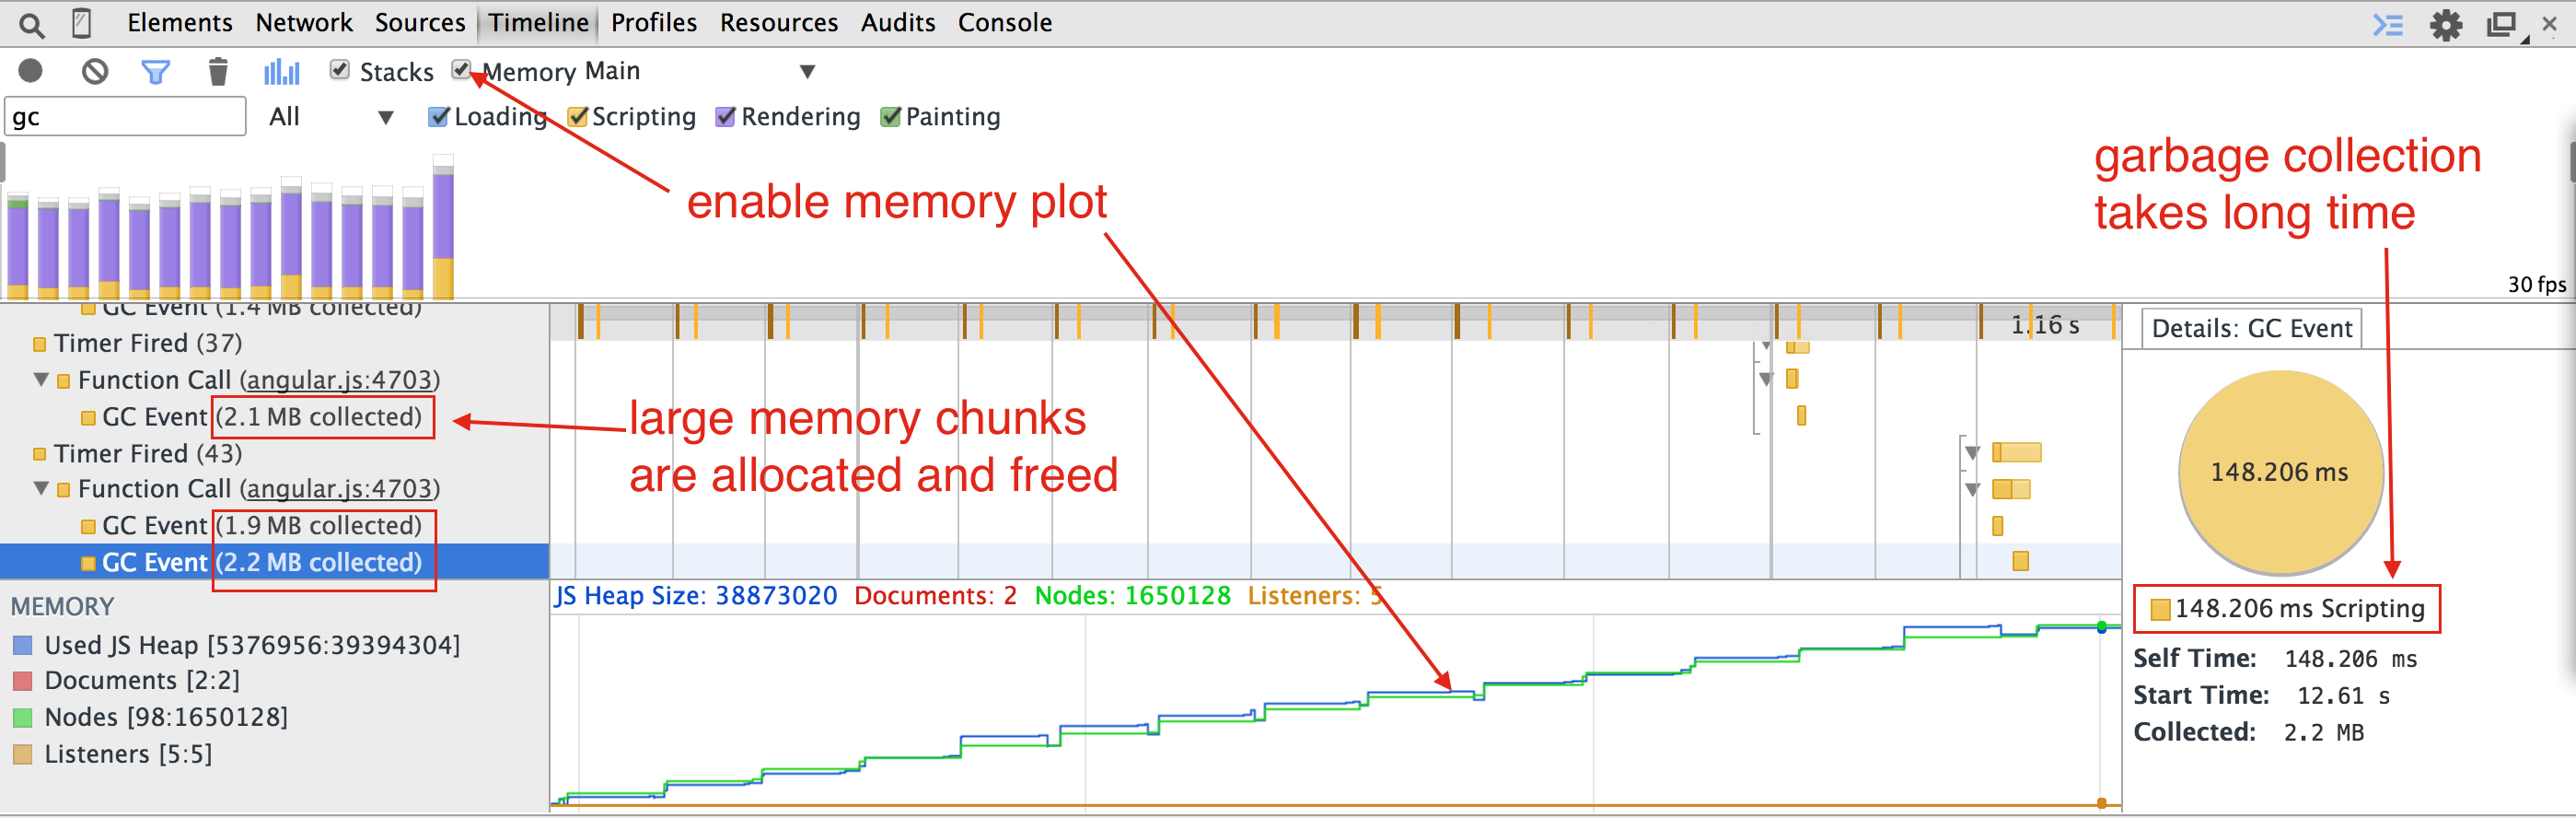
If our application allocates and frees a lot of memory, the browser has to pause periodically to collect free memory. The garbage collection pauses are unpredictable and can be long. To find these "GC events", look at the timeline and enter "gc" in the filter input box. In our case, we have significant garbage collection delays: several megabytes are freed at a time, and it is taking more than 100 ms at a time. (I am generating total of 150k primes in batches of 10k). You can easily see different memory allocation events by enabling memory view in the timeline.
In our example the prime candidate for freed memory is the $scope.primes array. Notice that it is growing
dynamically because it starts with length 0, and we keep pushing new prime numbers into the array one by one.
// copy results into our list
var k, n = numbers.length;
for(k = 0; k < n; k += 1) {
  $scope.primes.push(numbers[k]);
}
This is very inefficient from memory allocation standpoint - when the a new element is added to the array that is full, the runtime has to allocate a new array, usually twice the size of the current one, copy numbers and collect the memory from the first array. I changed the code to pre-allocate the array to be the final length, keeping a number of computed primes instead.
// initialize the array length
$scope.primes = new Array($scope.n);
$scope.computedN = 0;
// copy numbers
var k, n = numbers.length;
for(k = 0; k < n; k += 1) {
  $scope.primes[$scope.computedN] = numbers[k];
  $scope.computedN += 1;
}
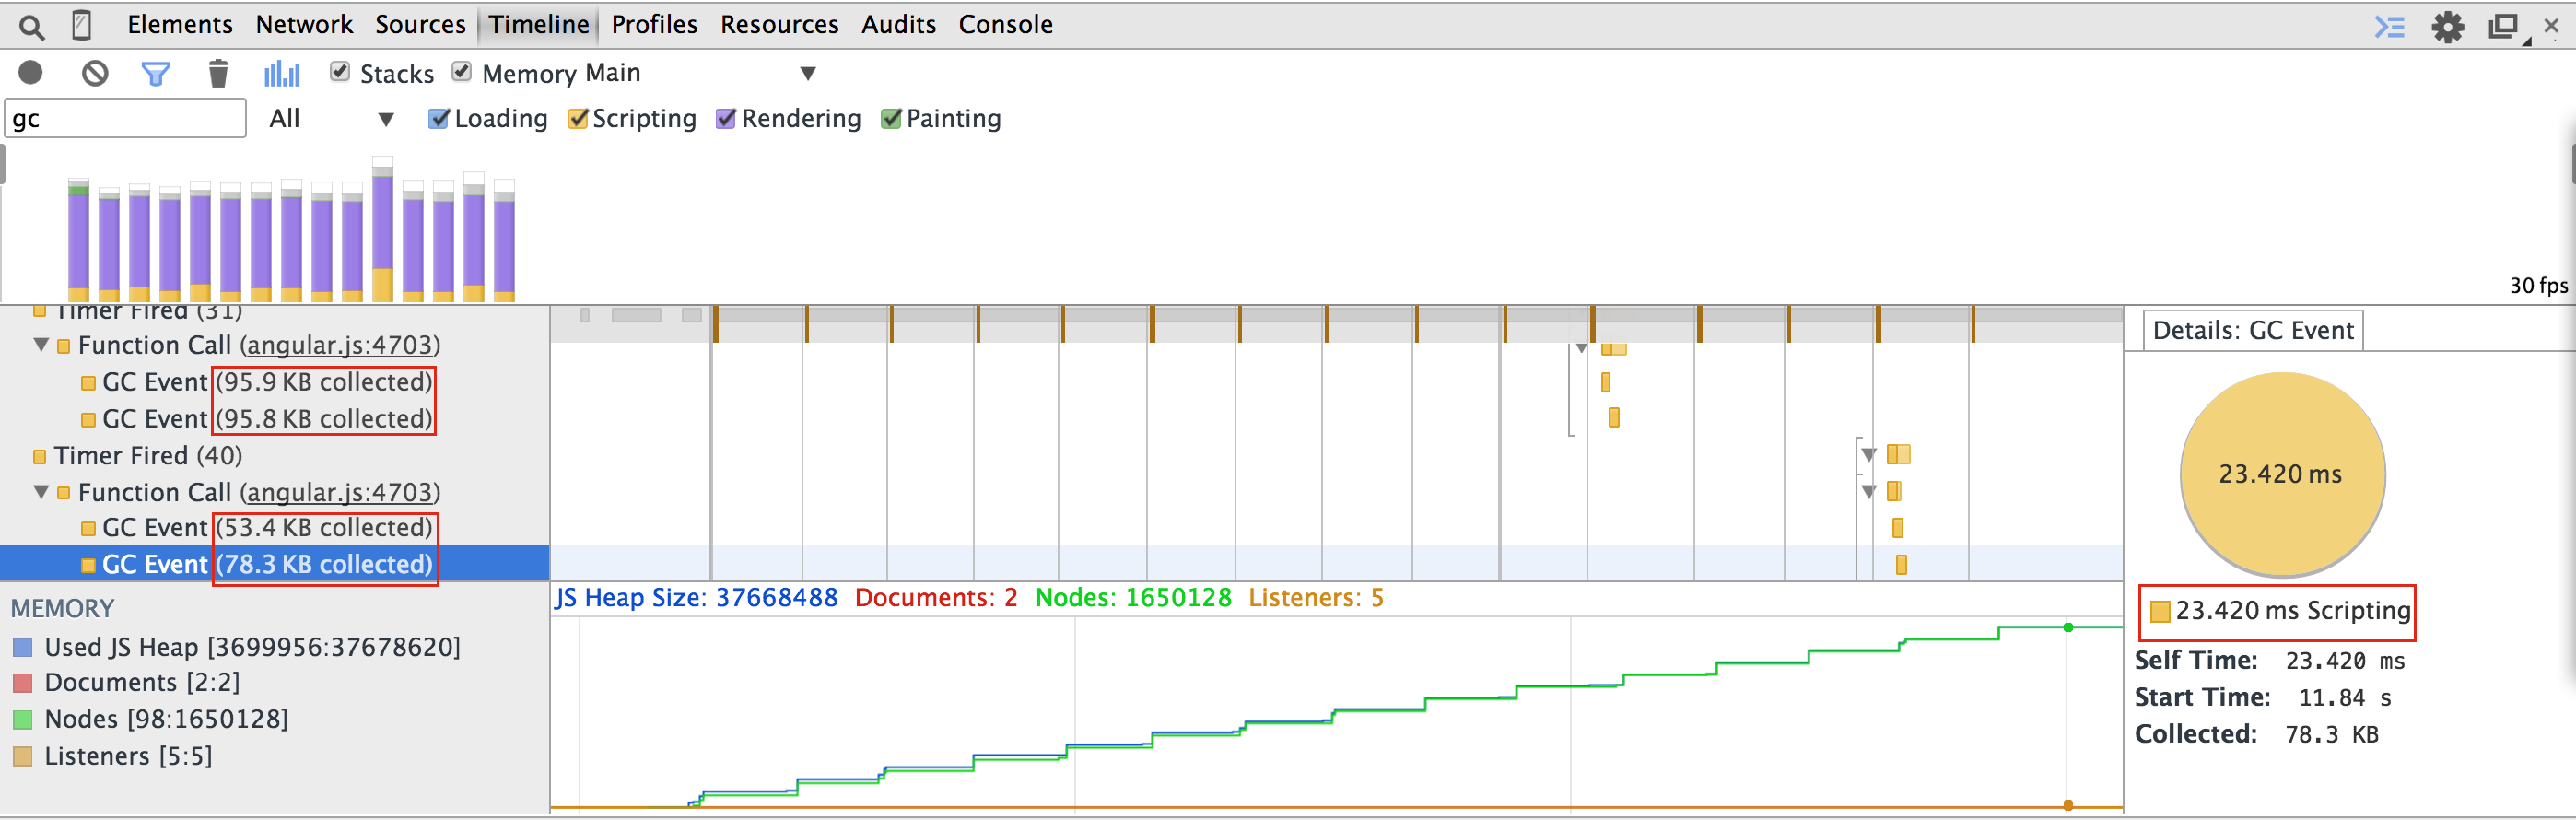
The timeline now shows much smaller GC events. I had to reload the page and close / open the DevTools again to actually reset the profiler in order to see this change, seems like the bug in DevTools.
You can find this code at tag step-12.
Memory profile in isolation
We are preallocating found primes in the main JavaScript code. To better see the memory allocation, let us isolate individual steps. First, let us turn off DOM generation - it is generating a lot of noise when allocating elements.
function computeAndRenderBatch(first, last) {
  return computePrimes(first, last).then(function () {
    // generateTableRows(first, last);
    return $timeout(angular.noop, 0);
  });
}
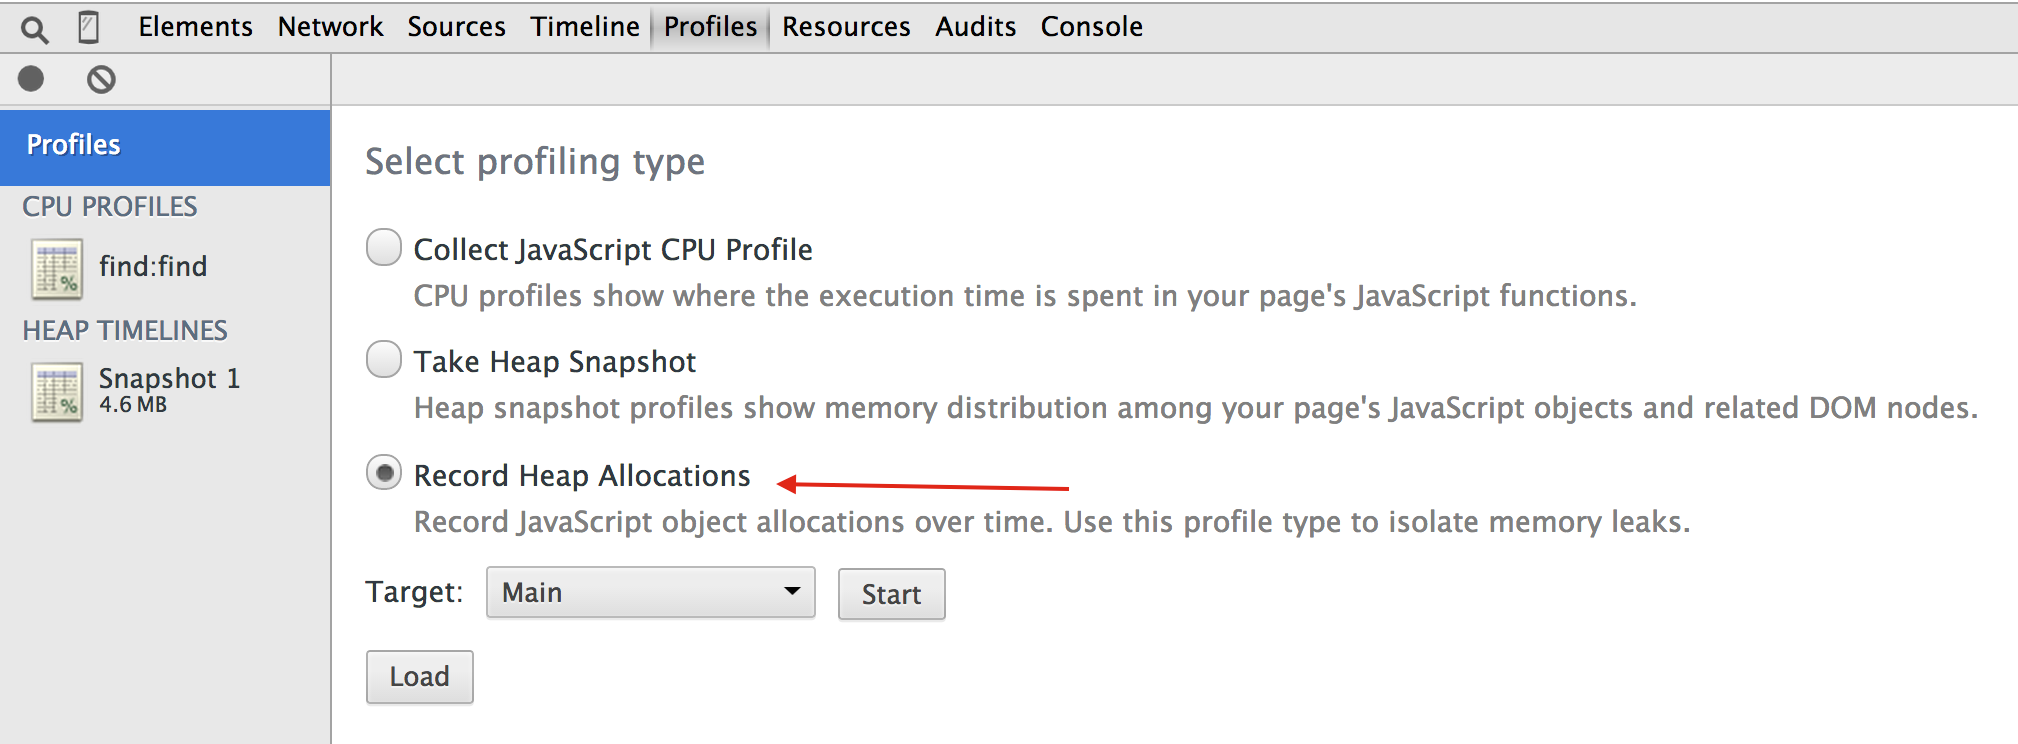
Now we can run heap profiler in DevTools instead of CPU profiler. I turn the profiler manually, then click "Find" button
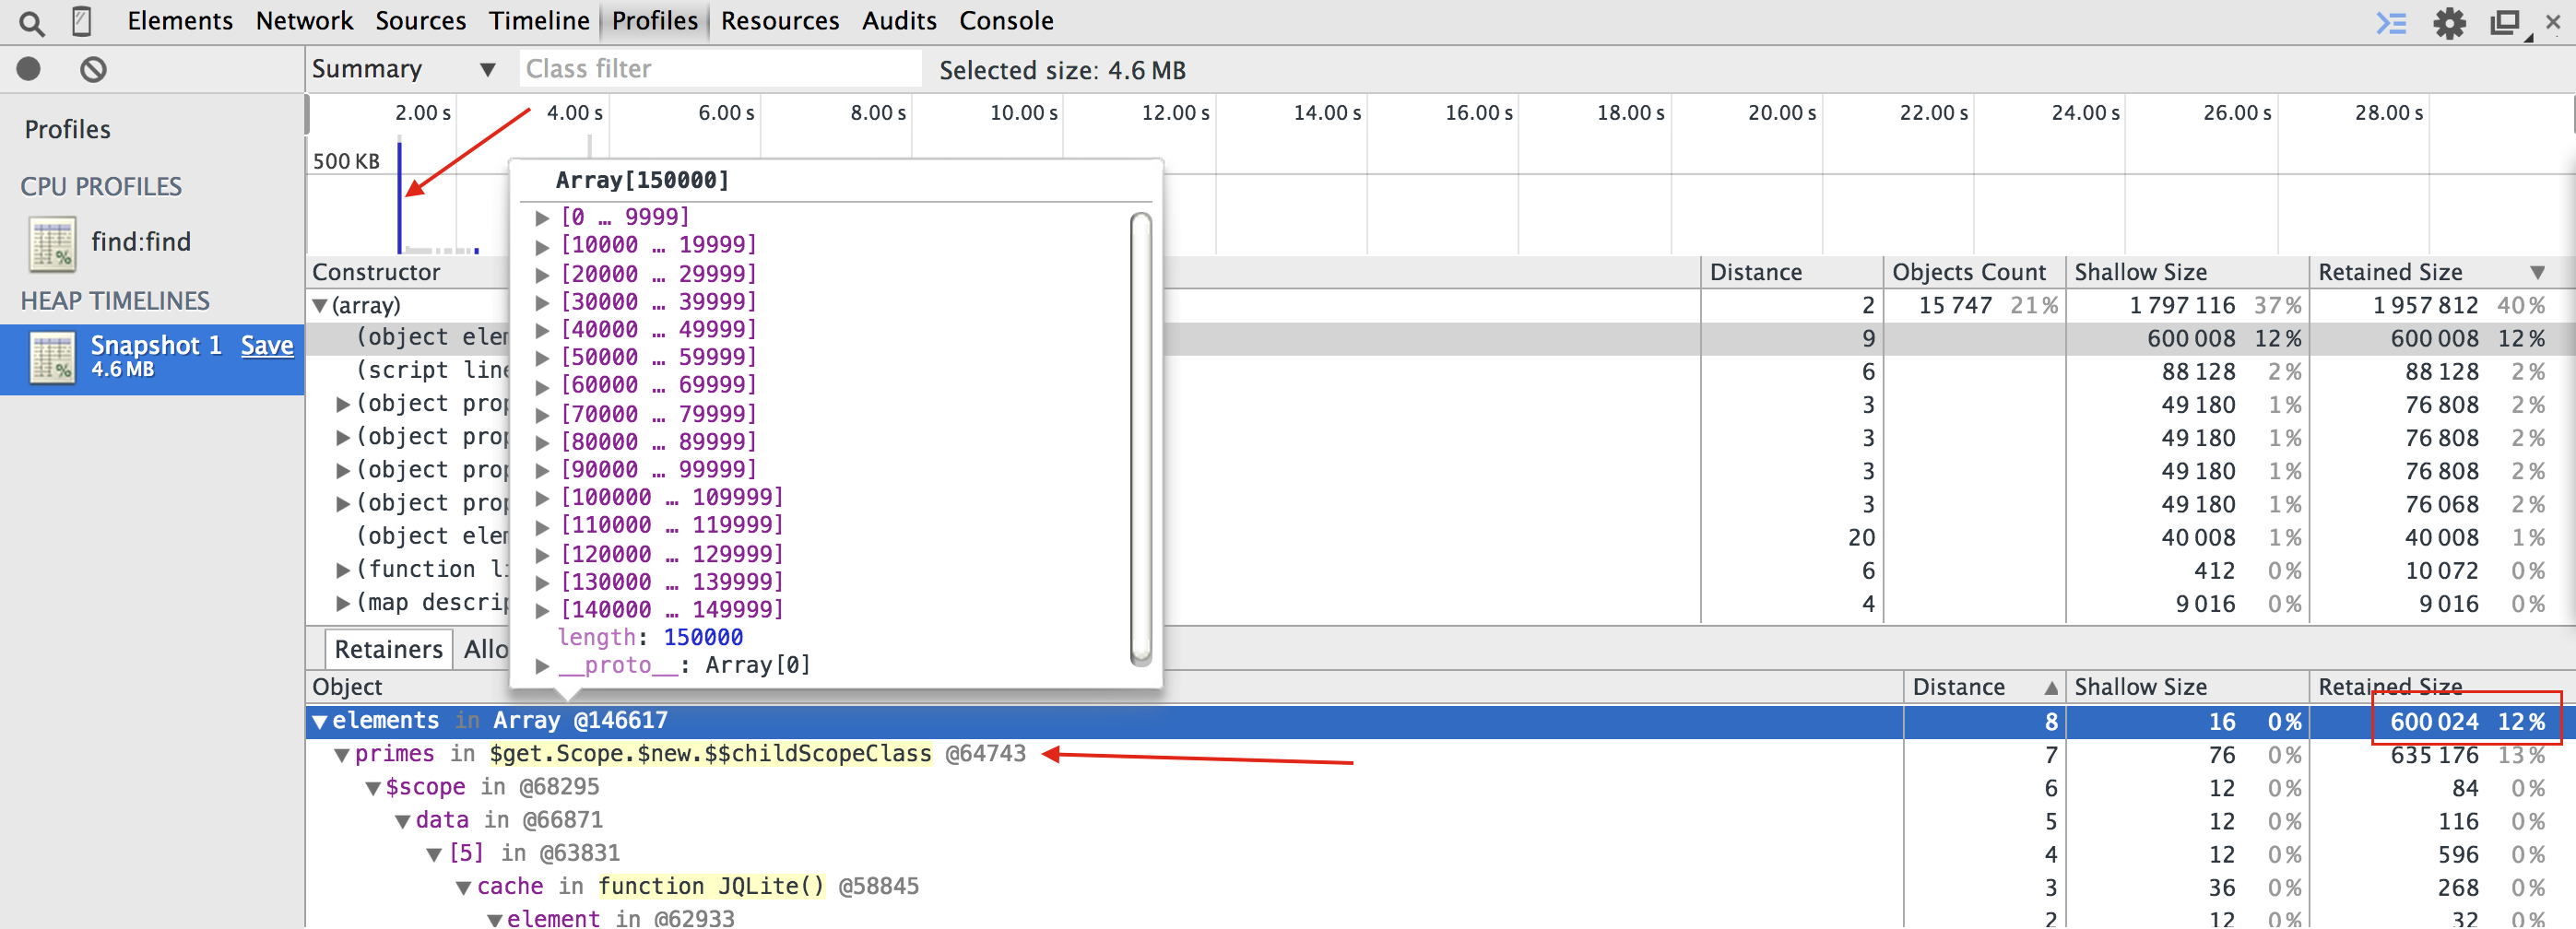
We can now see the large primes array allocated right at the beginning. Notice that we can hover
over it to see the final values. We can also notice that it contains 150k items, and its total memory
size is 600,008 bytes. V8 engine notices that we only are pushing integers into this array, and it
only uses 4 bytes per item. Arrays also have length property, that is extra 8 bytes.
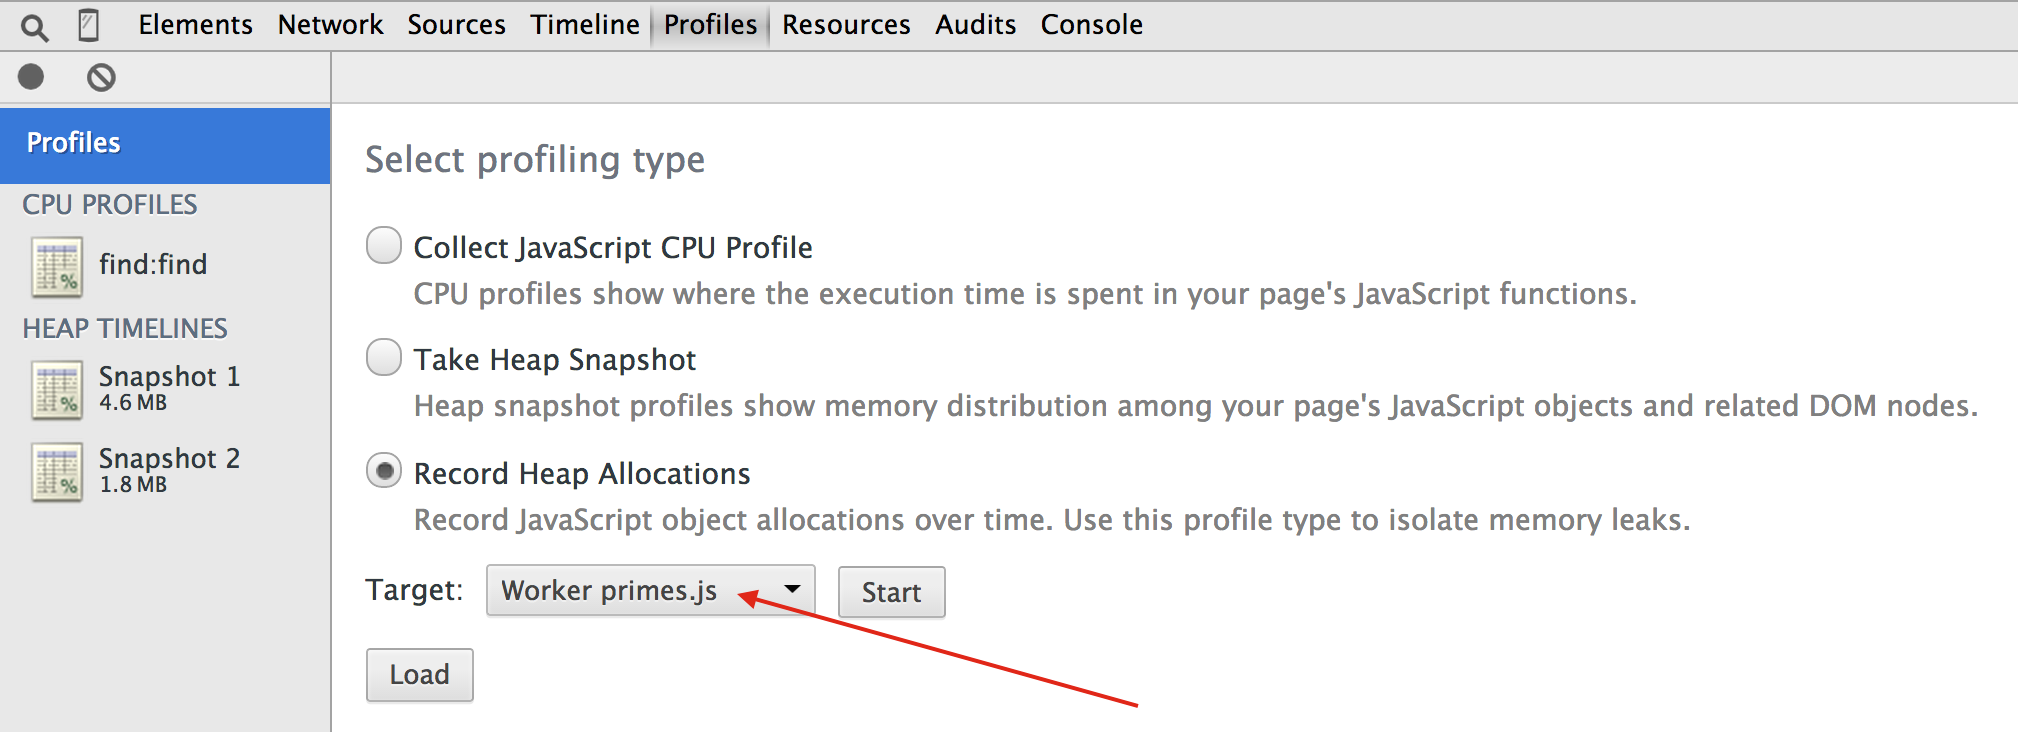
This profile gives us a picture of the heap allocation from the main code, but it does NOT show memory allocations in the web worker. To see where we are "leaking" memory in the web worker, select "primes.js" target below the heap profile radio button.
The collected web worker heap profile is much shorter, because its sandbox environment is much more limited.
We can clearly see the growing memory allocations. We can again hover and find the foundPrimes array.
We can hover over the array, and we can also hover over the code to see the function allocating it.
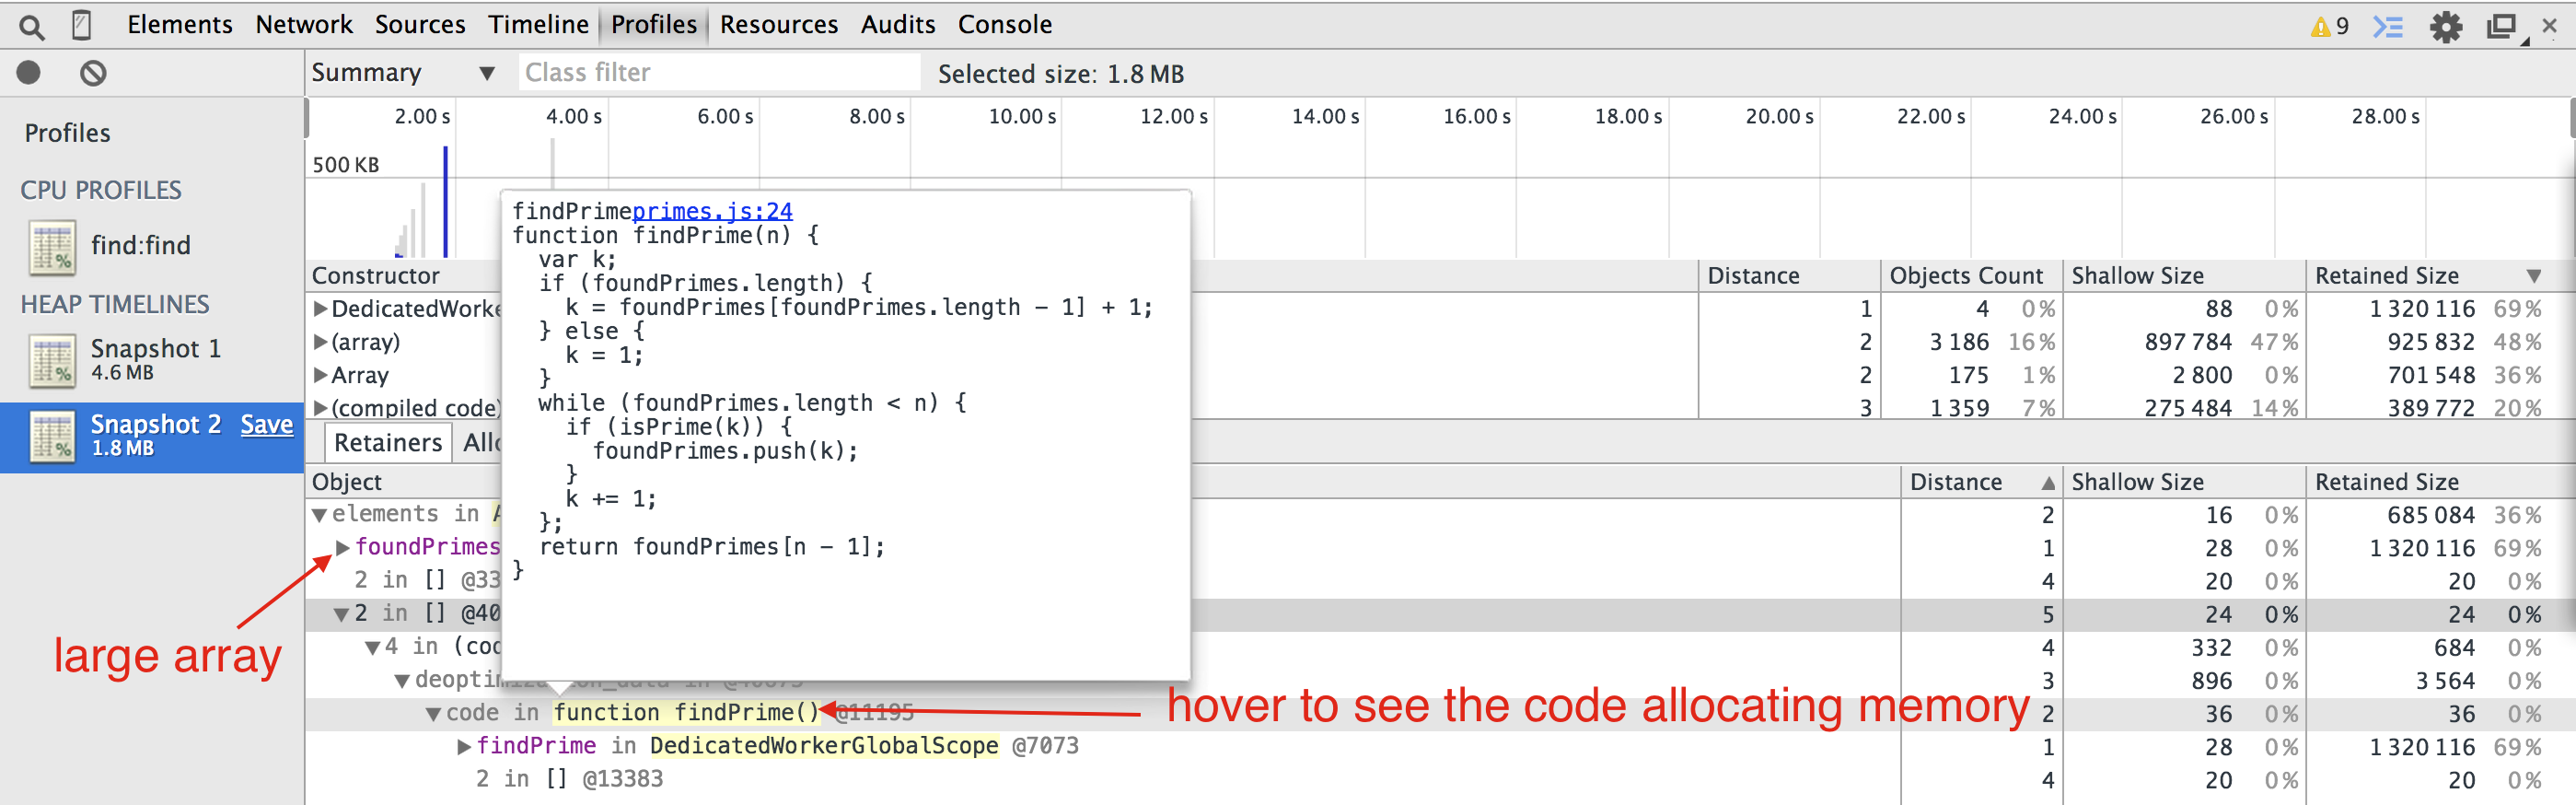
We can now preallocate a large foundPrimes array to avoid dynamic growing and garbage collection.
On-demand computation
Let us change the way the application generates data. Instead of pre-computing thousands of prime numbers, let us generate a small batch of numbers and render a table. If the user scrolls to the bottom of the table, looking for more numbers, we will generate more numbers and append them to the DOM. We can easily enable on scroll generation using ngInfiniteScroll directive. I used ngInfiniteScroll before to show lots of fake data. We need to include jQuery and infinite scroll script
<script src="bower_components/jquery/dist/jquery.min.js"></script>
<script src="bower_components/angular/angular.js"></script>
<script src="bower_components/ngInfiniteScroll/build/ng-infinite-scroll.min.js"></script>
For simplicity, I will switch to using ng-repeat again. We will run $scope.find method
whenever the table's body approaches the bottom of the window client area. We will force
first $scope.find execution on start using infinite-scroll-immediate-check attribute.
1 | <table id="table" width="500"> |
I removed manual table rendering code, leaving only number computation (still through a separate web worker)
1 | $scope.find = function () { |
The page now shows first 100 numbers right away. If I scroll to the bottom, the new numbers are computed and appended to the page. The generation is fast enough to not generate a pause during scrolling. I can see the 3 spikes in the timeline when generating first 400 numbers (the first 100 numbers are generated before I start the profiling).
The code is at the tag step-13.
Minimize objects returned from watchers
Another non-obvious source of slow performance specific to AngularJS are values returned from watcher functions. Each watched expression could be an expression against the scope object, or a function returning a value. The two watchers in the code below are equivalent.
1 | angular.module('Primes', []) |
AngularJs does dirty checking - during each digest cycle, every watcher function is evaluated, and the returned value is compared against the last known value. This means that the last known value is stored with the watcher function. If you watch using deep equality (inspect the returned value, rather than just compare reference), then angular has to deep copy the value returned by the watcher to store it. This could be very expensive. For example an array with objects:
1 | $scope.n = 10000; |
The code is at the tag step-14.
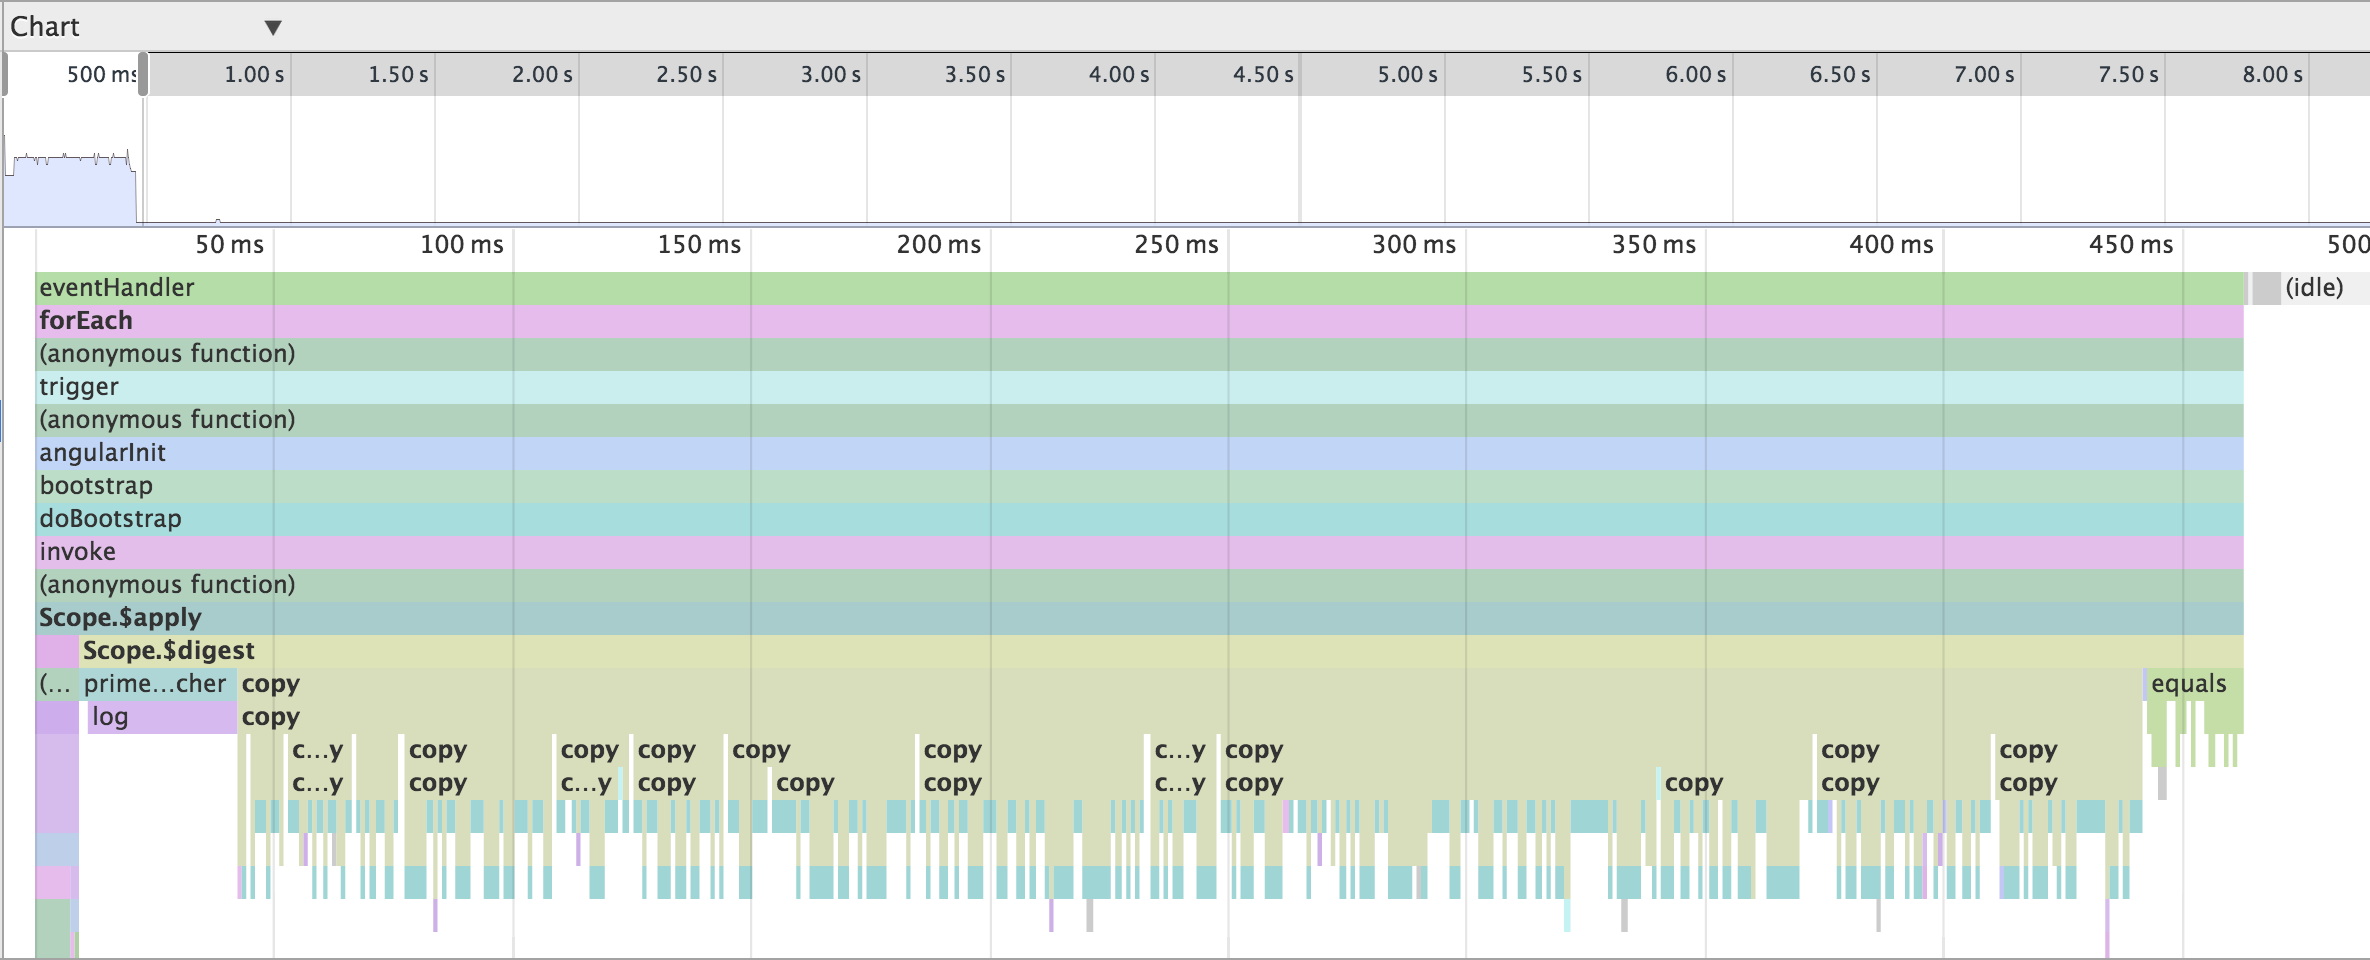
Initial application load is delayed by 500ms because the object returned from primesWatcher is
copied for future comparisons. The application will pay the same penalty whenever the primes object
changes and the new value needs to be stored in the watcher for next comparison.
An important note: deep copy takes a LOT longer than deep equality comparison. Thus the performance delay it introduces is not applied during idle digests, but only when something has changed. In practice this means sluggish response to the user's input when the watcher's result is copied.
Several suggestions to fight expensive deep copying in watchers
- Prefer reference comparisons to deep equality in watchers (3rd boolean parameter)
- Reuse single watcher for multiple actions
For example:
1 | // instead of individual actions for same watcher |
- Use your own logic to compute
dirtystate
The primes object changes every time we add a found prime number to it
1 | .controller('primesController', function ($scope) { |
Here I am using a counter to make sure watcher always fires new value when things have changed. If I just returned a boolean value, the digest cycle would not see the change, since it is the difference with last value that matters, not the actual value returned by the watcher function.
Conclusions and further readings
Improving any application's performance is an iterative process.
- Profile to identify true bottleneck
- Remove the bottleneck
- Repeat steps 1-2
I find it useful to remove the longest running bottleneck first, before looking at the other potential problems. First, removing the slowest code makes the greatest impact. Second, its removal might change the order of the other bottlenecks.
Usually, my application's JavaScript code has an obvious initial bottleneck. Once the client code has been optimized, I turn to profiling and optimizing Angular's features, mostly by removing unnecessary work the engine does often. After this, I turn my attention to code execution vs browser rendering, hoping to split larger blocks of work into small batches.
Successful performance optimization requires knowledge of the JavaScript language,
runtime engine optimizations, browser rendering pipeline and your application's framework's specifics.
Most importantly it requires matching the application's performance profile to your user's expectations
and use cases. Angular has certain performance bottlenecks, like dirty checking during the digest
cycle. Still, it is very flexible framework, as you can see from the above examples. I have been
able to rip parts of the pipeline, replace steps, rearrange units of work, yet it is still an Angular
application. It used only very simple services ($q, $timeout, ng-repeat)
and basic building blocks (controller, factory). We could improve the performance of specific parts of the
application without sacrificing its flexibility and simplicity.
For more information, read these articles
- Profiling JavaScript Performance
- Optimization killers and Performance Tips for JavaScript in V8
- AngularJS Performance Tuning for Long Lists
- Speeding up AngularJS apps with simple optimizations
- Removing the Unneeded Watches
- Solution to ng-repeat performance problem
- Memory Management Masterclass with Addy Osmani
Update 1
I have explored additional methods to improve Angular application's performance. See separate blog posts on:
- Limiting the digest cycle to run on a particular scope and its children.
- Running digest cycle in web worker.
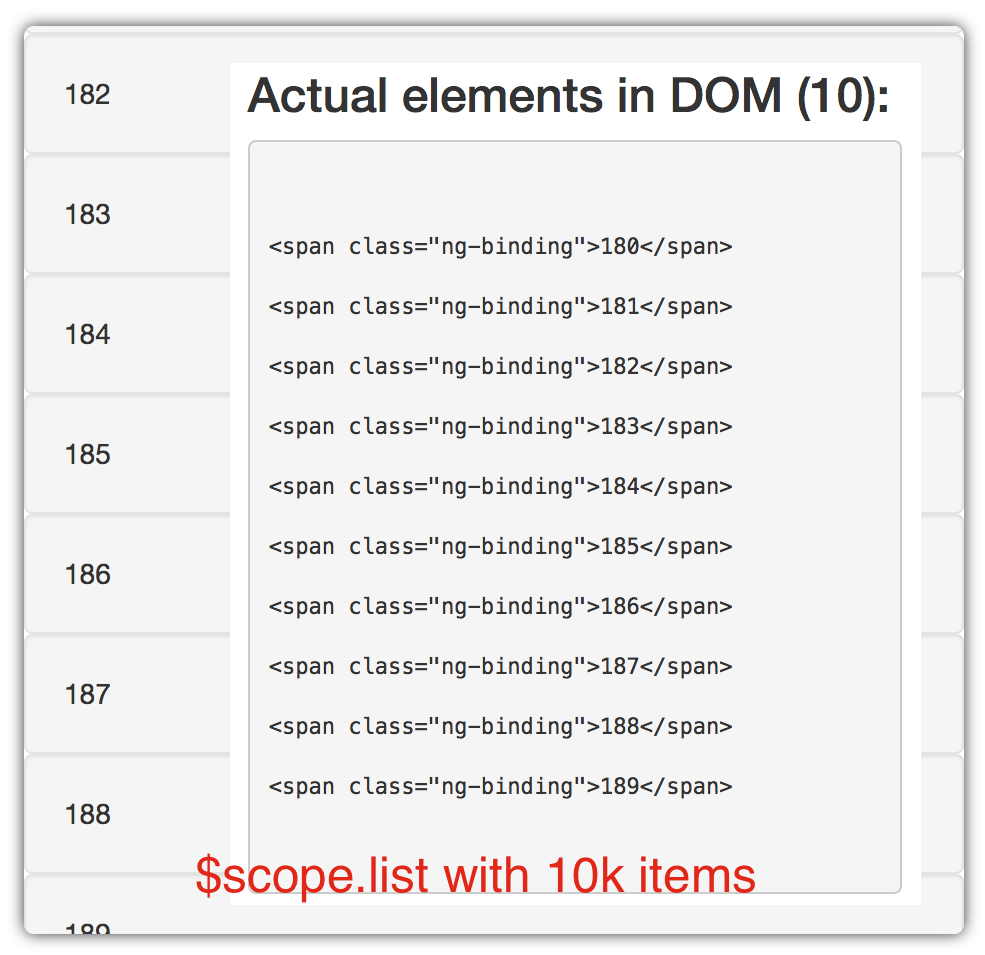
- Keep only visible DOM elements in the scrollable container using angular-vs-repeat. Even if the list attached to the scope is huge, this directive only keeps visible DOM elements in the document, speeding up the initial rendering and scroll tremendously. Also works nicely with bind-once directive.
Update 2
I have extended primes git repo with angular-vs-repeat feature, available under tag step-15 The scroll CPU profile shows very little activity, since only a few items are visible at a time
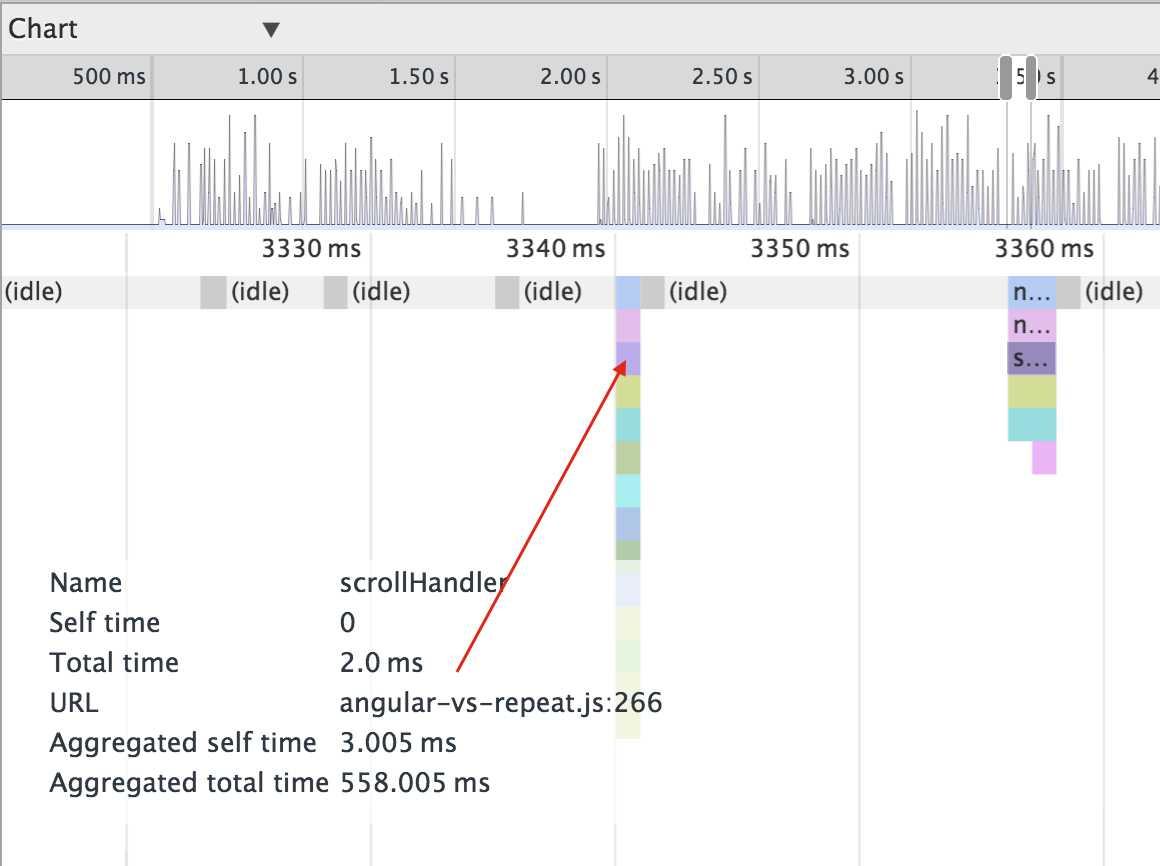
The timeline also shows very light load and high frames per second
Update 3
All previous steps have used AngularJS 1.2, with step-4 idle digest cycle taking 850ms. I tried
the same code using AngularJS 1.3.13 and the same code runs the digest cycle much faster - taking ony 250ms.
If you have not upgraded to 1.3, you should. You can find my upgrade code at step-16 -
compare it with the identical step-4 code.
Update 4
I compared setting ng-class properties myself for valid / invalid data vs using AngularJS form
validation (ng-valid, ng-invalid, etc. See forms page.) For every row in the primes
table I set class for a single cell (the found prime value).
1 | <td> |
The goal was to mark numbers larger than 10 as invalid. Each cell had an additional watch expression, total went up by 33% (from 30k to 40k watchers total). The digest cycle went up by 50% from 20ms to 30ms.
Then I tried the same logic using built-in validators.
1 | <td> |
I also had CSS class ng-valid and ng-invalid to replace small and large classes.
There were no more watchers and the idle digest cycle remained at 20ms, despite validating
the cell values.
If you need to style valid / invalid values, use the built-in AngularJS validation features,
instead of ng-class logic.