Recently I came across nth micro library. It adds a suffix to a number
1 | nth(1); // "1st" |
The library is very small - just a single function with a few lines of code. I wanted to check how fast it was, and if it could be made faster. Here are the steps that sped it up by a factor of 5x, and in a particular use case by a factor of 50x (using caching).
Initial performance
I grabbed the original source code and pasted into index.html.
1 | function nth(n) { |
To test it, I am computing 1 million
random numbers in the range from 1 to 1000, then calling nth on each number.
1 | var results; |
In order to accurately profile the JavaScript, I will use console.profile methods.
1 | console.profile('nth'); |
The initial function takes almost 1 second to process 1 million numbers.
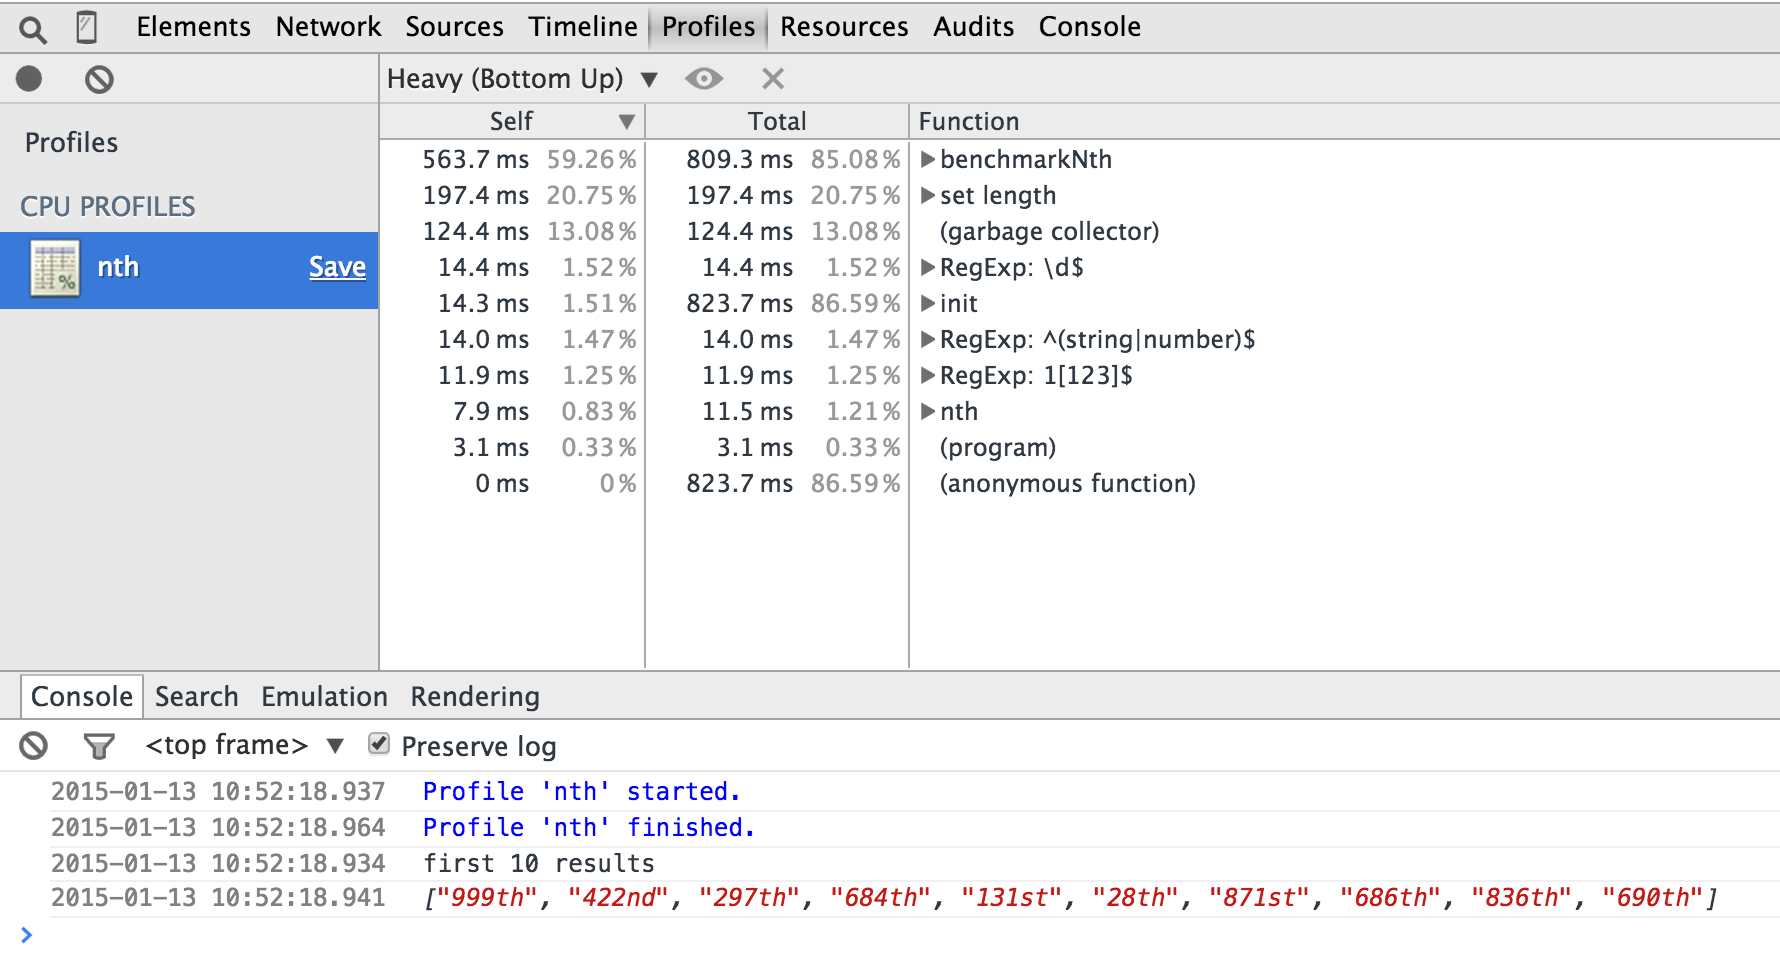
Profile individual functions
Chrome profiler does not show which statements are bottlenecks - it works at the function level. Thus I need to refactor the code to find the actual bottleneck.
1 | function isStringOrNumber(x) { |
This is the same logic as the original function, but now Chrome profiler can show which parts take longer.
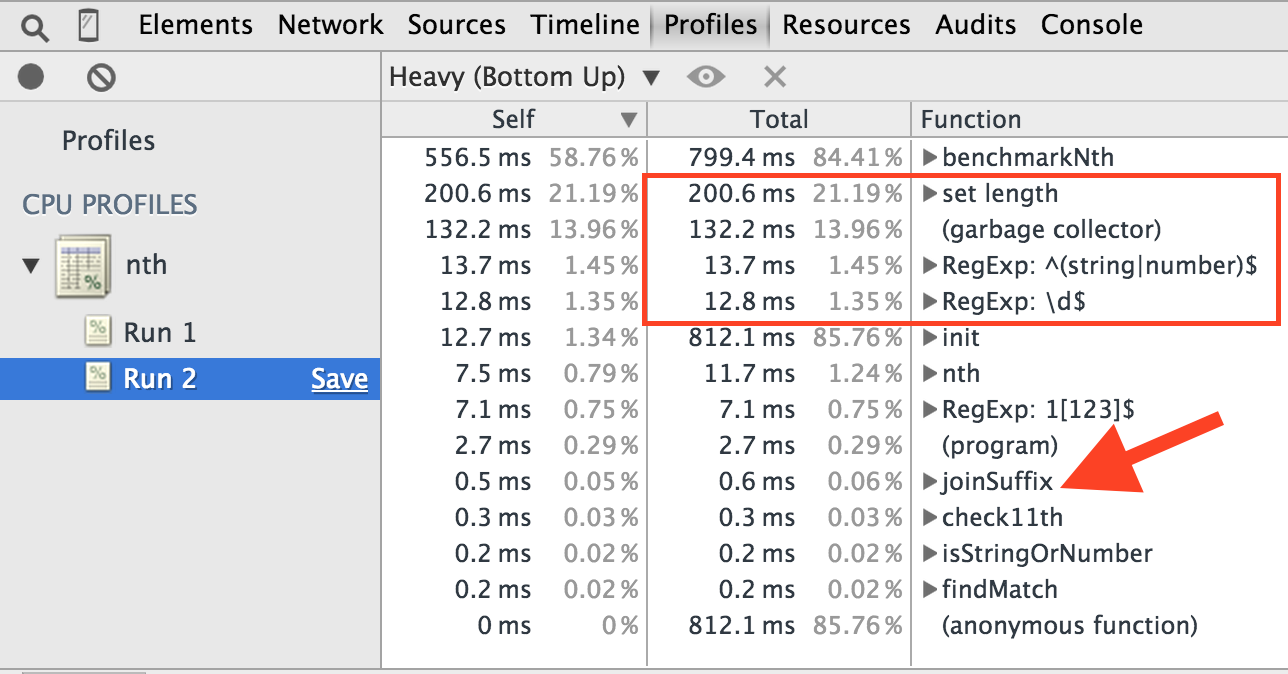
Hmm, all bottlenecks are native functions (red rectangle). None of my little functions are taking too long.
Confirm function optimization
Chrome profiler does not show any obvious bottlenecks in this code. I wanted to see if any of my functions has not been
optimized by the v8 engine. I showed how to check function's status in
Detecting function optimizations in V8. I copied the nth source code into index.js
and used v8-natives module to profile and query function's optimization status.
1 | // index.js |
I need to run node using a special flag to allow native syntax query
$ node --allow-natives-syntax index.js
each call to nth took 512.916498 nanoseconds
Function nth is optimized
Function isStringOrNumber is optimized
Function findMatch is optimized
Function joinSuffix is optimized
Function check11th is optimized
Every function has been optimized, so nothing is obviously slow. Where is the bottleneck?
Solving the bottleneck
I went back to the Chrome profile results. Where is the call set length coming from?
We do not get length of a string or an Array anywhere in our code. I also wanted to know
why the garbage collector runs so often. Seems we are creating a lot of objects somewhere.
Inspecting the tree view in the profile, I noticed that set length seems to be called from joinSuffix
function.
1 | function joinSuffix(n, suffix) { |
This is a red flag - we are using a tiny array to concatenate a number and a string. Imagine what the JavaScript engine has to do in this case:
- creates a new array
- places a number
ninto the first position - places a string
suffixinto the second position - calls
Array.prototype.joinand returns string result
Let us change this function to use regular string concatenation
1 | function joinSuffix(n, suffix) { |
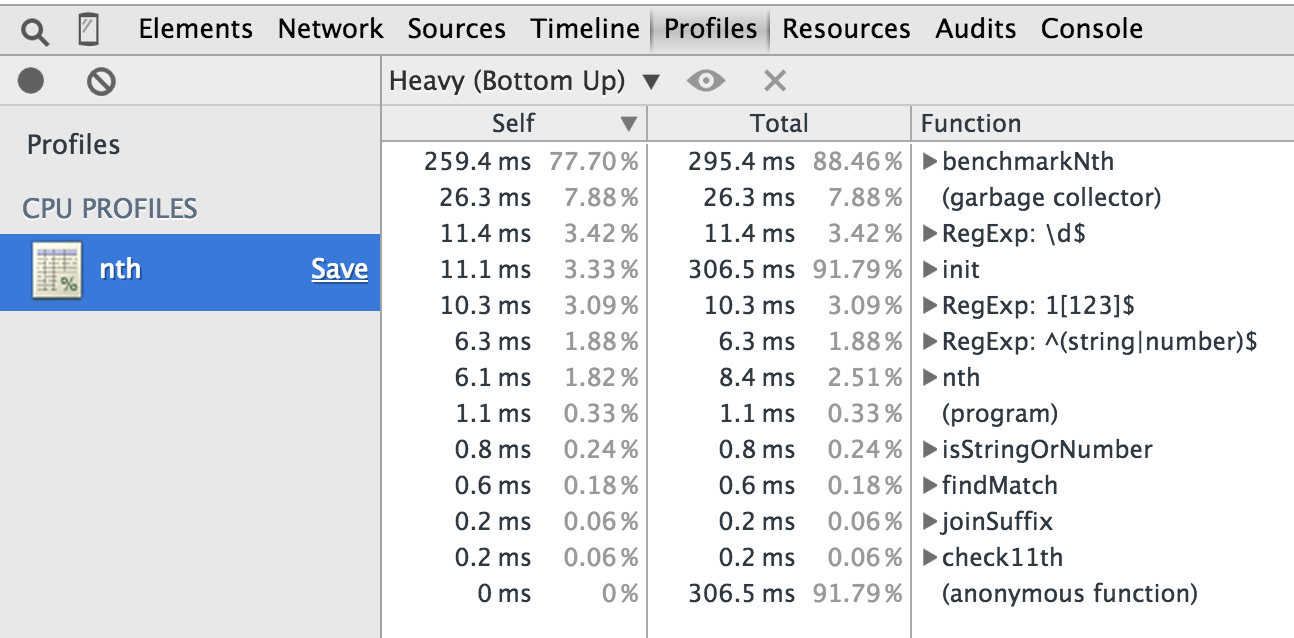
The performance has improved dramatically
Application-specific optimization
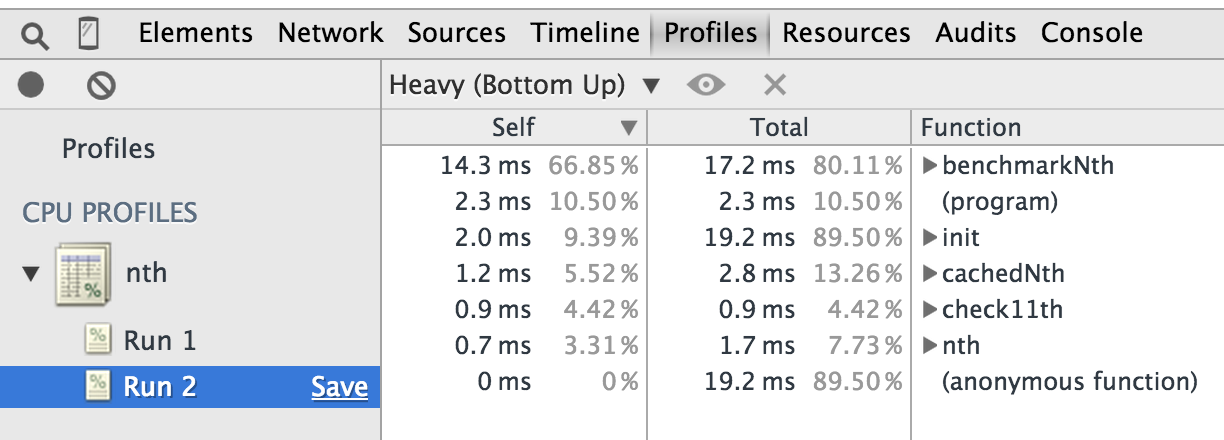
While we can profile and improve each individual function, this application has its specific obvious optimization to make. We are computing suffix for 1 million numbers limited to 1000 range. Thus we can cache the computed results once and avoid the multiple computation.
1 | var cache = new Array(1000); |
This optimization leads to the most dramatic improvement
Conclusion
It is important to accurately profile the JavaScript code before making any optimizations. In some cases the true bottleneck is non-obvious and requires inspecting the source code for potentially expensive operations that are still optimized by v8 engine. While micro-optimizations are important, one can get large performance gains by using the application-specific shortcuts.