Nobody likes slow tests. Understanding why the tests are slow should start with the measurement. The initial guess of the slow part is often wrong. I have shown such investigation that uncovered a surprising source of slowness in the blog post Where Does the Test Spend Its Time?.
In this blog post I want to show a little plugin cypress-timings you can add to your Cypress tests. The plugin needs to be loaded from your support file:
1 | import { commandTimings } from 'cypress-timings' |
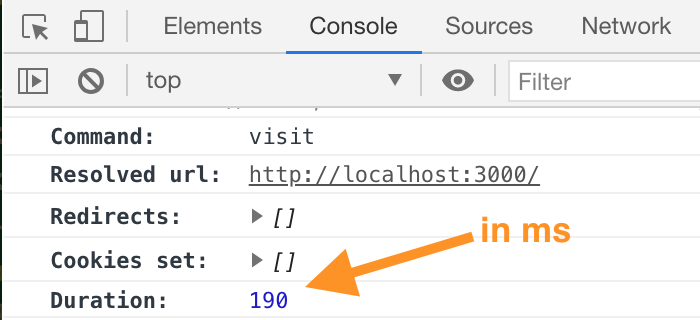
Whenever you now click on the command, in addition to the regular command properties, you will also see Duration: X printed to the console. The value is in milliseconds.
Let's see the plugin in action. You can find the source code in the repository testing-workshop-cypress under branch command-timings. Our example test adds several todos and confirms the number of list items.
1 | beforeEach(function visitSite() { |
Once the test finishes, open the DevTools console and click on a command. You will see how long that command took to execute.
Important: the timings shown are NOT the precise command measurements. Instead we grab the elapsed time between log:added and log:changed log events. In the future I hope to make these numbers accurate, follow the issue #9263.
See also
- The blog post Where Does the Test Spend Its Time?
- The recipe CSV load and table test shows how to use test timing to find the fastest way to validate the table on the page