Developers use data visualization as a tool to express the insight into the data. We usually target the outside audience by creating tools that allow others to analyze the data. There are also visualizations of software artifacts, like code complexity graphs created by the Plato tool.
Yet, we do not use data visualization tools during one of our primary work activities - debugging web applications. What if we could inspect variables not by printing them to the browser console, but instead by plotting and interacting with them? What if we could do this right inside the browser without going to external website or using another tool? What if we could plot data during debugging right inside the Chrome DevTools?
d3-panel
I wrote Chrome browser extension d3-panel. It creates a new tab in DevTools, and allows
you to send data directly from the browser console to plot and interact. For example, if my main page
has a variable foo, I can send it to d3-panel to be plotted using a bar chart.
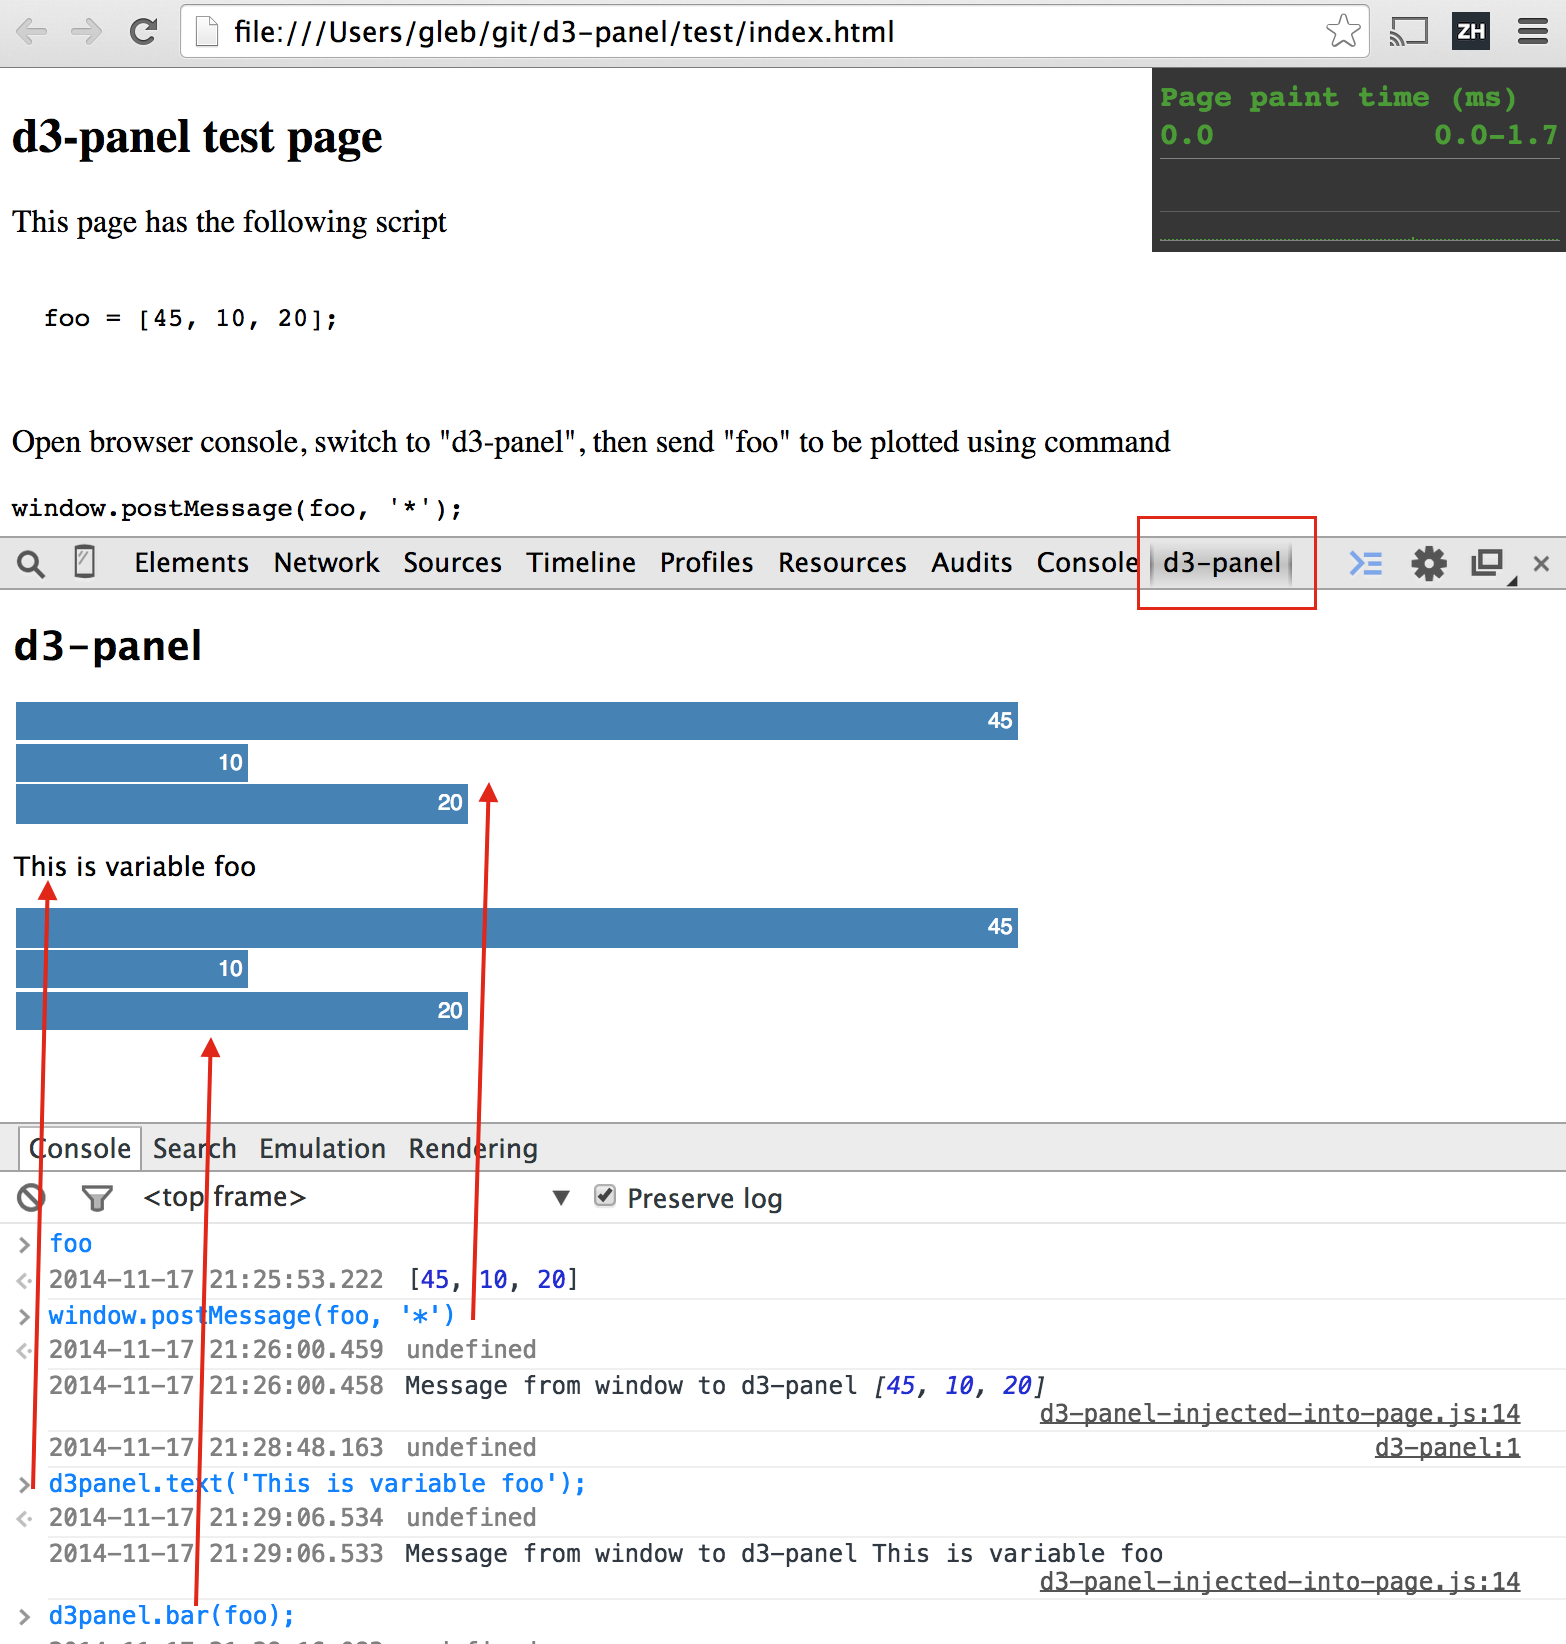
We can send data directly and let the d3-panel script figure out how to best plot it.
Or we can use the included code snippet to create light weight API to better control
the plot. For example to plot variable foo and then append a text message in the panel we
can execute
d3panel.bar(foo);
d3panel.text('this is variable foo');
Each new chart is appended to the bottom of the panel, you can use command d3panel.clear(); to
remove everything.
I plan to investigate and find chart types useful during debugging my web applications. The Chrome extension itself will be published soon to the Google Web Store.