- Instrument code using Parcel
- Saving coverage information
- Sending report to coveralls.io
- More information
In my previous blog post "Code Coverage for End-to-end Tests" I have instrumented application source code and collected code coverage during end-to-end tests. This helped guide the end-to-end tests to cover edge cases and discover a logical error in the browser battery api demo. In this post I will show how you can instrument the application source code on the fly without using a separate build step. I will also show how to use a new NPM module cypress-istanbul to collect and save code coverage information no matter how the code was instrumented. Finally, I will show how to send the collected coverage information to 3rd party dashboard such as coveralls.io.
You can find the source code in the branch "bundle" of the repo bahmutov/demo-battery-api and you can see the code coverage reports at coveralls.io/github/bahmutov/demo-battery-api.
Instrument code using Parcel
The demo application has index.html with the entry script tag <script src="src/index.js" async></script>. That script src/index.js includes 2 other utility scripts:
1 | import { batteryStats } from './utils' |
I will serve the index.html using Parcel bundler.
1 | { |
Now, I have claimed in the past that "Parcel is awesome sauce", and the next example just proves it one more time. If we want to instrument the application JavaScript code, we can use babel-plugin-istanbul - Parcel will load and apply Babel plugins if you have .babelrc file!
1 | { |
We probably do not want to instrument the application code in every situation, only during testing. So more realistic configuration would be .babelrc with the "istanbul" plugin loaded only if we run the command with test environment like NODE_ENV=test parcel serve index.html:
1 | { |
Warning: the above conditional plugin loading is currently broken in Parcel v1.12.3, there is an open PR #2840 with a fix.
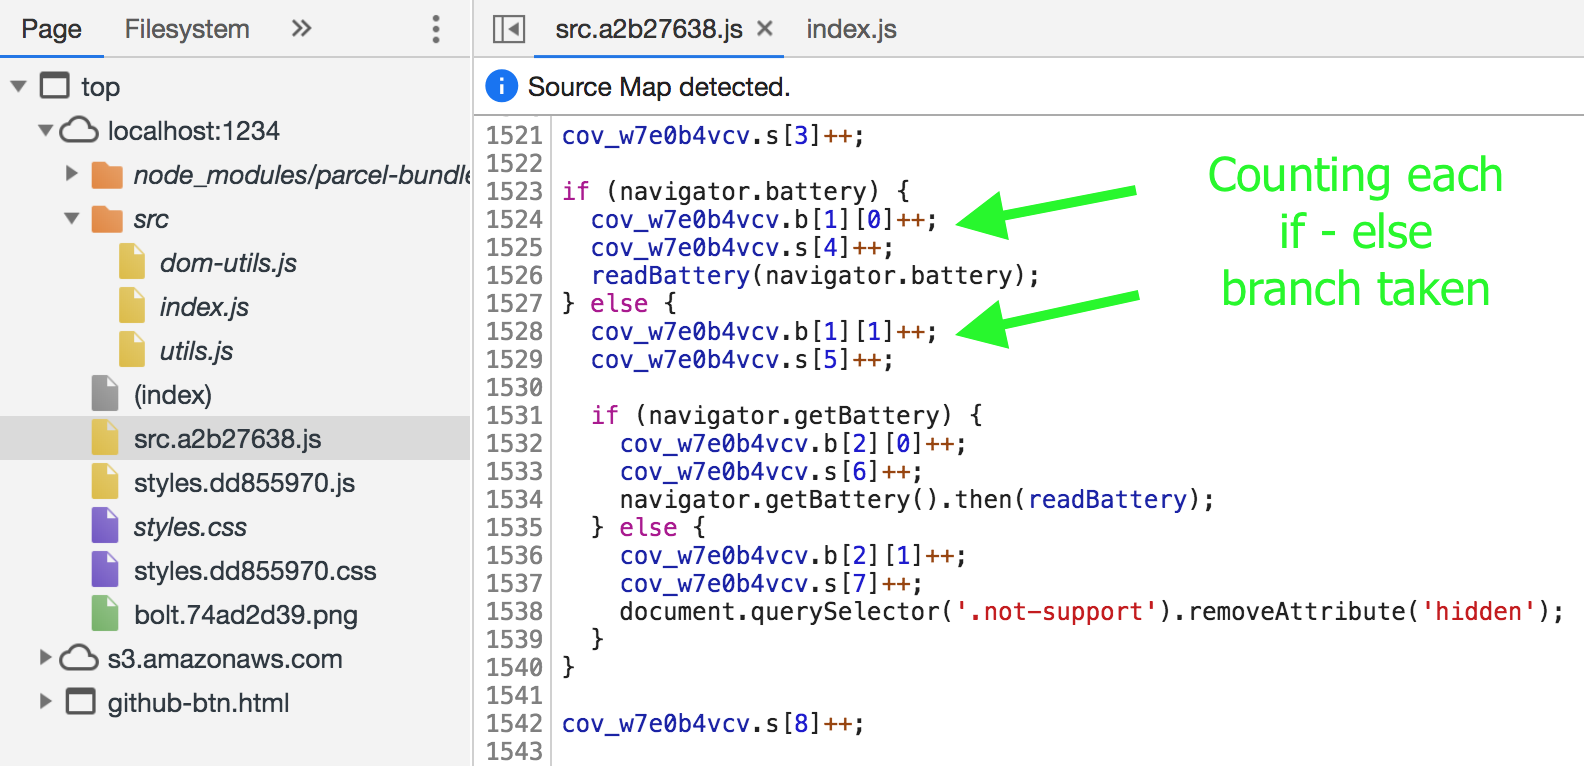
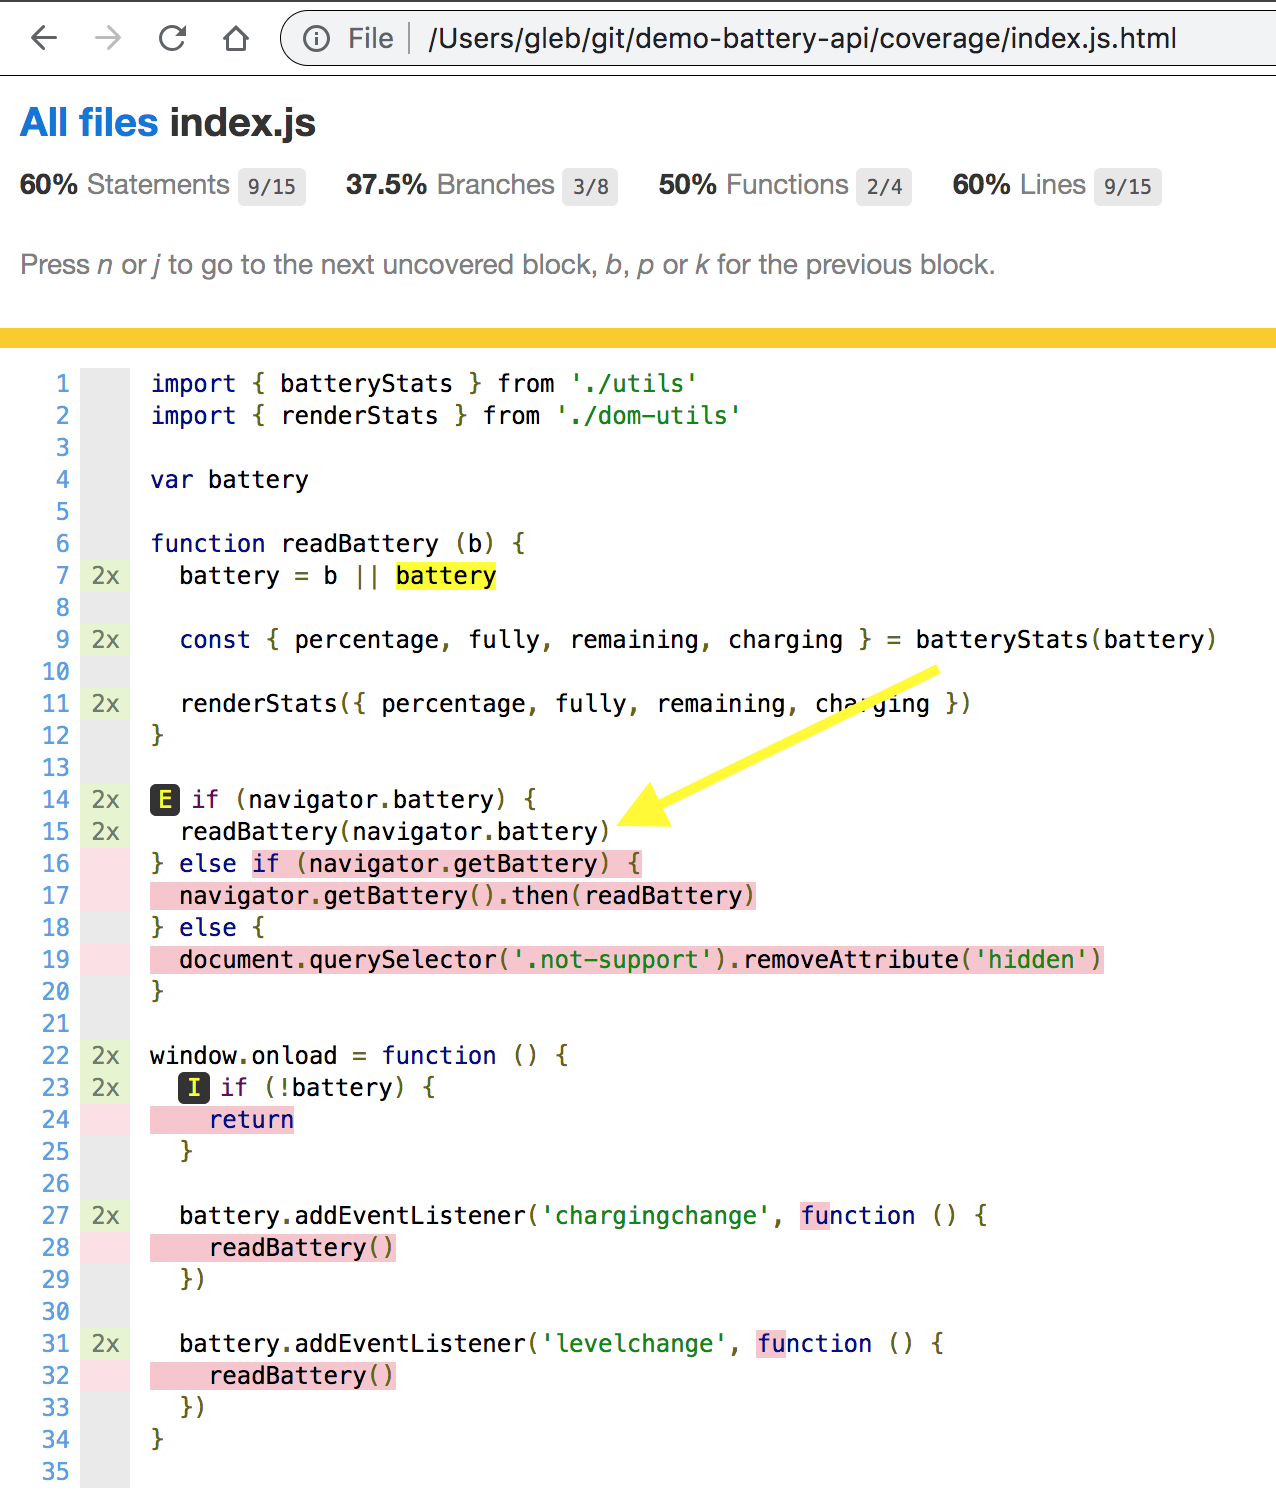
When we start the application and open "localhost:1234" we can see that index.js and the 2 files it has imported are bundled into a single resource - and the source has been instrumented to keep track how many times each statement, function and logical branch was executed.
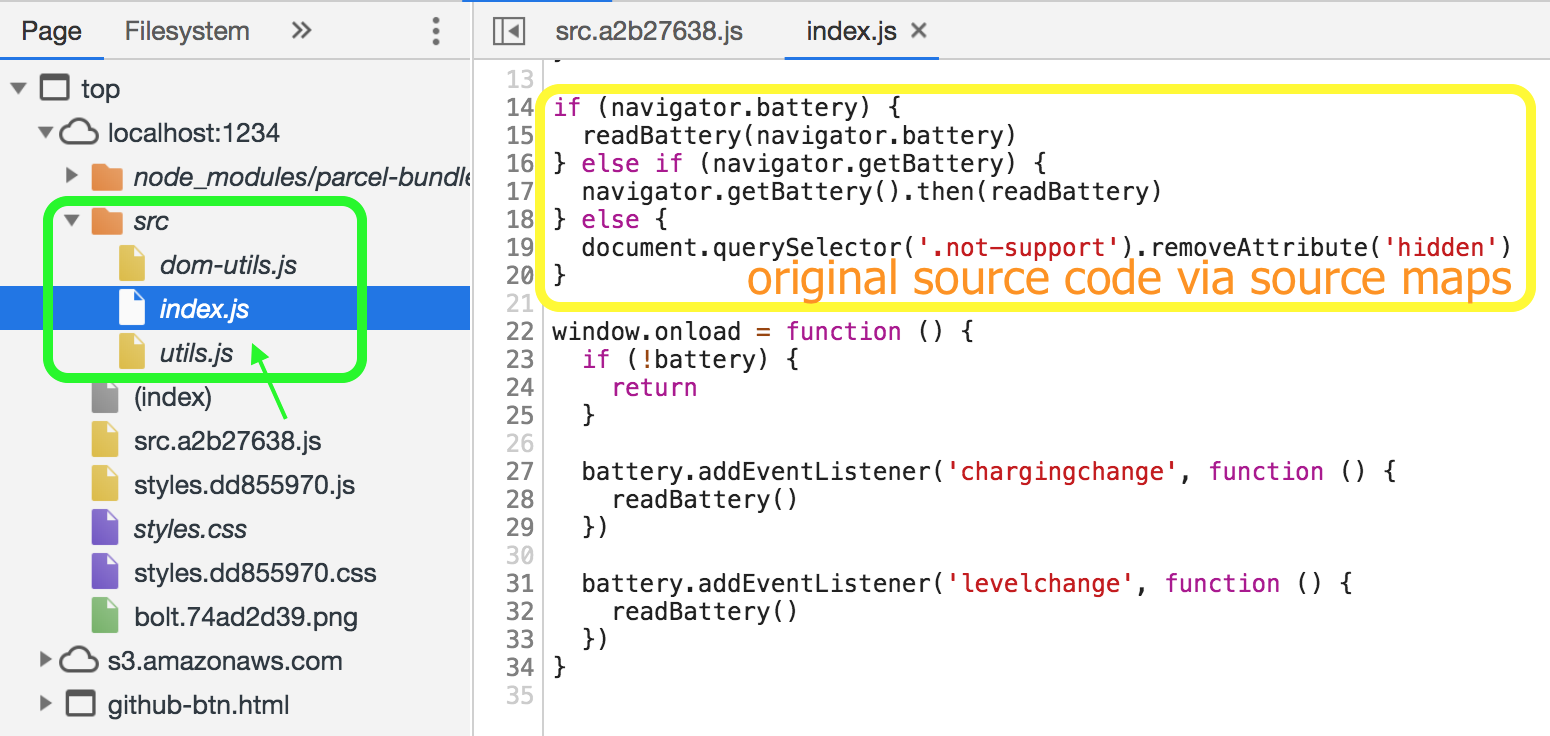
Parcel generates the source maps by default, and we can find the original, uninstrumented code in "src" folder
Super, zero effort on our part and we get coverage counters in the browser when the code runs - but how do we save that coverage object back to disk after the tests? And how do we generate reports?
Saving coverage information
Just like before we need to merge code coverage after each test to pain the complete picture. I have factored out the code into Cypress plugin called cypress-istanbul since it should be able to save code coverage as long as it is compatible with istanbuljs tool. Just install this plugin and its peer dependencies:
1 | npm install -D cypress-istanbul nyc istanbul-lib-coverage |
To load the plugin (it uses tasks) add to your cypress/plugins/index.js file the following
1 | module.exports = (on, config) => { |
and to your cypress/support/index.js the following line:
1 | import 'cypress-istanbul/support' |
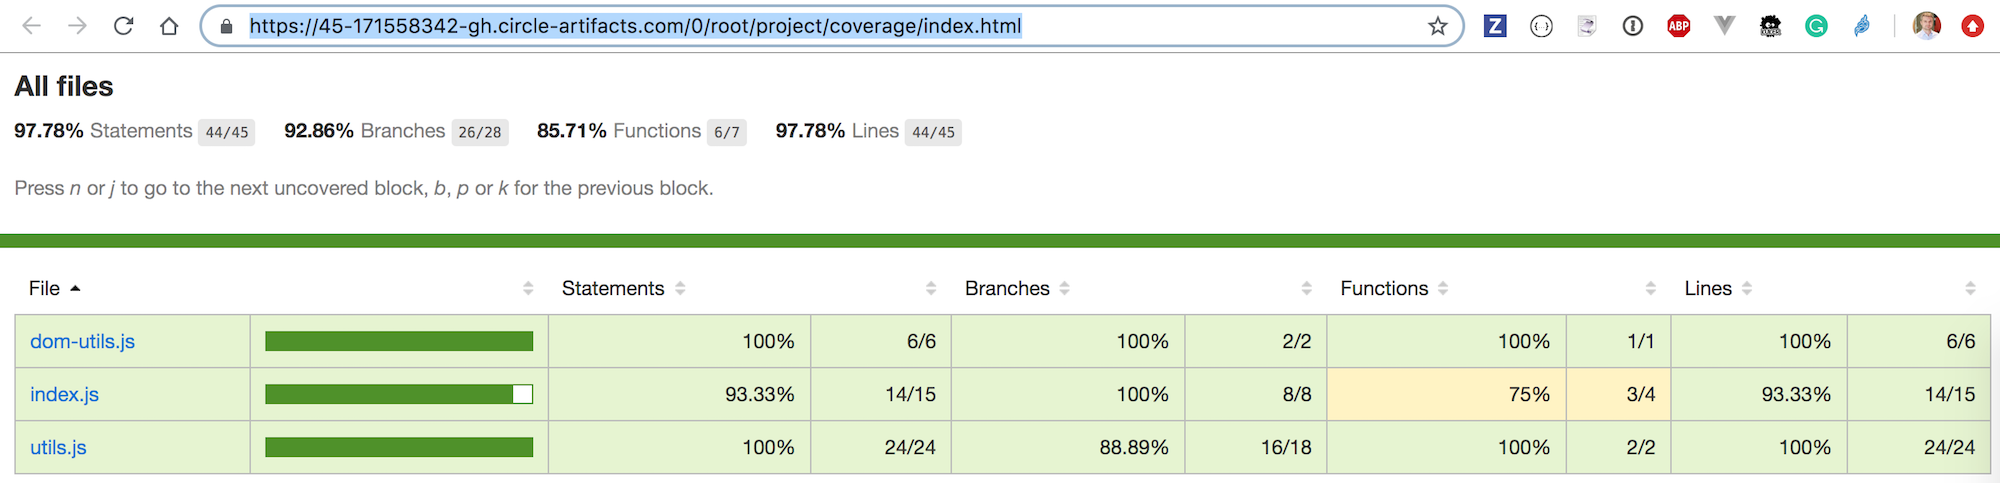
And that is it! Open Cypress, select a single spec, for example cypress/integration/battery.js which runs 2 end-to-end tests. You should see "After all" task that executes nyc report --reporter=html command to generate a friendly static report.
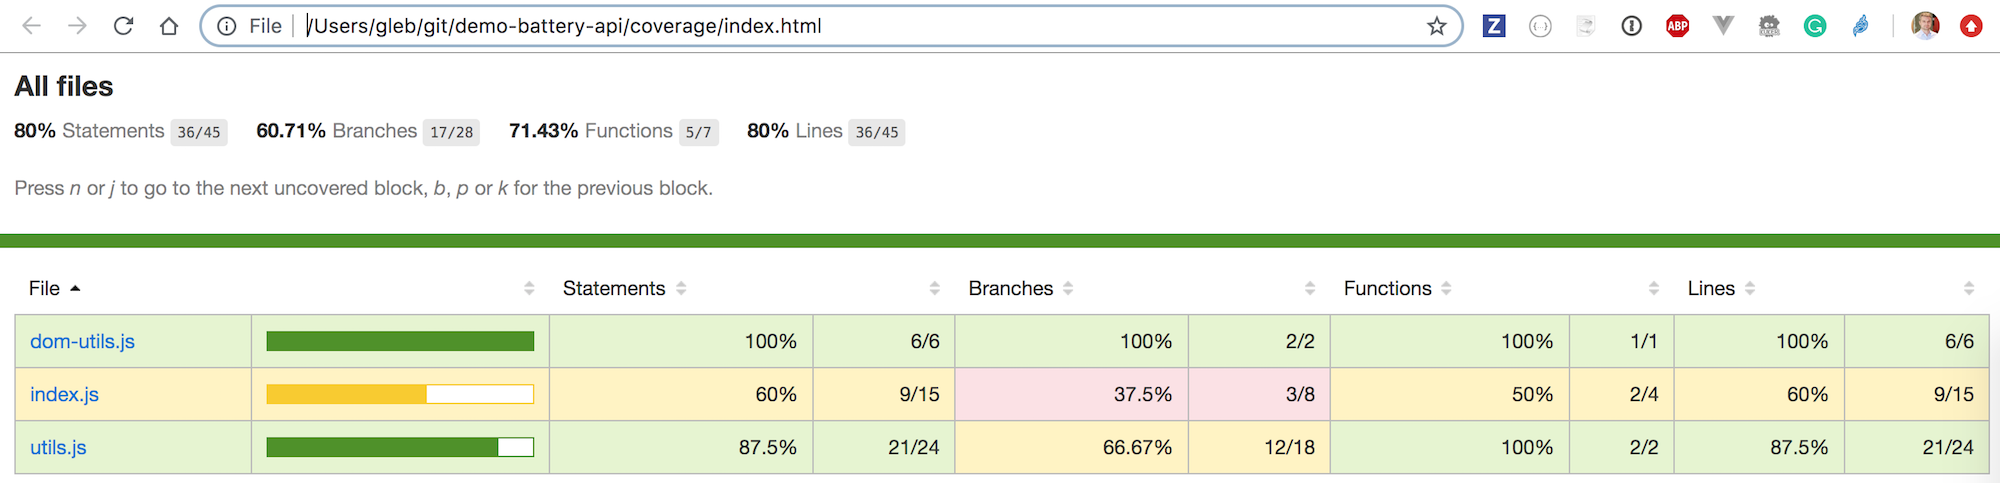
We can open the detailed view of index.js to see how the first code path readBattery(navigator.battery) was executed twice - because two tests both his this branch path.
Sending report to coveralls.io
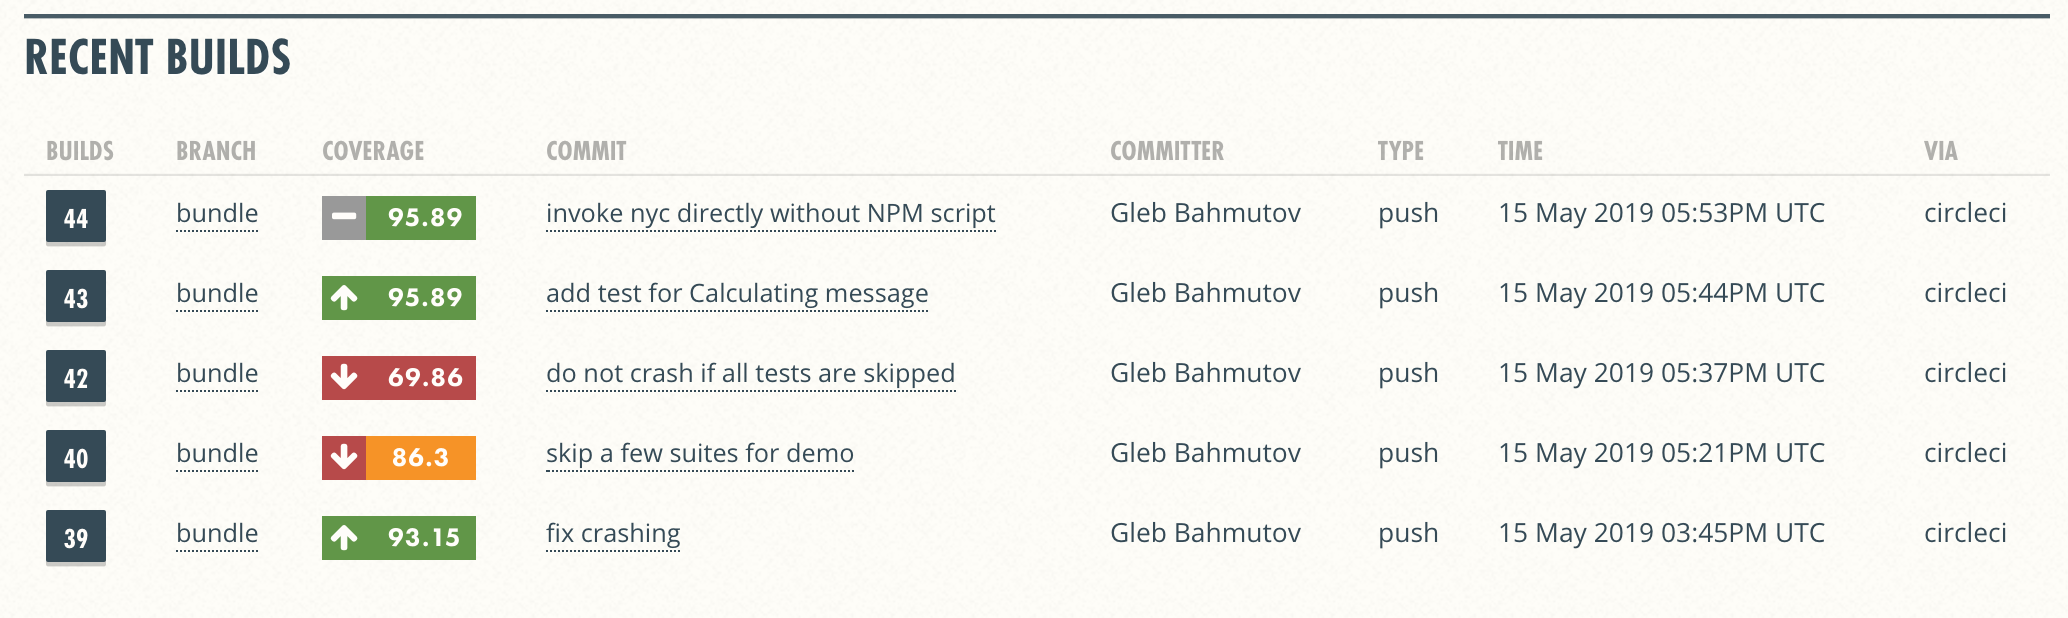
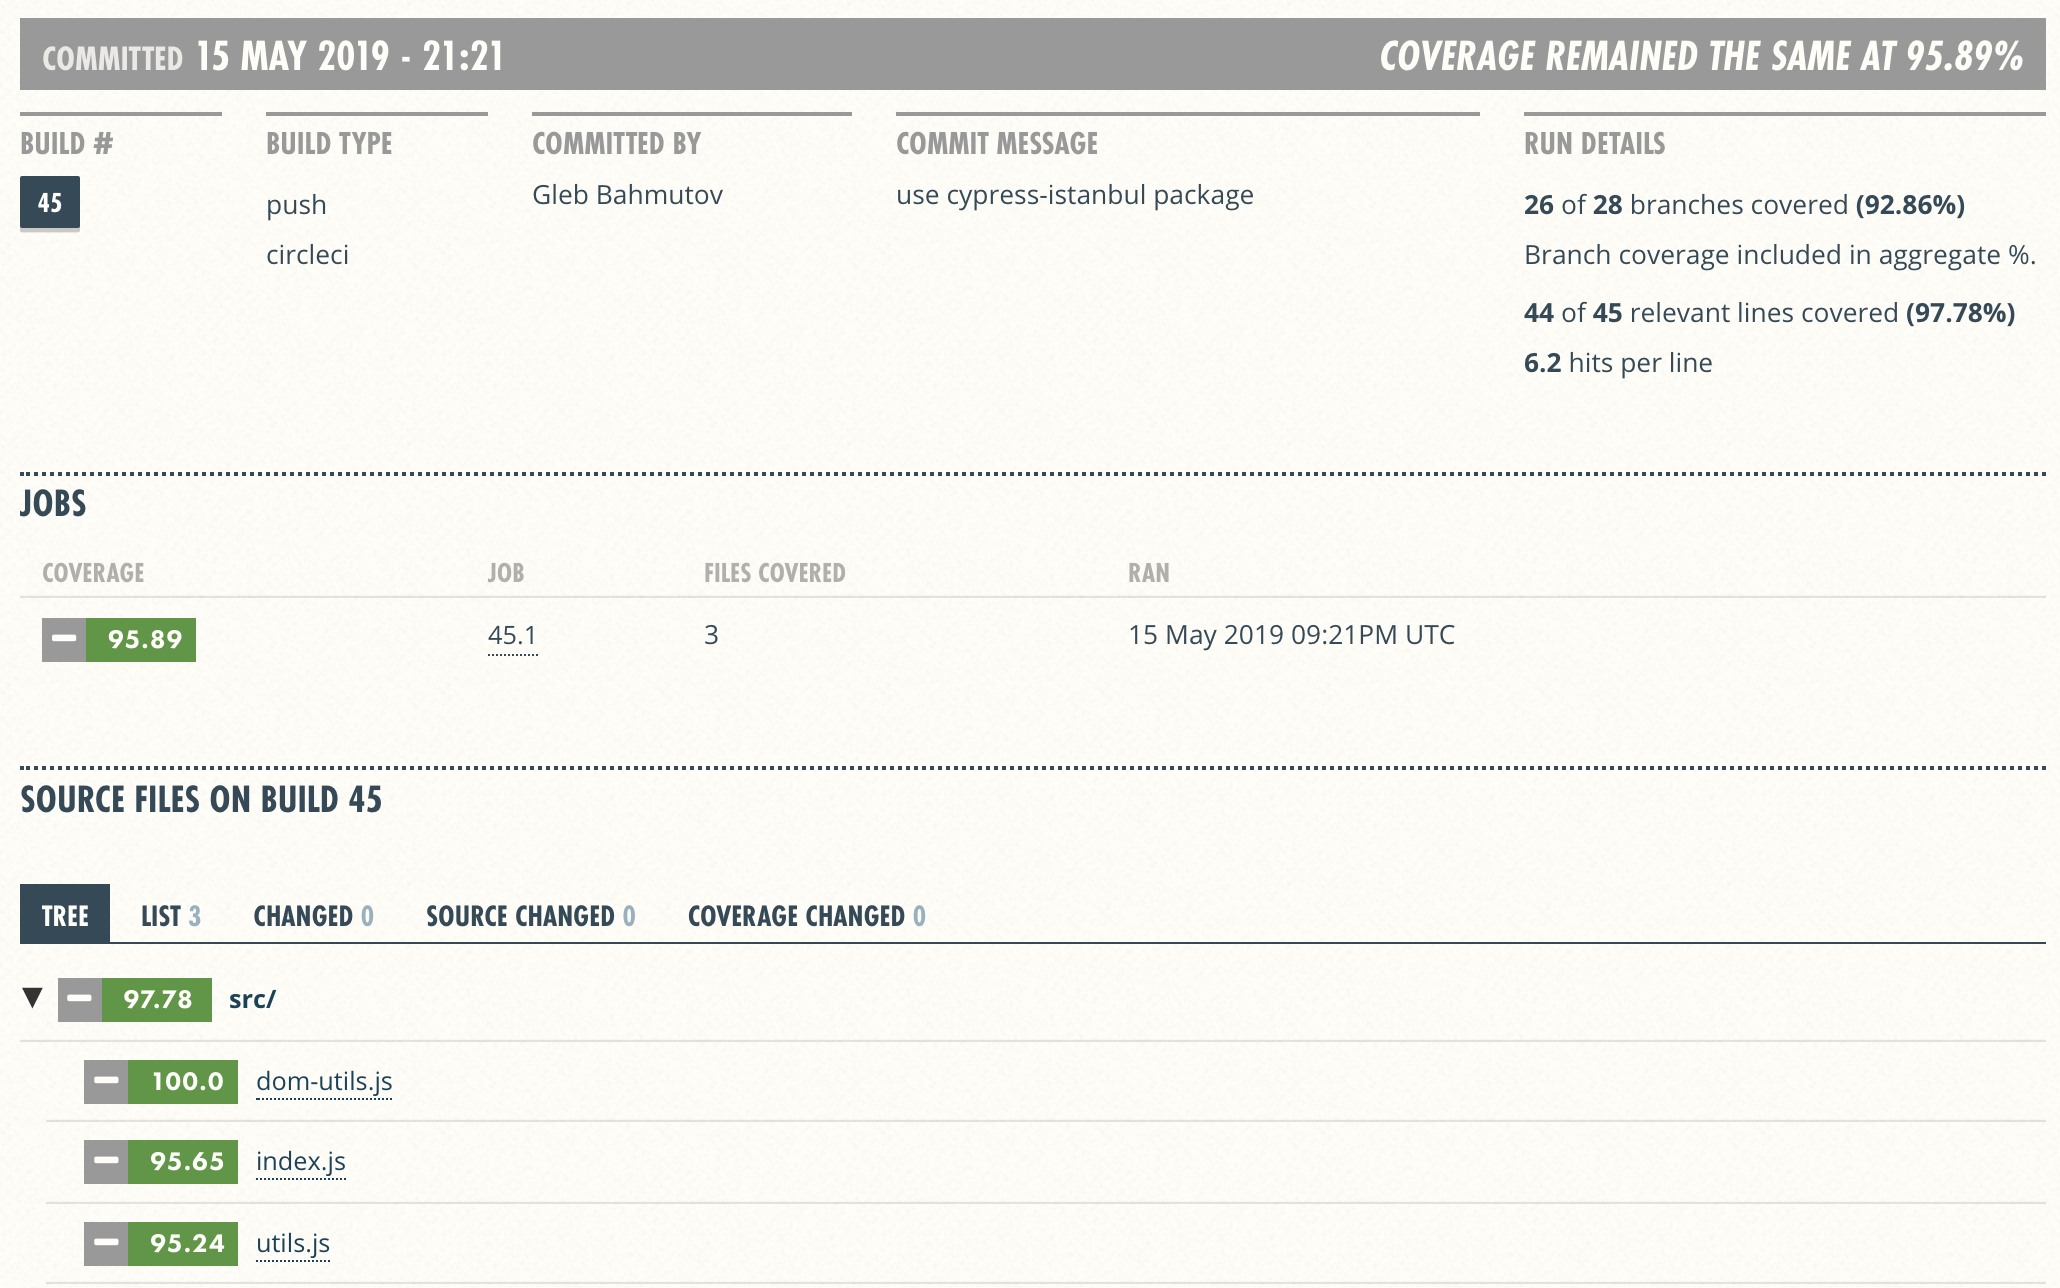
We can use the code coverage report locally to direct testing efforts. We can also store the generated report as a test artifact on CI. For example you can find it on each Circle build - it looks exactly the same as our local report folder.
But we probably want to analyze long term trends in code coverage, maybe review missed edge cases as a team during code review, etc. We need code coverage as a service - and coveralls.io is a good one. Let's send the code coverage we have collected there. I have linked the demo GitHub repository to the new project https://coveralls.io/github/bahmutov/demo-battery-api and added two environment variables to CircleCI: COVERALLS_SERVICE_NAME=circleci, COVERALLS_REPO_TOKEN=.... After that I have installed NPM module coveralls - it will send LCOV data to coveralls.io after the test run. All we need is to generate the LCOV report and pipe it to this "coveralls" npm module. In the project's circle.yml file the last steps are:
1 | post-steps: |
The coveralls script uses nyc again
1 | { |
Each CI build sends the coverage information - and since cypress run executes and combines ALL spec files, we are hitting 95% code coverage!
We can open individual scripts (Coveralls pulls the sources from GitHub) and see the last missed lines
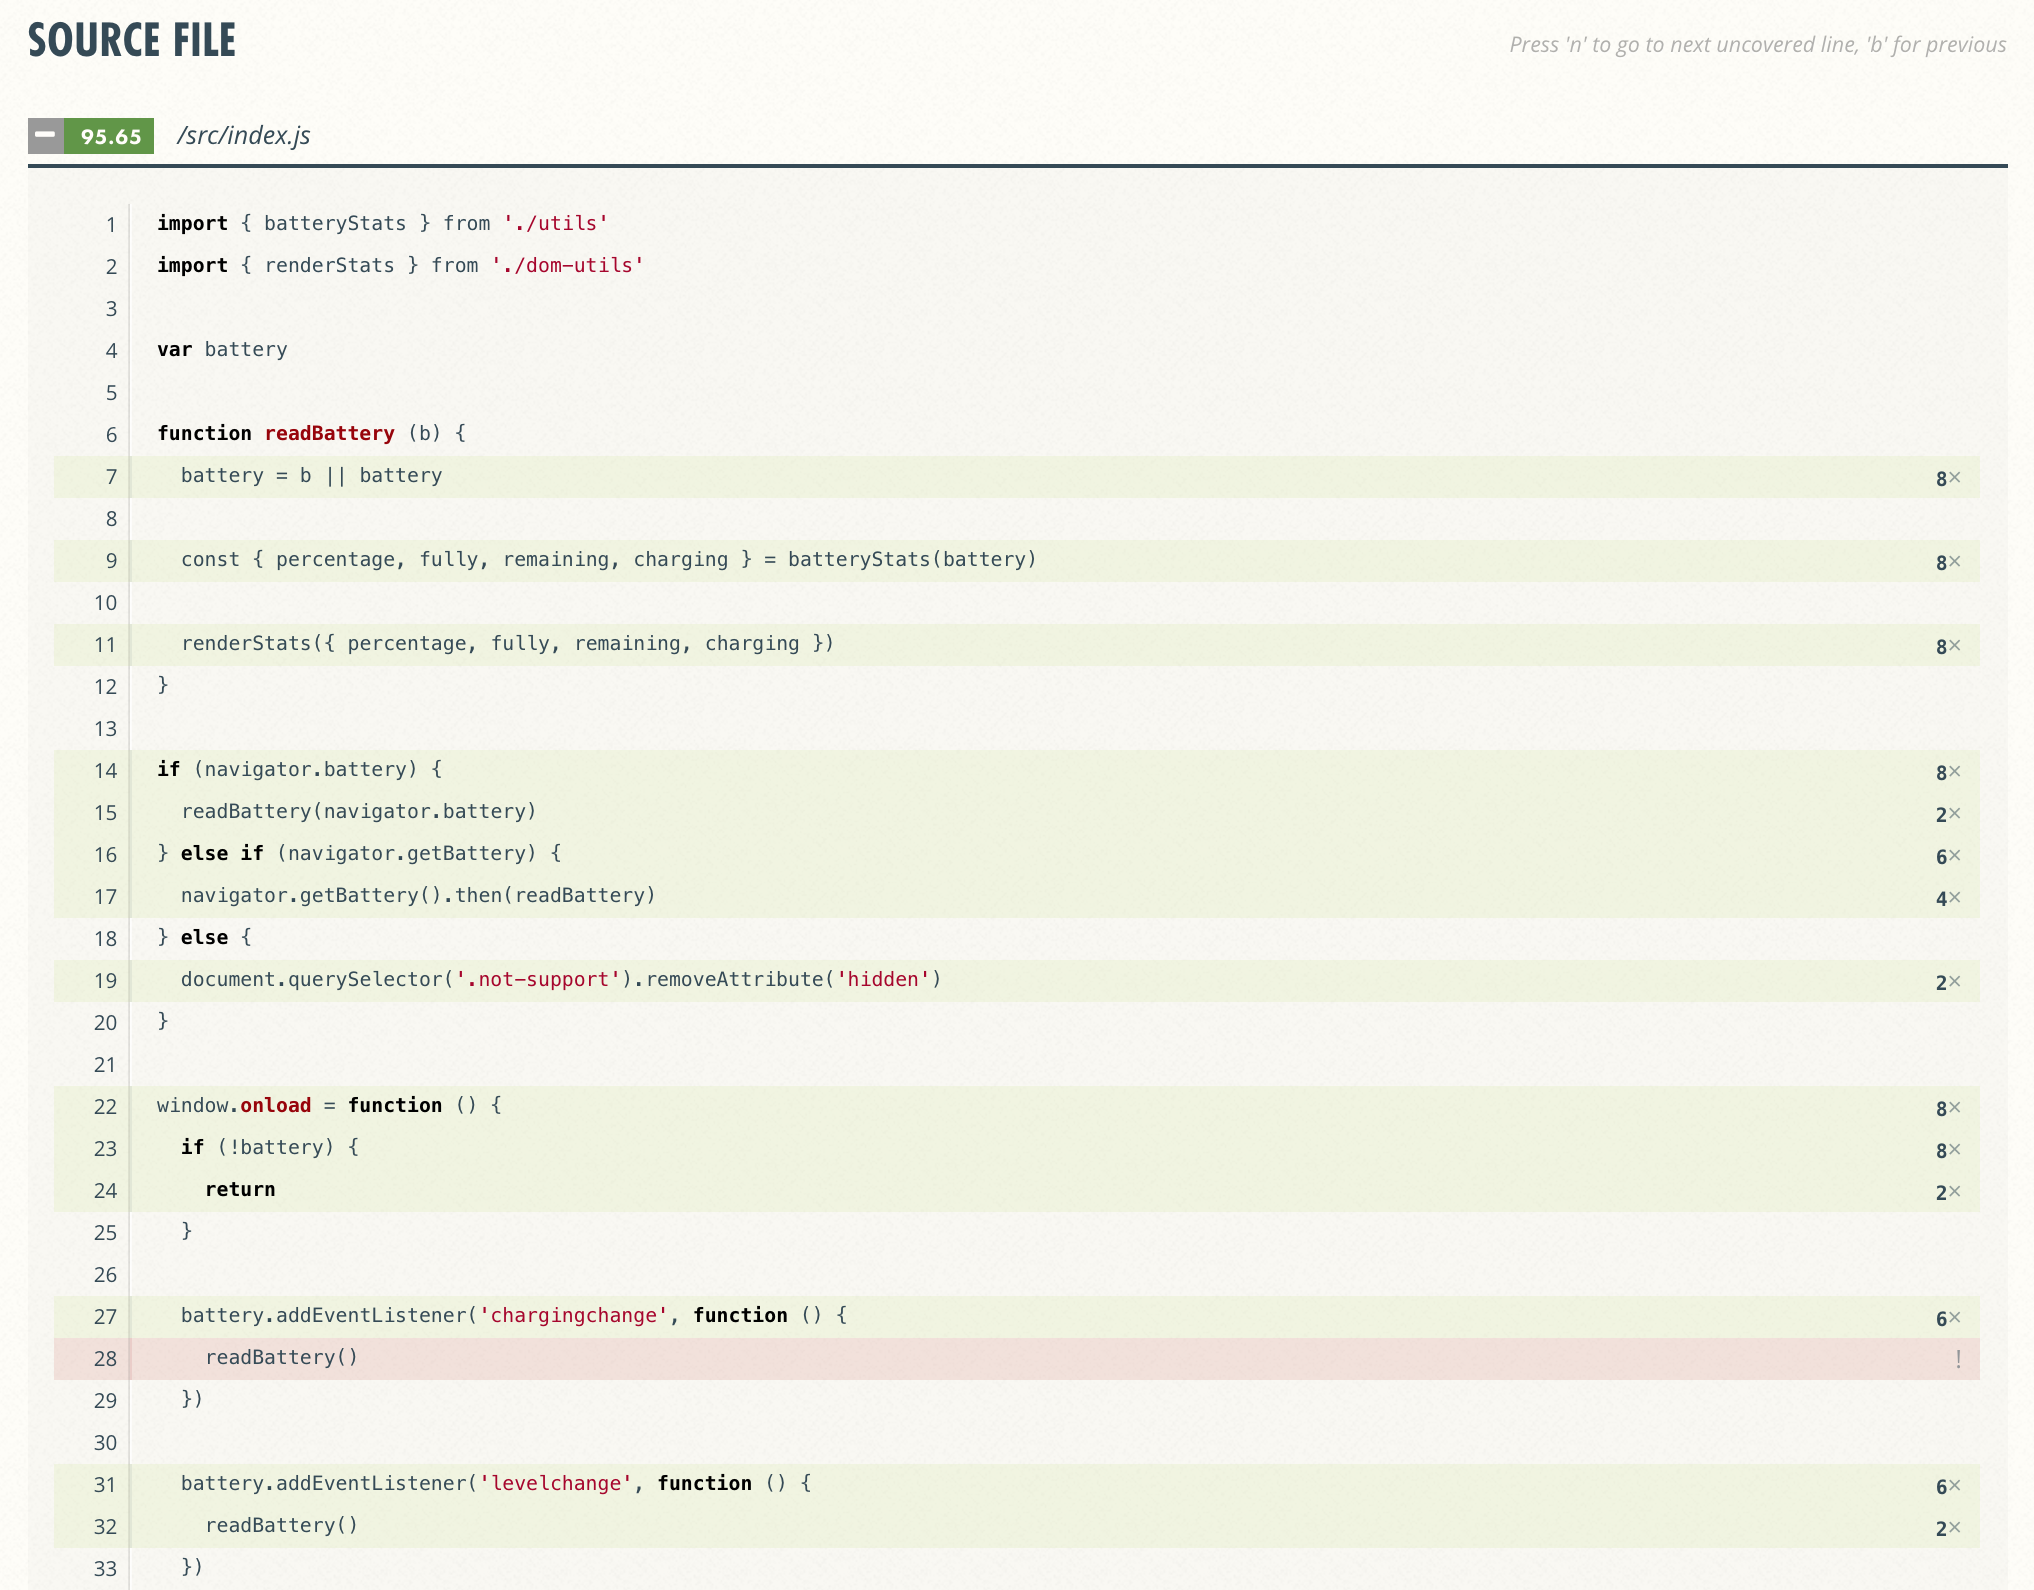
Beautiful.
More information
- Source at https://github.com/bahmutov/demo-battery-api/tree/bundle (branch "bundle")
- cypress-istanbul plugin
- https://coveralls.io/github/bahmutov/demo-battery-api dashboard
- "Code Coverage for End-to-end Tests" blog post
- "Stub navigator API in end-to-end tests" blog post
- Code coverage using webpack-dev-server example
- Cypress.io code coverage guide