I always advise to refactor code if it is not easily testable. For example, exposing a grouping function from the CommonJS module to be able to unit test it
1 | function action(inputs) { |
There are ways to unit test private functions like group using NodeJS hooks, for example using
describe-it, but it is much better to refactor the above
code for simple unit testing
1 | function group(data) { |
We have added group to the exported object, and are passing the inputs to the function, instead
of using the closure. This makes it simple to write a unit test
1 | var group = require('./action').group; |
AngularJS is a very testable framework. Values, services, controllers - all can be quickly injected and unit tested from specs. We even wrote ng-describe to remove the usual boilerplate code from the testing code
1 | angular.module('S', []) |
What about the performance testing? How do we know if our live application performs fast enough for the end users? Unit testing the small benchmarks is very time consuming in my opinion. A much better approach is too treat this problem as a it develops. Typically, a client or a tester contacts the team with a complain:
When I click on this button, the application freezes for a long time.
This is when I start profiling the application using live data. The Angular framework makes some aspects of the performance profiling very simple. Since most of the data and logic is attached to the scope objects, it can be accessed from the browser's console. In the example below, we can grab the reference to a method via an element's scope, then monitor and debug it.
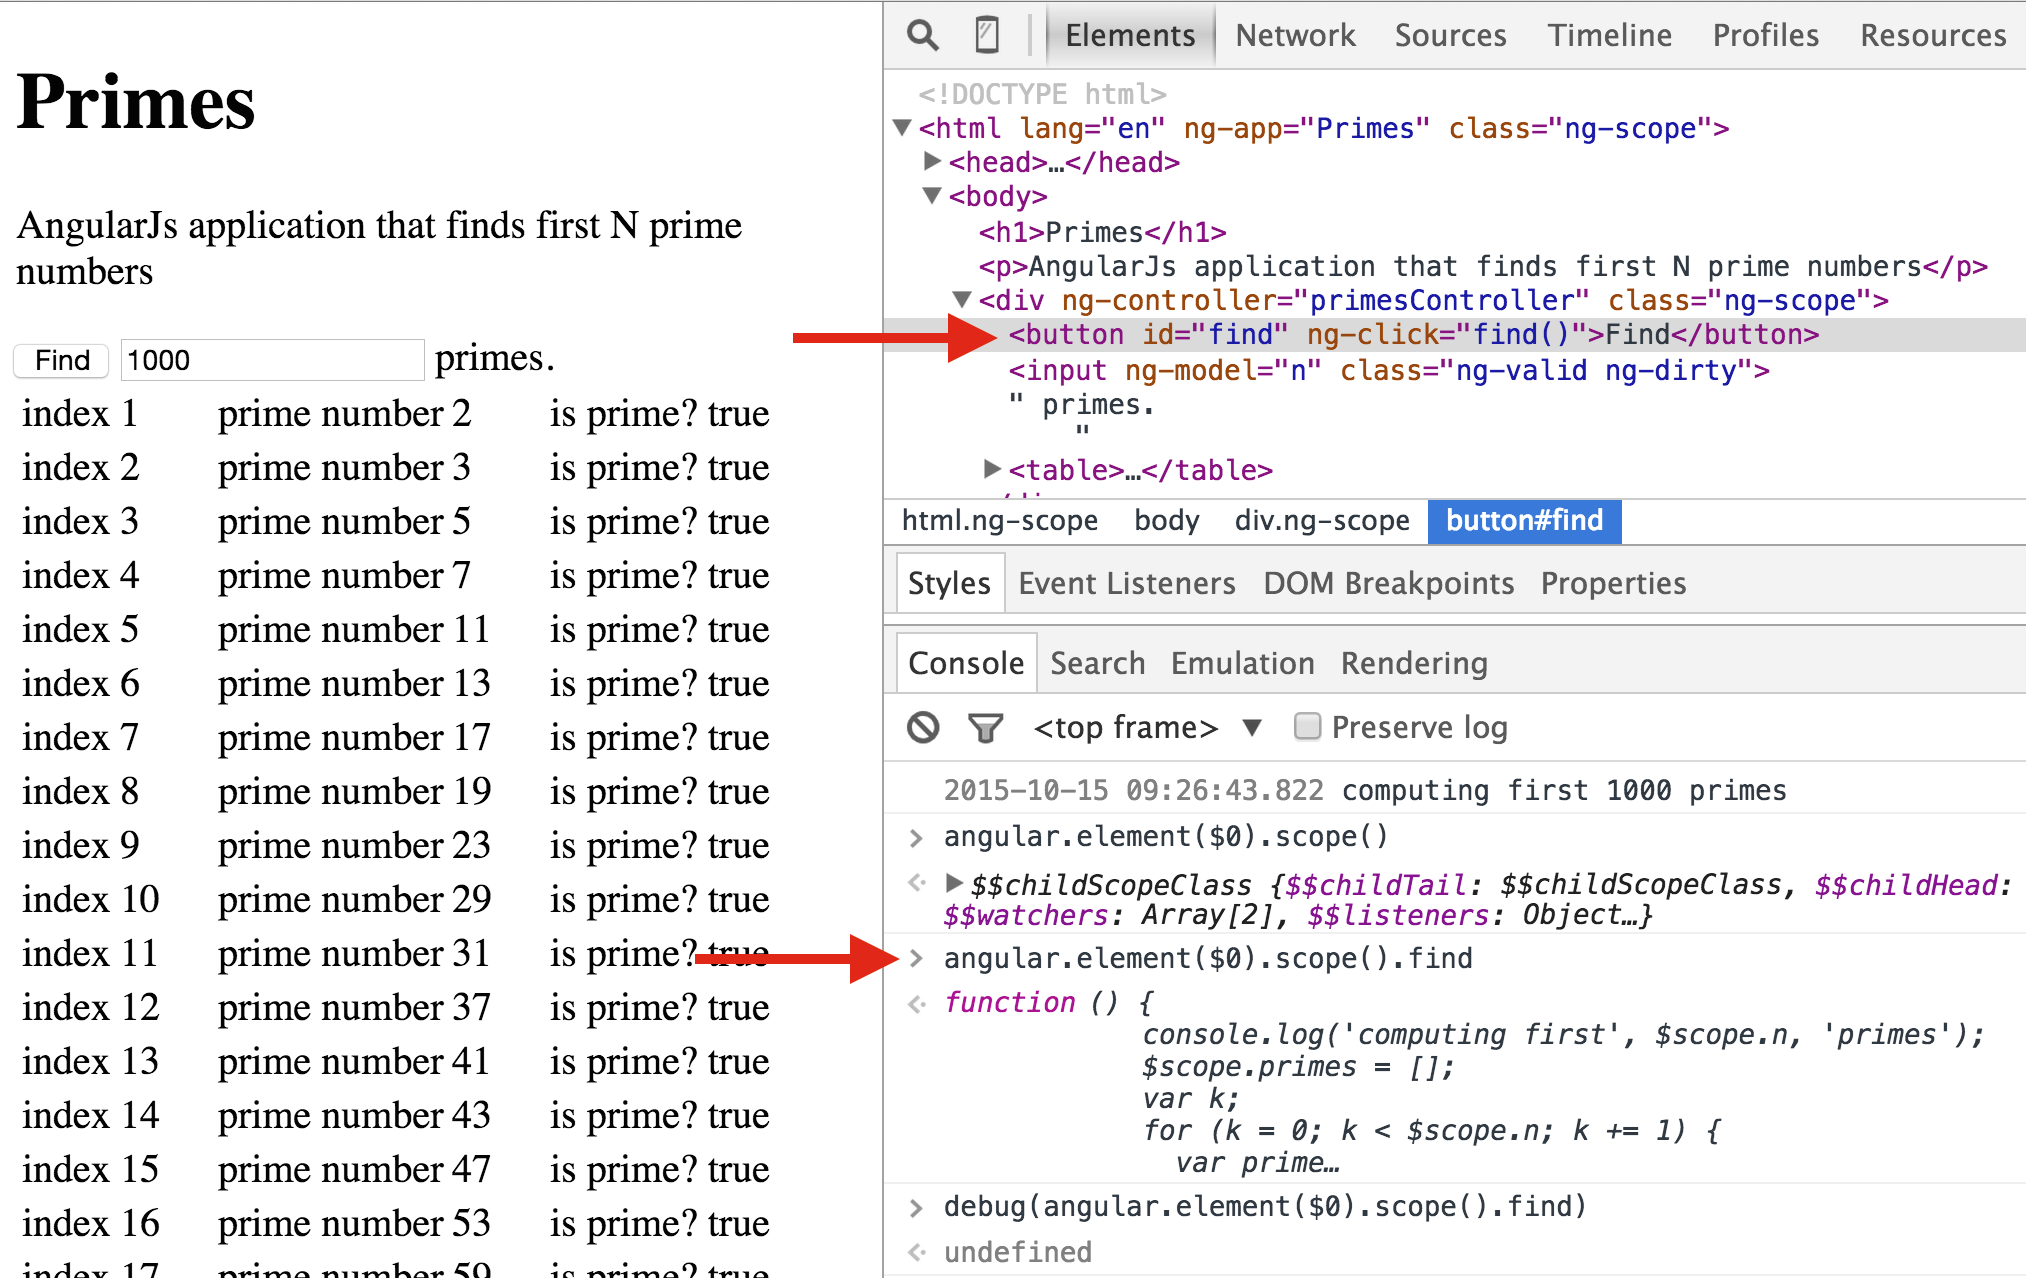
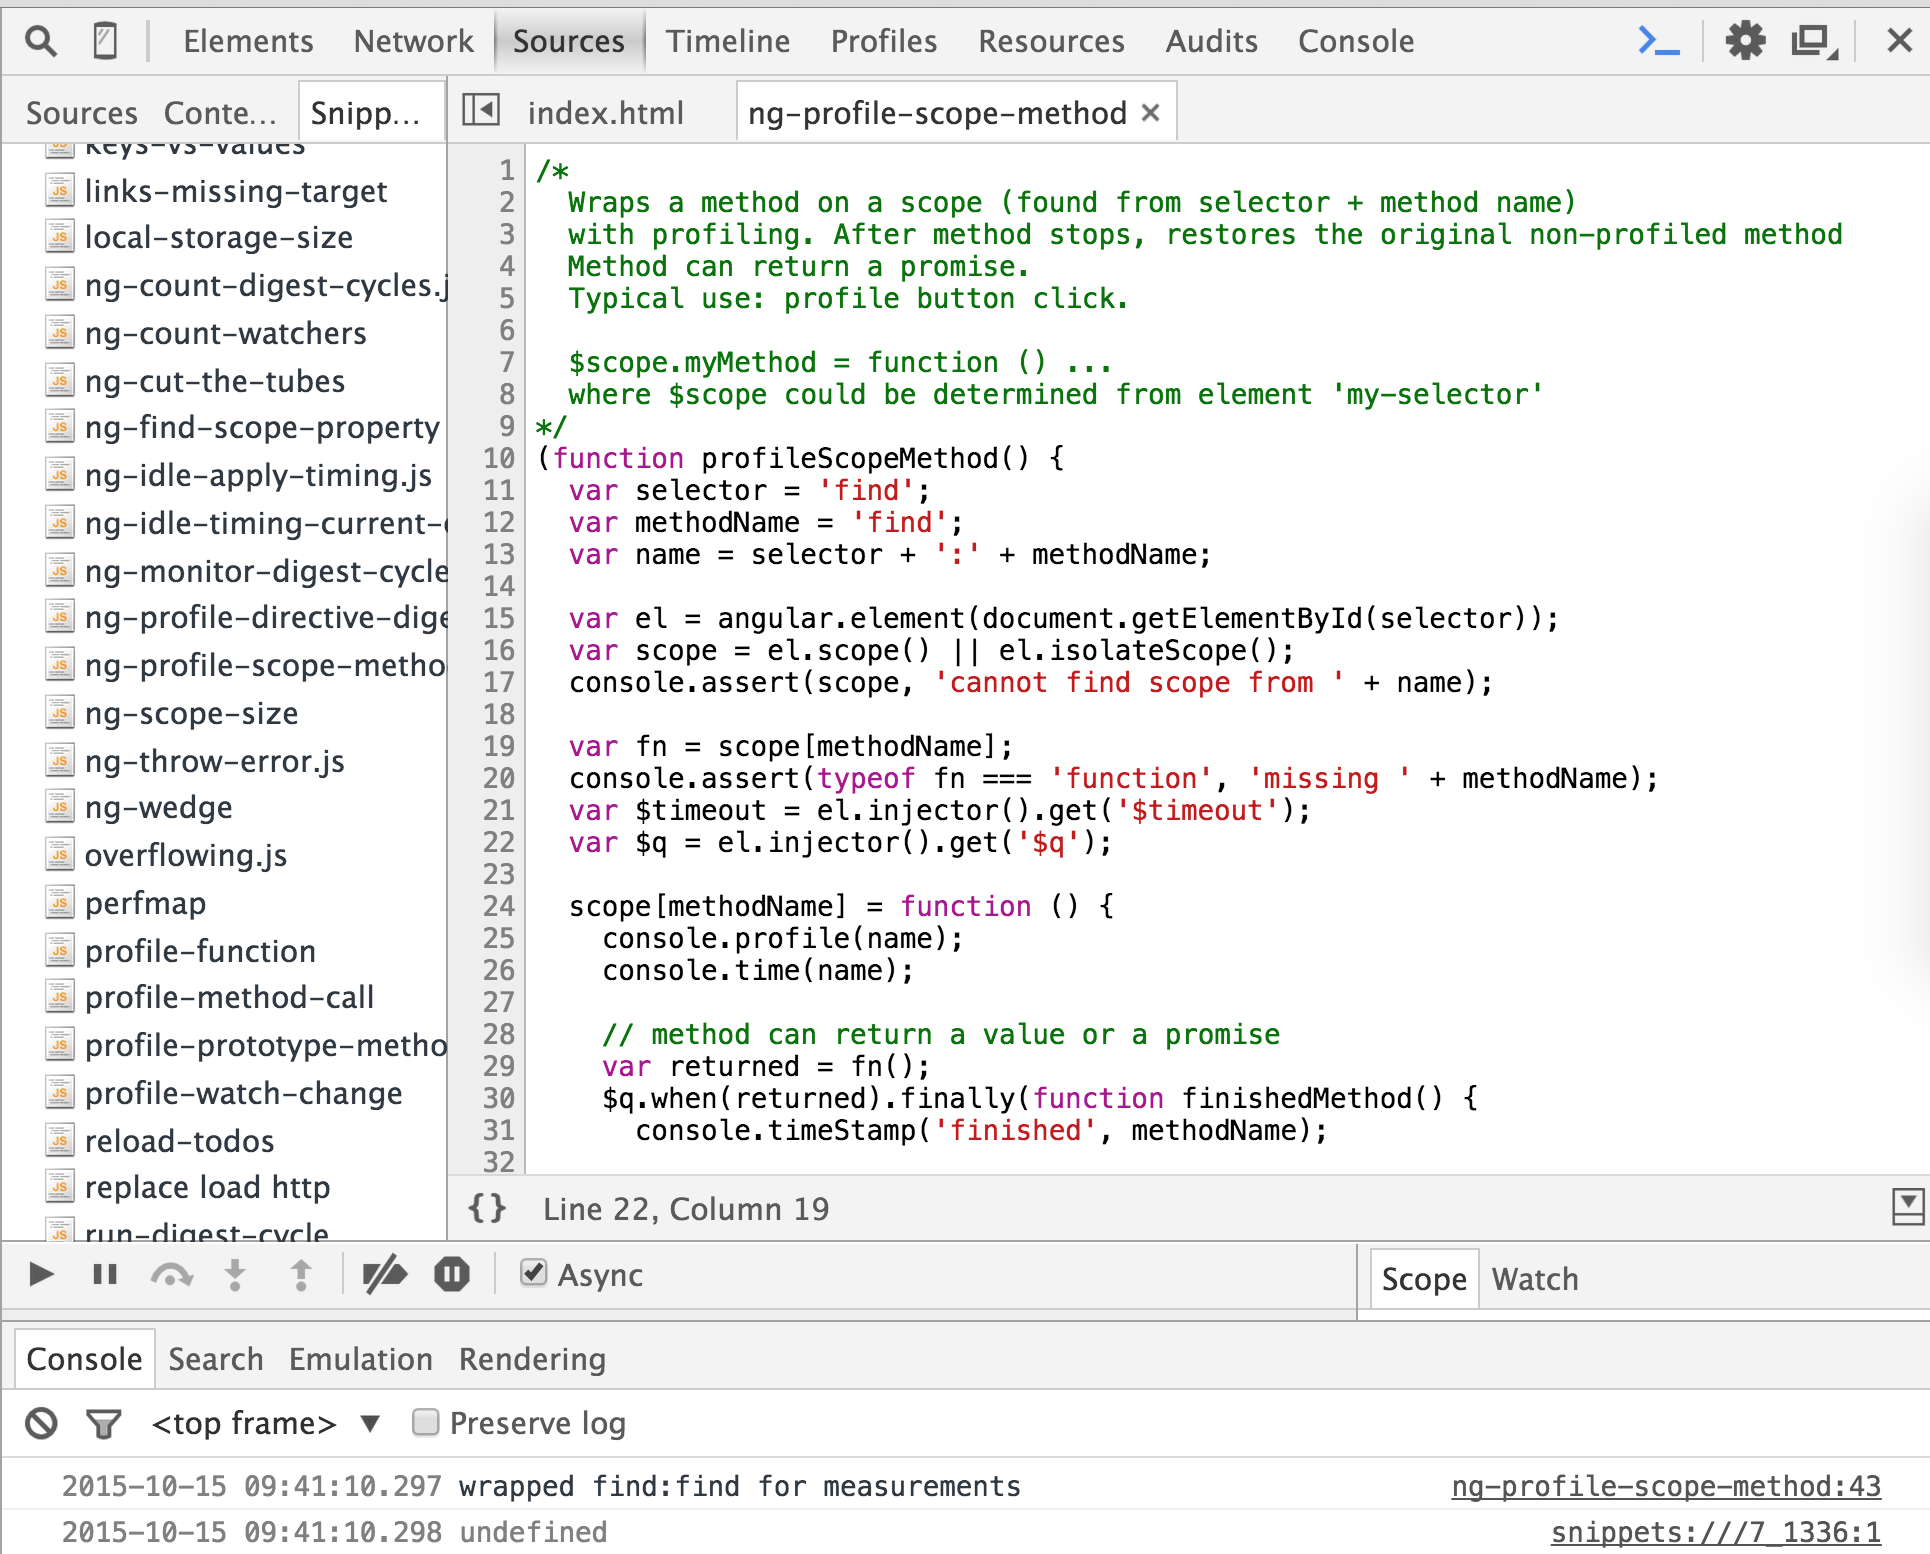
Even better, all the boilerplate code to attach and time specific scope methods can be stored outside the application in Chrome's code snippets. In the code snippet below, available in bahmutov/code-snippets we can wrap a specific method with a code that starts the Chrome profiler. When the method finishes (either by returning a value, or when the returned promise completes), the profiler stops, giving us a very accurate timing information.
Performance diagnostic port
Returning a promise from an asynchronous scope method, even if the promise is not used in the other application parts, is very useful for diagnosing performance problems. You can think of this similar to modern cars having a standard port for reading the engine's log and various sensor data.

Most Angular asynchronous services already return a promise by default. For example, we can time how long
a method takes if it uses $timeout service by returning it. Start with the application code
1 | $scope.sleepNseconds = function (n) { |
and refactor it to return a promise, exposing a "port" for quick profiling from the browser's console
1 | $scope.sleepNseconds = function (n) { |
Sometimes making a promise-returning port is more complicated. For example, the directives might exchange messages instead of calling methods and returning a promise. In this case, you have to refactor more code in order to allow an external code to profile the action's performance. For example, imagine that the parent controller broadcasts a message to all children. Every child does something for random number of milliseconds. You can see the application in action below. Click the "action" button to broadcast the message.
1 | var randomMillis = function() { |
The DOM will have markup for the parent and children controllers
1 | <div ng-controller="parent"> |
This code cannot be measured or profiled accurately. The profiler could be started and stopped manually,
but this is inaccurate and not very repeatable. Let us refactor the code to return a promise from the action.
First, we need to keep track how many children controllers are executing. Second, we need to resolve
the promise when every child controller finishes. To do this, the child controllers will emit additional
messages: one when starting an action, and another when the action is complete. This allows
the parent controller to know when every part is complete.
1 | var randomMillis = function() { |
Normally, I would profile this code from the browser's console using ng-profile-scope-method.js code snippet. Because the code is embedded in an iframe in the example, I had to place the wrapping code into the Angular application itself. Here is the additional code in the parent's controller
1 | $scope.profileAction = function profileAction() { |
Open the browser console, then click the "profile action" and then the "action" buttons.
You should see the timing information and the generated profile. The last message in the console
comes from console.time() - console.timeEnd() calls and should accurately reflect how long the
entire action took.
We had to add code to our action method, but the new code makes it simple to profile.
I am sure that this boilerplate code is easy to factor out
into a service to make a truly reusable performance diagnostic tool.