We receive a report for every error that happens in the browser while the user is using kensho.com. We use Sentry error reporting backend with Raven.js client library. I wrote several blog posts that show how to setup and use Sentry effectively. One thing we have yet to setup are source maps. Sentry supports the source maps, but we use Closure compiler to minify JavaScript in streaming mode instead of file mode, and thus do not generate source maps. Luckily, debugging minified JavaScript code without source maps is still pretty simple when using stack trace information captured by the Raven exception handler (at least in Chrome).
Example
We have Cannot read property 'length' of undefined error reported by Sentry several times.
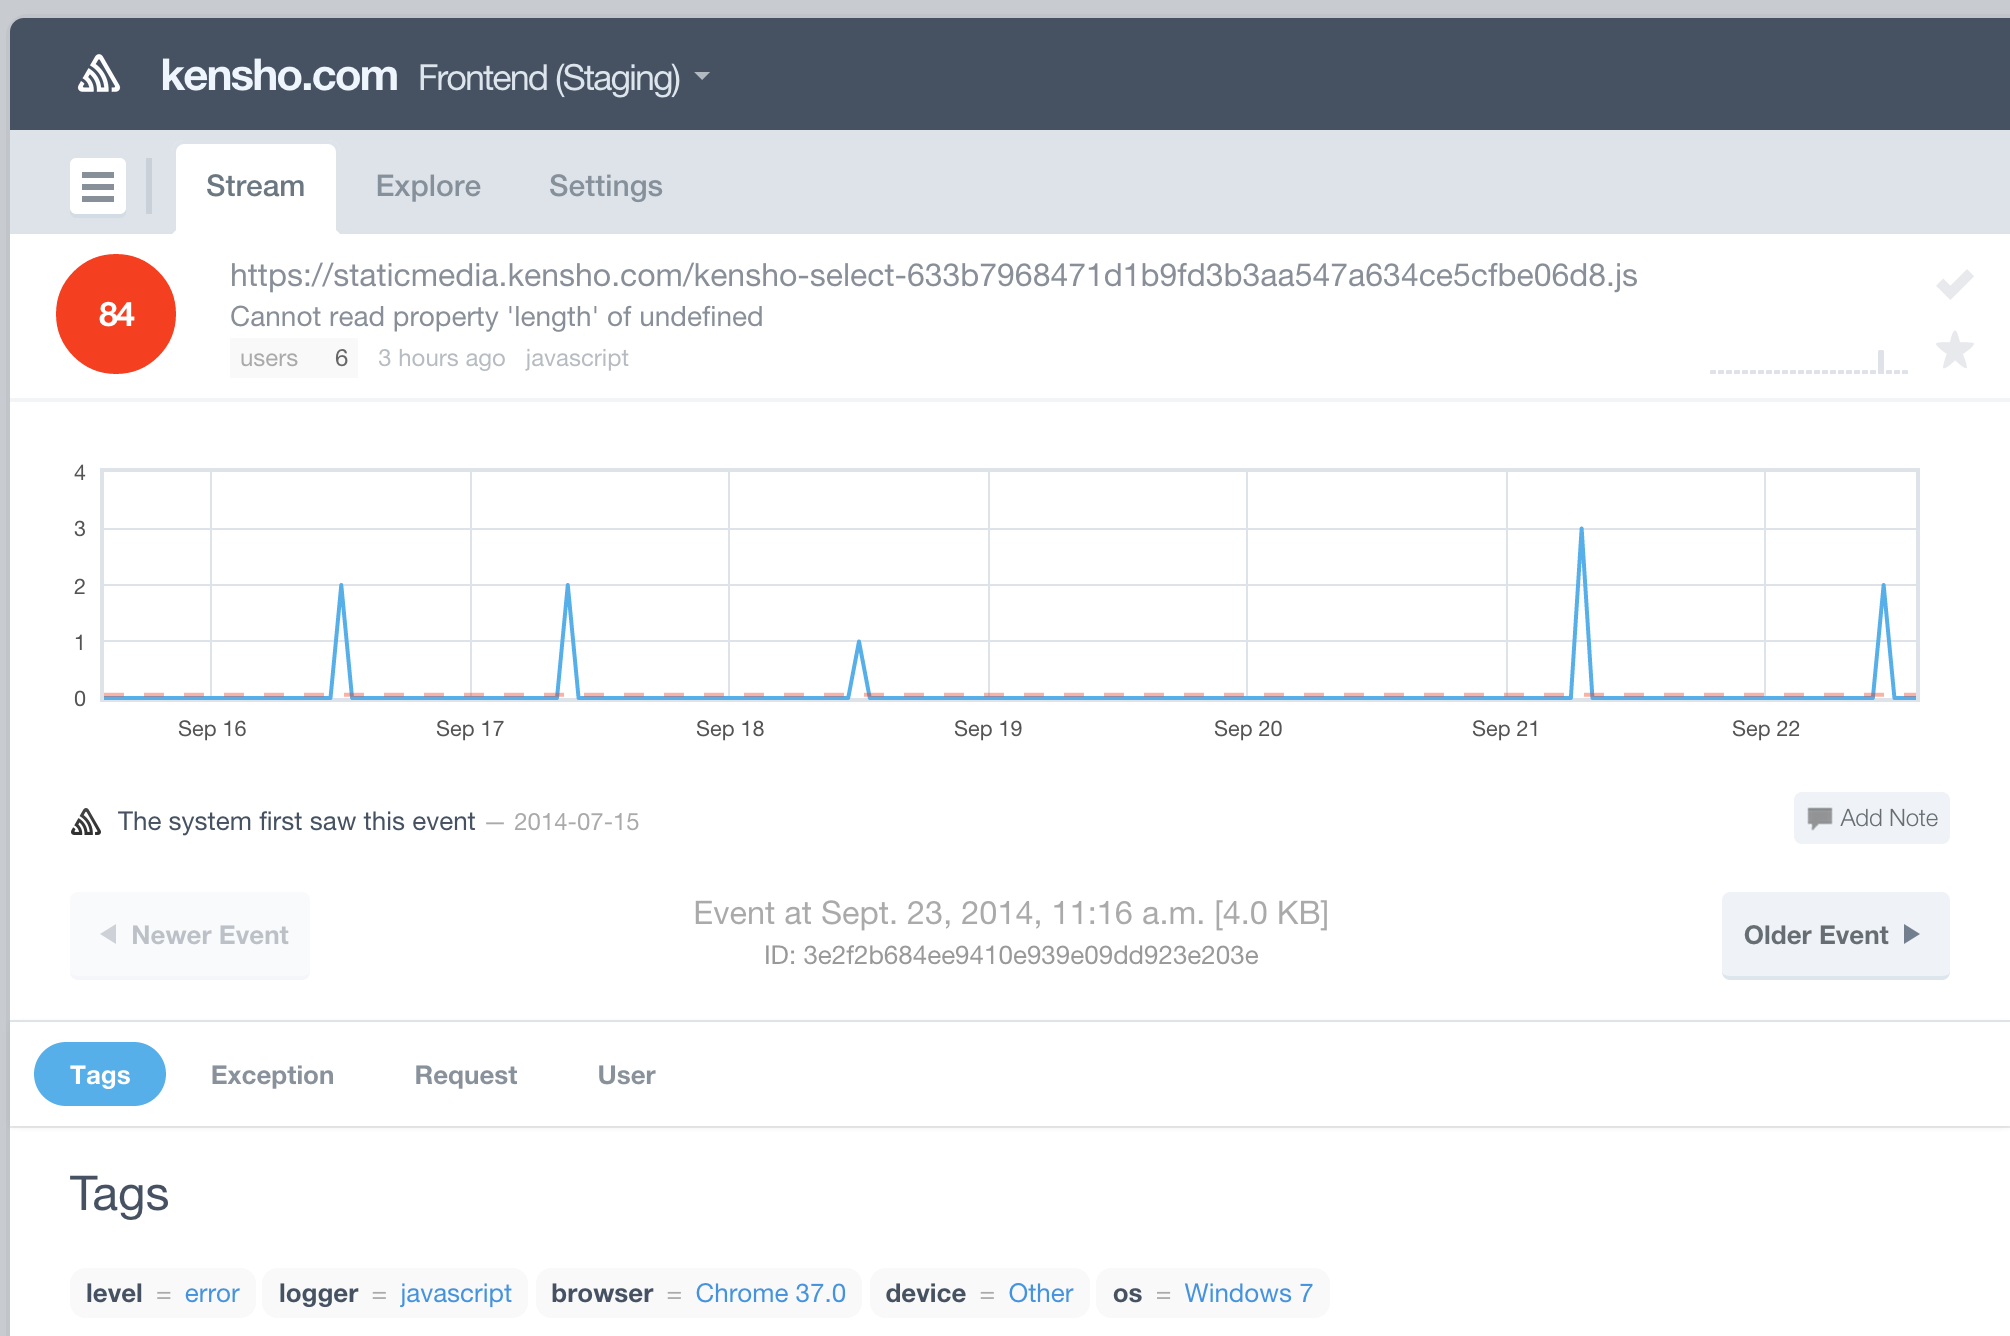
The error has been happening infrequently over several months, but neither the QA nor developers could recreate the steps to cause the error intentionally.
Sentry groups errors by the exception location, thus I could inspect previous occurrences to see if there are
any common properties: browser, application configuration, etc. We send a few basic
application configuration settings with each error using tags and extra
message fields.
The additional information was not the same across the errors.
The exception seemed to happen on different platforms and for different action types.
Exception location
Sentry supports JavaScript source maps, and can automatically show unminified source for AngularJs libraries we load from a CDN.
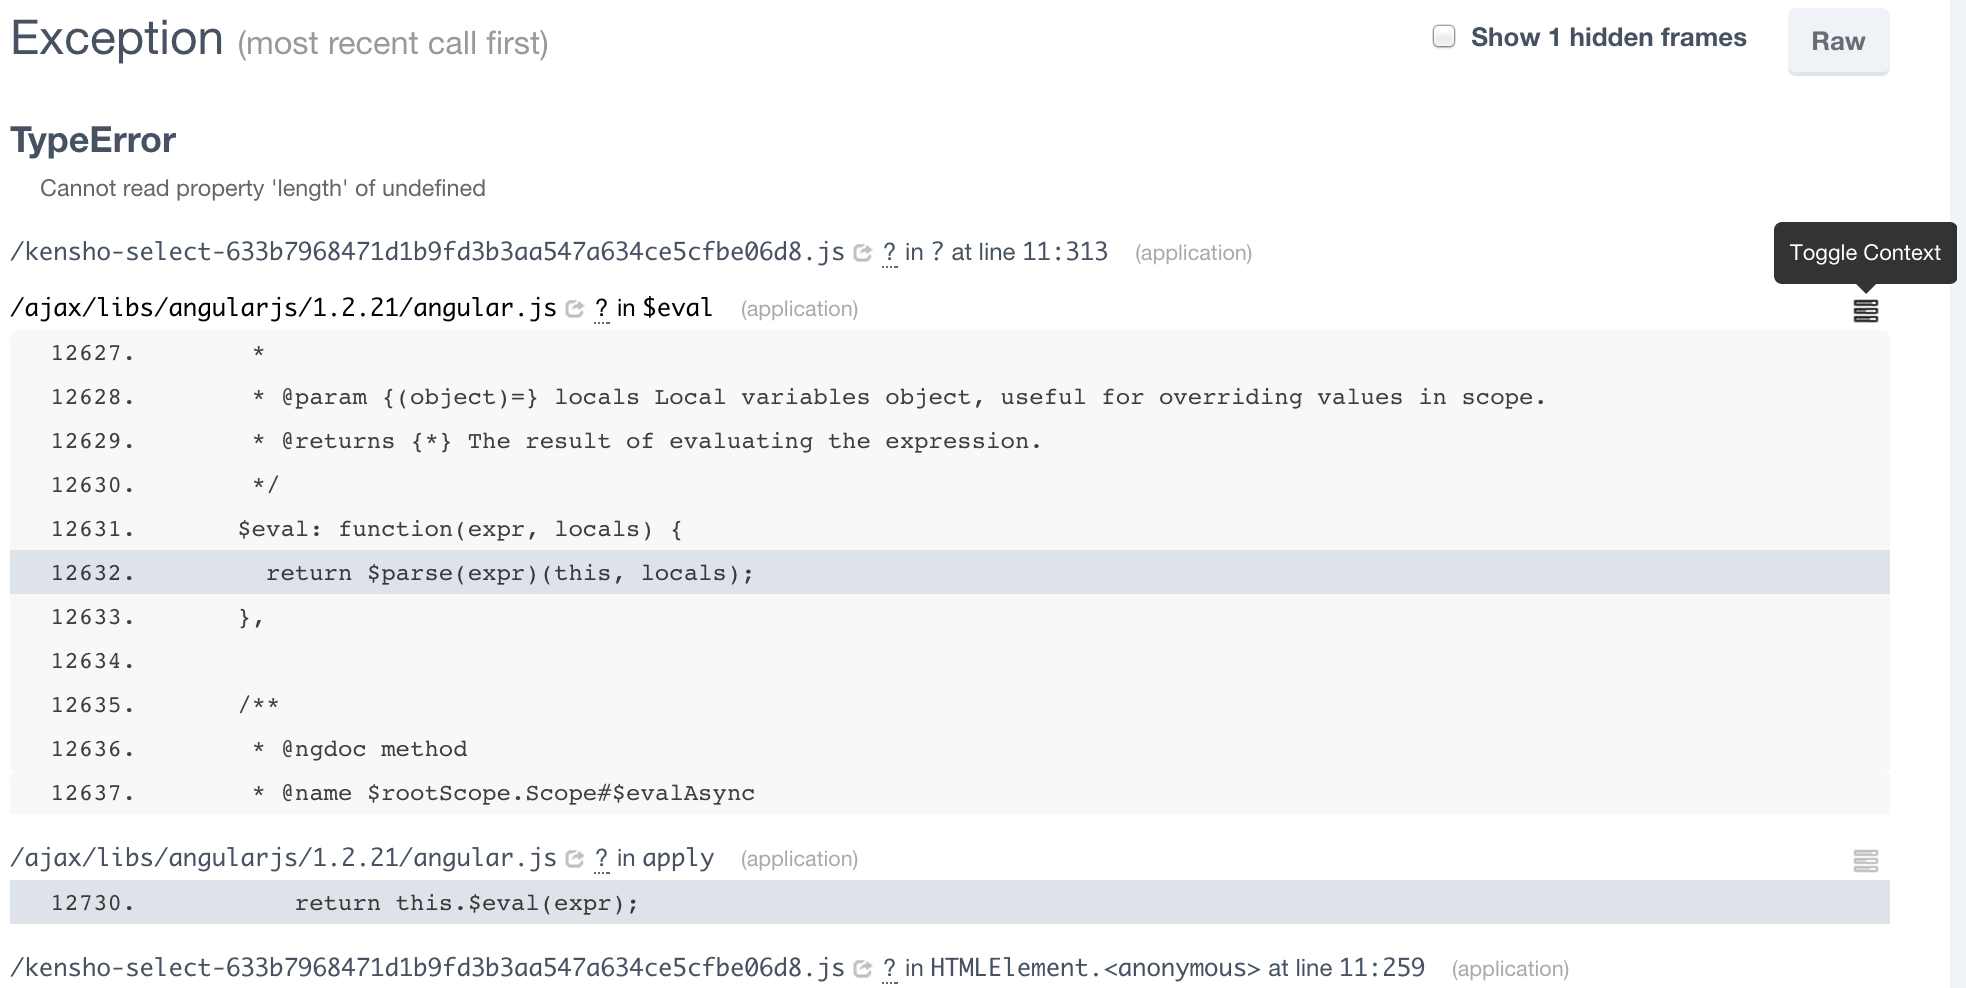
We do not get the same information for our JavaScript code, but we do get the following 3 pieces of information: script filename, line number and column where the error actually happens.
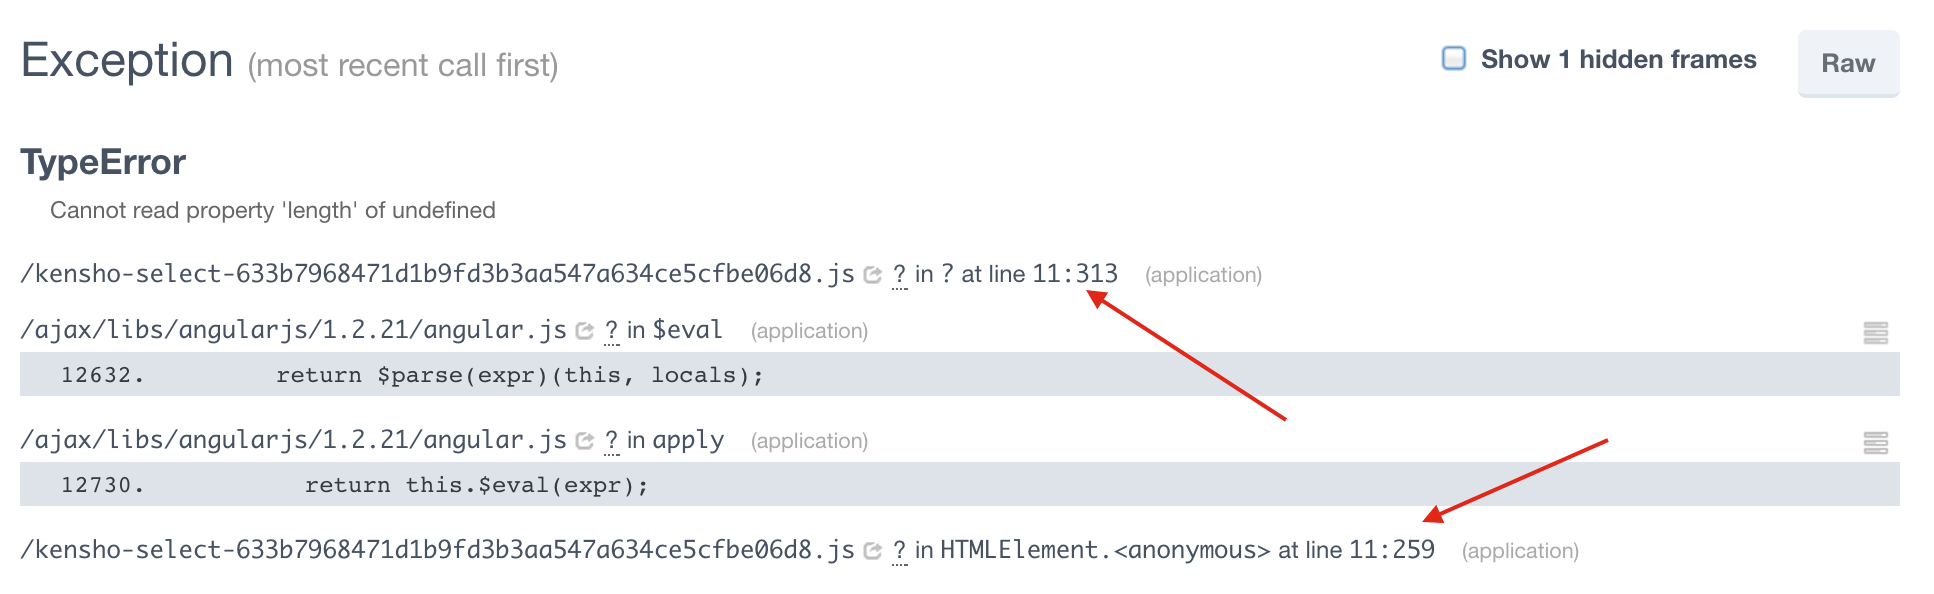
The exception is thrown in file kensho-select-633b7968471d1b9fd3b3aa547a634ce5cfbe06d8.js
at line 11 column 313.
Minified source
Knowing the location, we can easily track the error down. I log in into the website, open Chrome DevTools
and find the loaded javascript file kensho-select-633b.... The source has been minified, and I do NOT
click 'pretty print' button (looks like {}, blue arrow below). Instead I go directly to line 11 column 313.

Seems the culprit is a.flattenedResults.length call - flattenedResults is undefined when I check its length.
Looking to the left along line 11 I see that this piece of code is executed when user clicks Enter (b.keyCode===d.ENTER?).
The kensho-select code implements a hierarchical select choice directive; seems we allow the user to click Enter
before the data has been initialized. Fixing the problem is now trivial.
Conclusion
Error reporting is helpful even without source maps. Knowing where an exception happens: filename, line and column numbers inside the minified JavaScript code can be enough. Using descriptive and meaningful property names helps understand the surrounding context and help locate the original source code.