Imagine you have a web application, and you need to write the end-to-end tests. The project never had them, so you are starting from scratch. How would you approach it? Here is what I would do to test a TodoMVC web application using Cypress.
Note: I strongly recommend reading the blog post Cypress Test Statuses first, as it explains the difference between pending and skipped test statuses.
- Start
- The first test
- The feature tests
- The smoke test
- Placeholder tests
- Start recording
- Write tests
- Bonus 1: split into the separate specs
- Wish: show the test breakdown over time
This post was motivated by the "Cypress & Ansible" webinar with John Hill. You can watch the webinar here and flip through the slides. John has pointed out how they write the test plan before writing tests, and how tracking the implemented / pending tests is hard when you assume the tests themselves are the truth. This blog post tries to show one solution to this problem.
Start
📦 You can find the application and the tests from this blog post at bahmutov/cypress-example-test-status repository.
First, I would install Cypress and start-server-and-test
1 | npm i -D cypress start-server-and-test |
Then I would define NPM scripts to start the server and open Cypress as I work on the tests locally.
1 | { |
Tip: see my blog post How I Organize my NPM Scripts to learn how I typically organize the NPM scripts in my projects.
When working with the tests I just fire up npm run dev to start the server (without its verbose logging), and once the server is ready, open Cypress test runner.
The first test
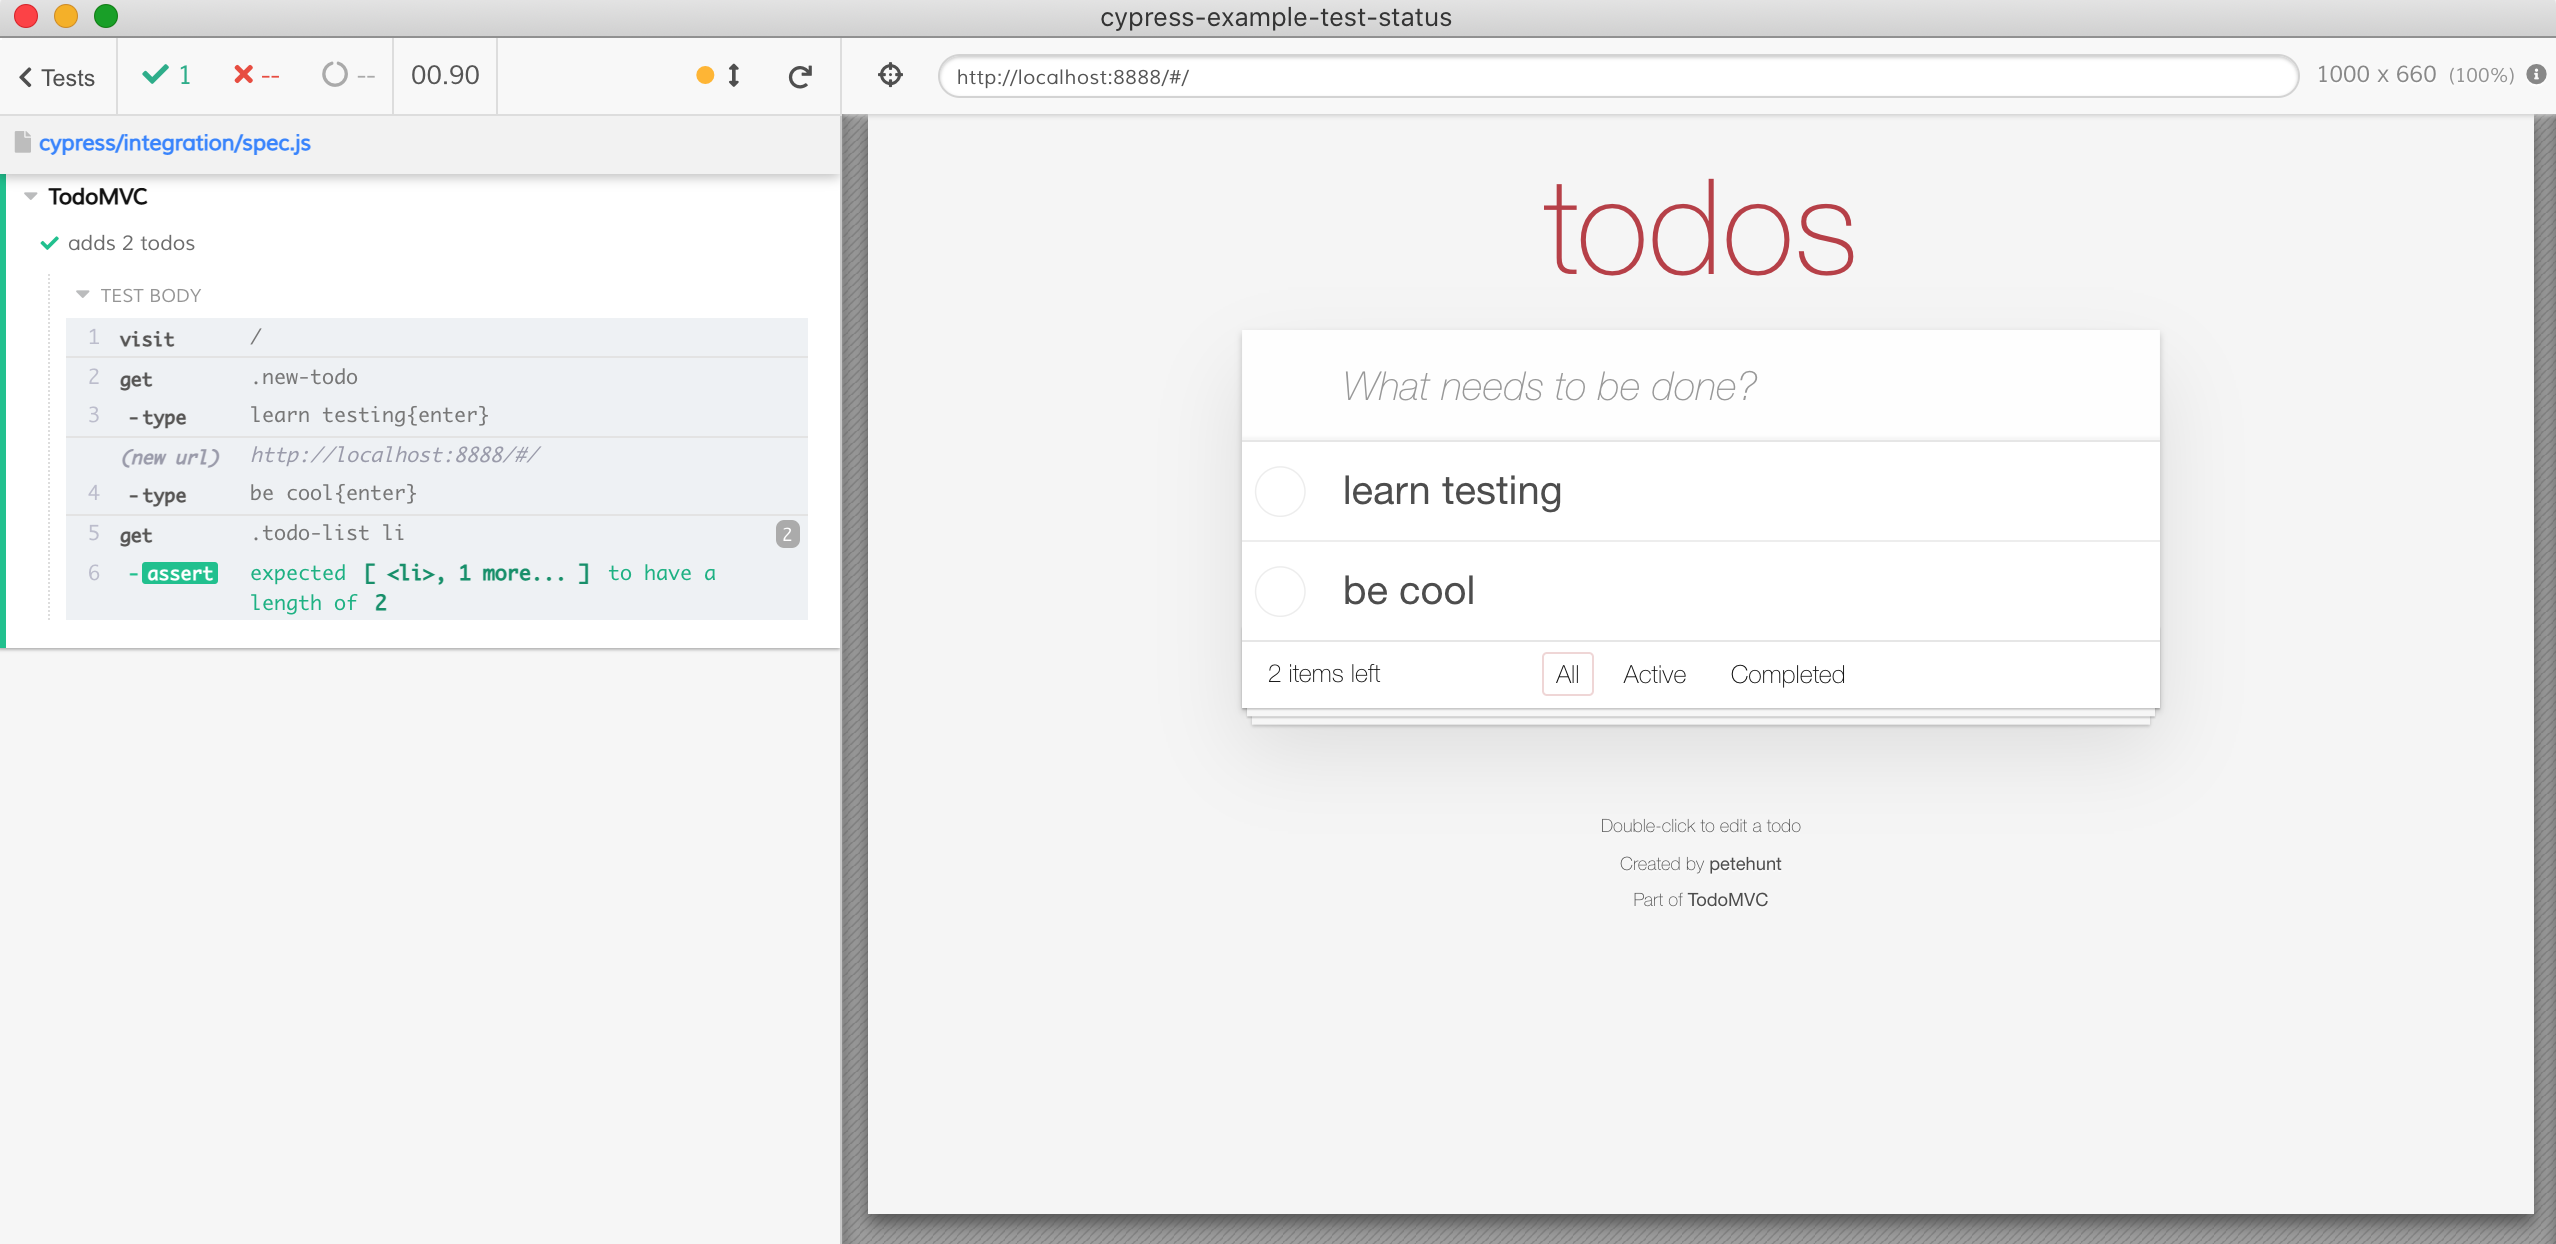
At first, I want to have a sanity test that makes sure the main feature of the application works. This test ensures right away the application is usable to most users.
1 | /// <reference types="cypress" /> |
Great, the test passes locally.
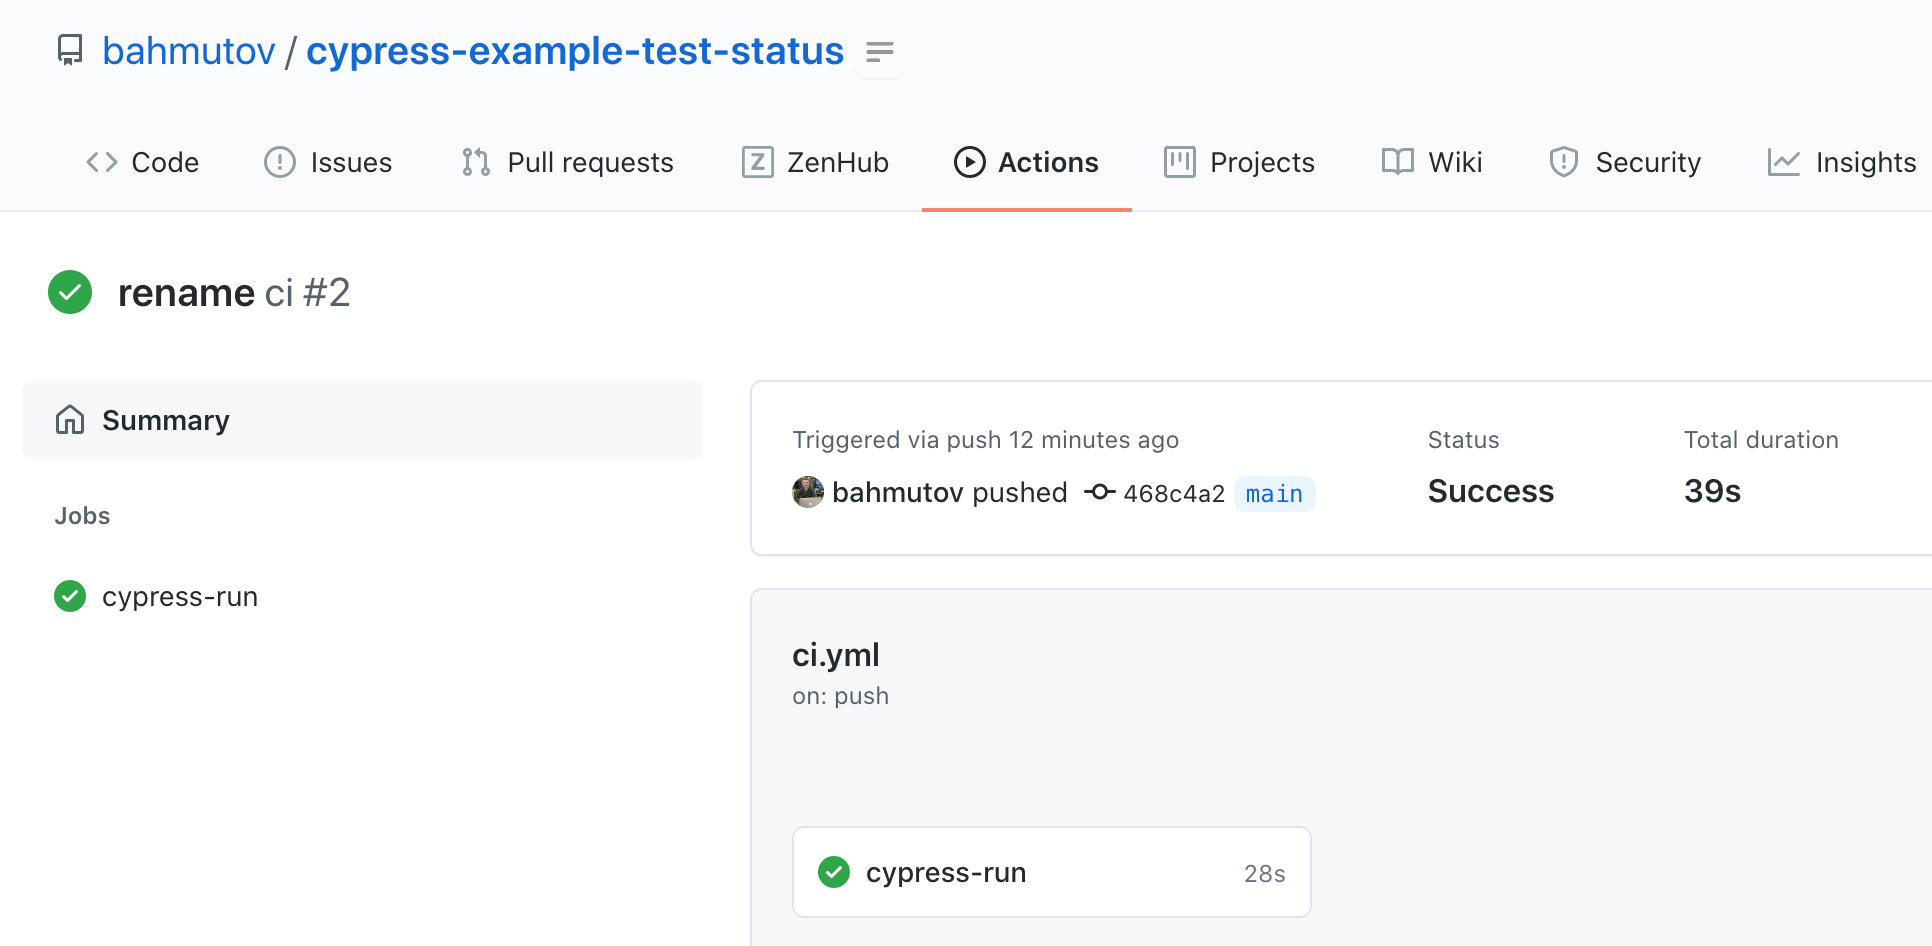
When we have a single E2E test running locally, we want to immediately start running the tests on CI. I will use GitHub Actions to run these tests. The workflow file uses the Cypress GitHub Action to install dependencies, start the server, and run the tests.
1 | name: ci |
The tests now pass on every commit.
The feature tests
Now let's think about all the features our application has. The user should be able to:
- add new todos
- edit the existing todos
- complete a todo
- remove the completed todo status
- filter todos by the status
- delete all completes todos
We can extend the above list, filling the list, grouping every related little detail by the main feature. After a while we derive about 20-30 feature "lists" or user stories that capture everything our application can do - and this list naturally maps to an end-to-end test. Let's write the final list describing the application and its features:
- TodoMVC app
- on start
- sets the focus on the todo input field
- without todos
- hides any filters and actions
- new todo
- allows to add new todos
- clears the input field when adding
- adds new items to the bottom of the list
- trims text input
- shows the filters and actions after adding a todo
- completing all todos
- can mark all todos as completed
- can remove completed status for all todos
- updates the state when changing one todo
- one todo
- can be completed
- can remove completed status
- can be edited
- editing todos
- hides other controls
- saves edit on blur
- trims entered text
- removes todo if text is empty
- cancels edit on escape
- counter
- shows the current number of todos
- clear completed todos
- shows the right text
- should remove completed todos
- is hidden if there are no completed todos
- persistence
- saves the todos data and state
- routing
- goes to the active items view
- respects the browser back button
- goes to the completed items view
- goes to the display all items view
- highlights the current view
- on start
Wow, it is a long list. We don't have to discover all the features of the application to test, we can iterate and add more features as we think of them. But how do keep track of the currently tested features vs tests still to write? How do our tests stay in sync with the application features? How do we see the test coverage over time to make sure we are filling the gaps?
The smoke test
Here is what I advise to do first: move the very first sanity test we already have into its own smoke spec file.
1 | /// <reference types="cypress" /> |
The above smoke spec can be run any time we want to quickly confirm the app is correct. We can even run it by itself whenever we need to:
1 | npx cypress run --spec cypress/integration/smoke-spec.js |
Tip: read the blog post Use meaningful smoke tests for more details; you can even run the same smoke test in multiple resolutions to ensure the site works on mobile screens and on desktops.
Placeholder tests
Currently we have a smoke spec and an empty "main" spec file. Take the above text list of feature stories, copy it and paste it into the Cypress integration spec file. Of course, the text is not JavaScript, so our code editor will start showing all red.
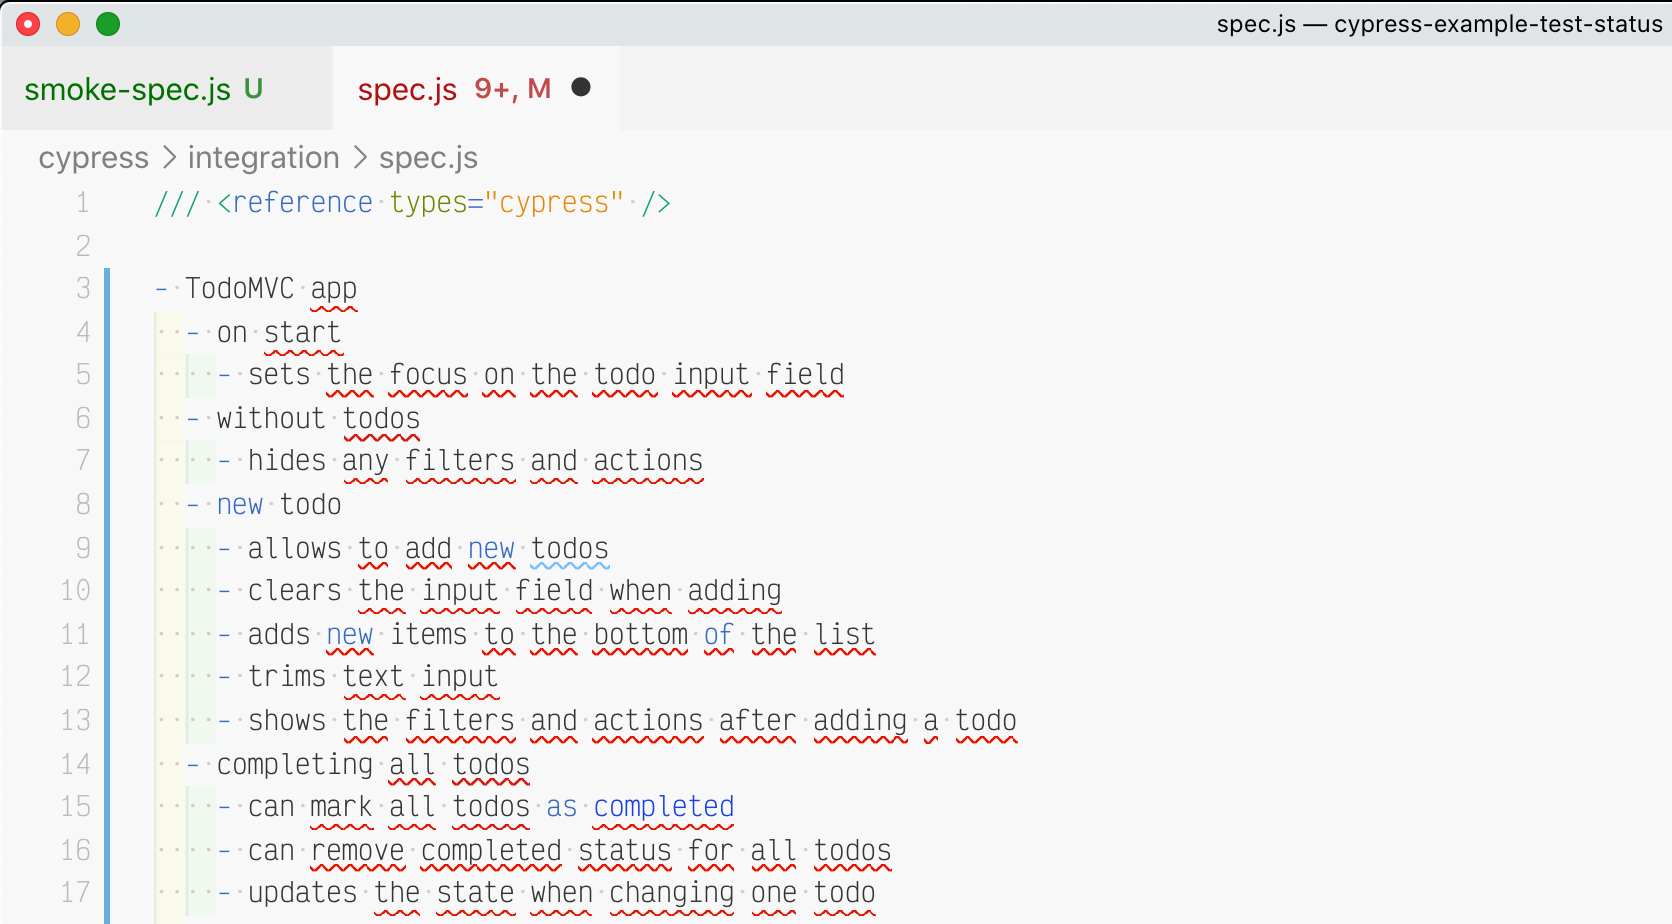
Make the top levels of the list into describe and context callbacks. Make the "leaves" items into the tests without test bodies. Just the test with a title argument like this it('title...'). This is a valid spec file!
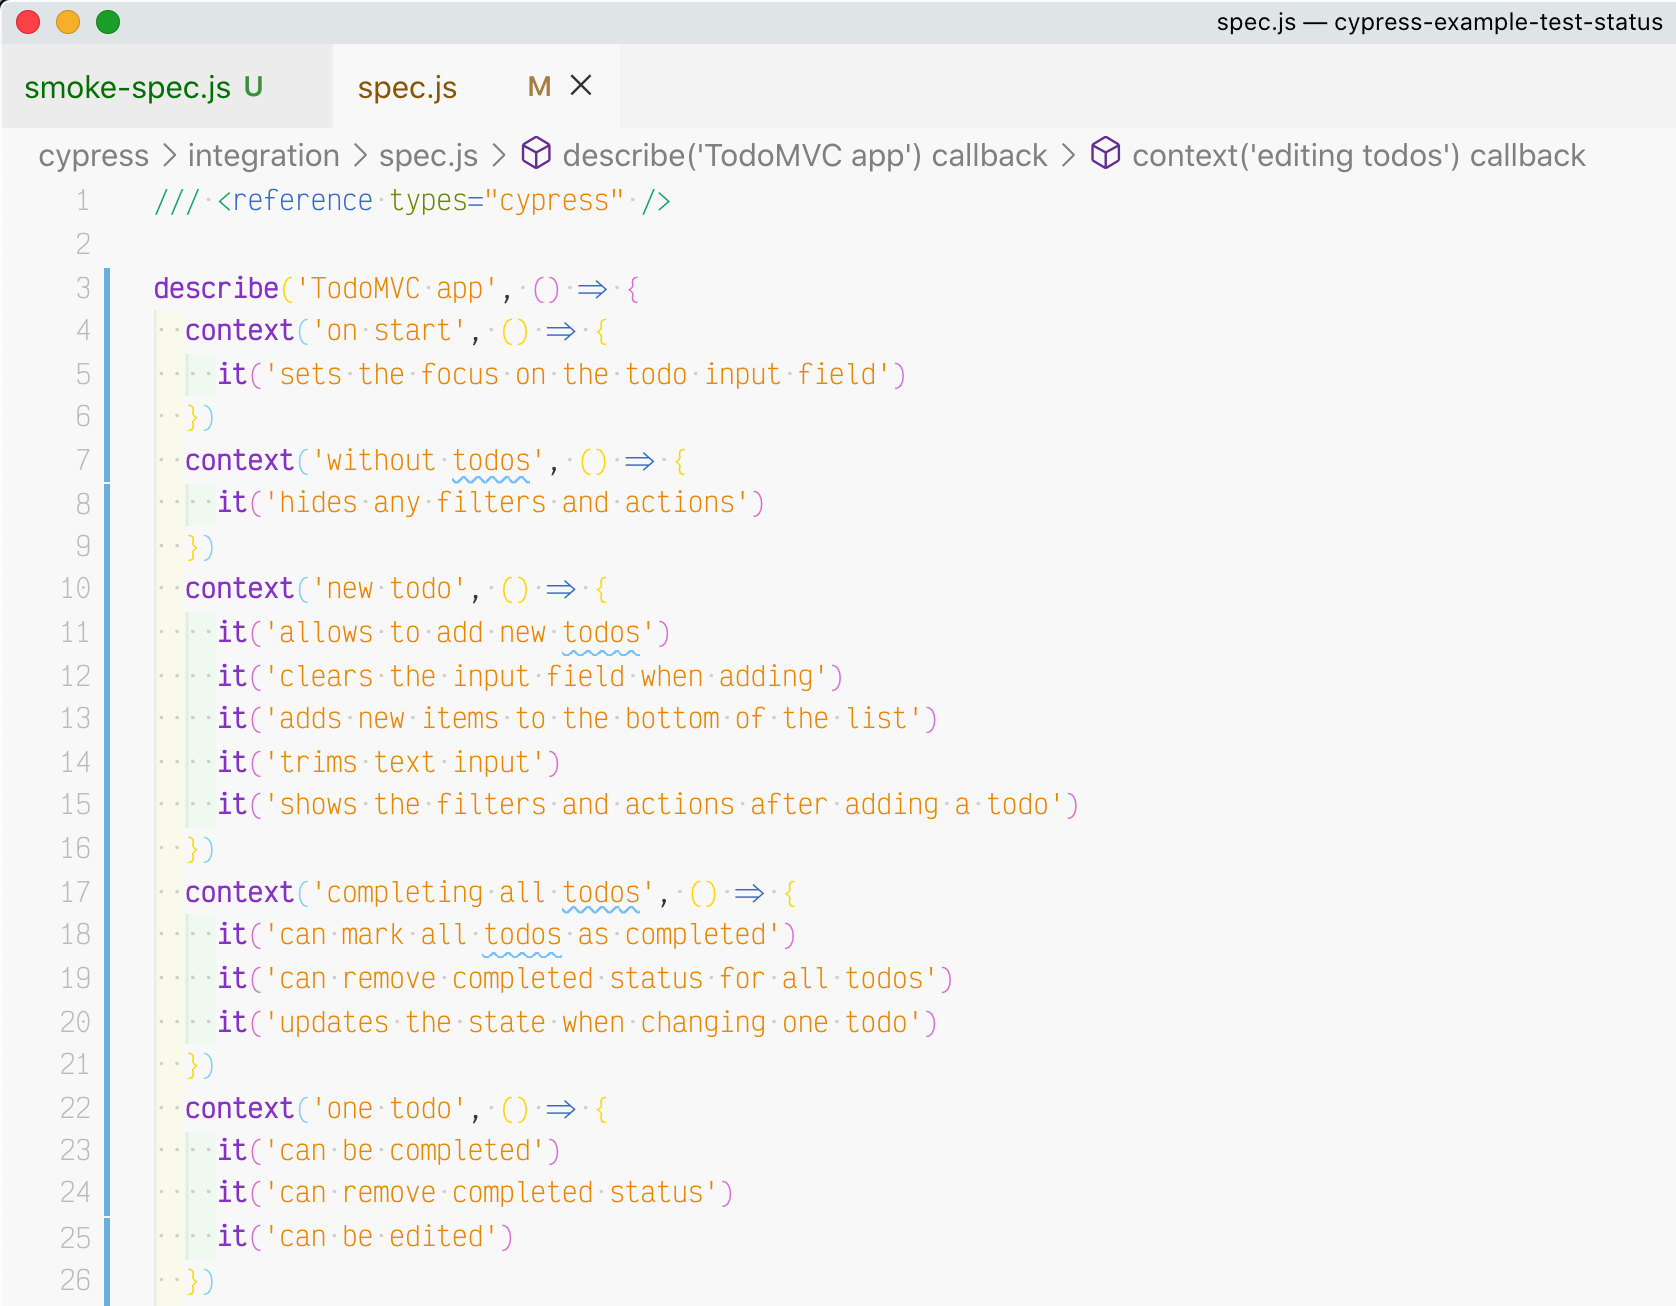
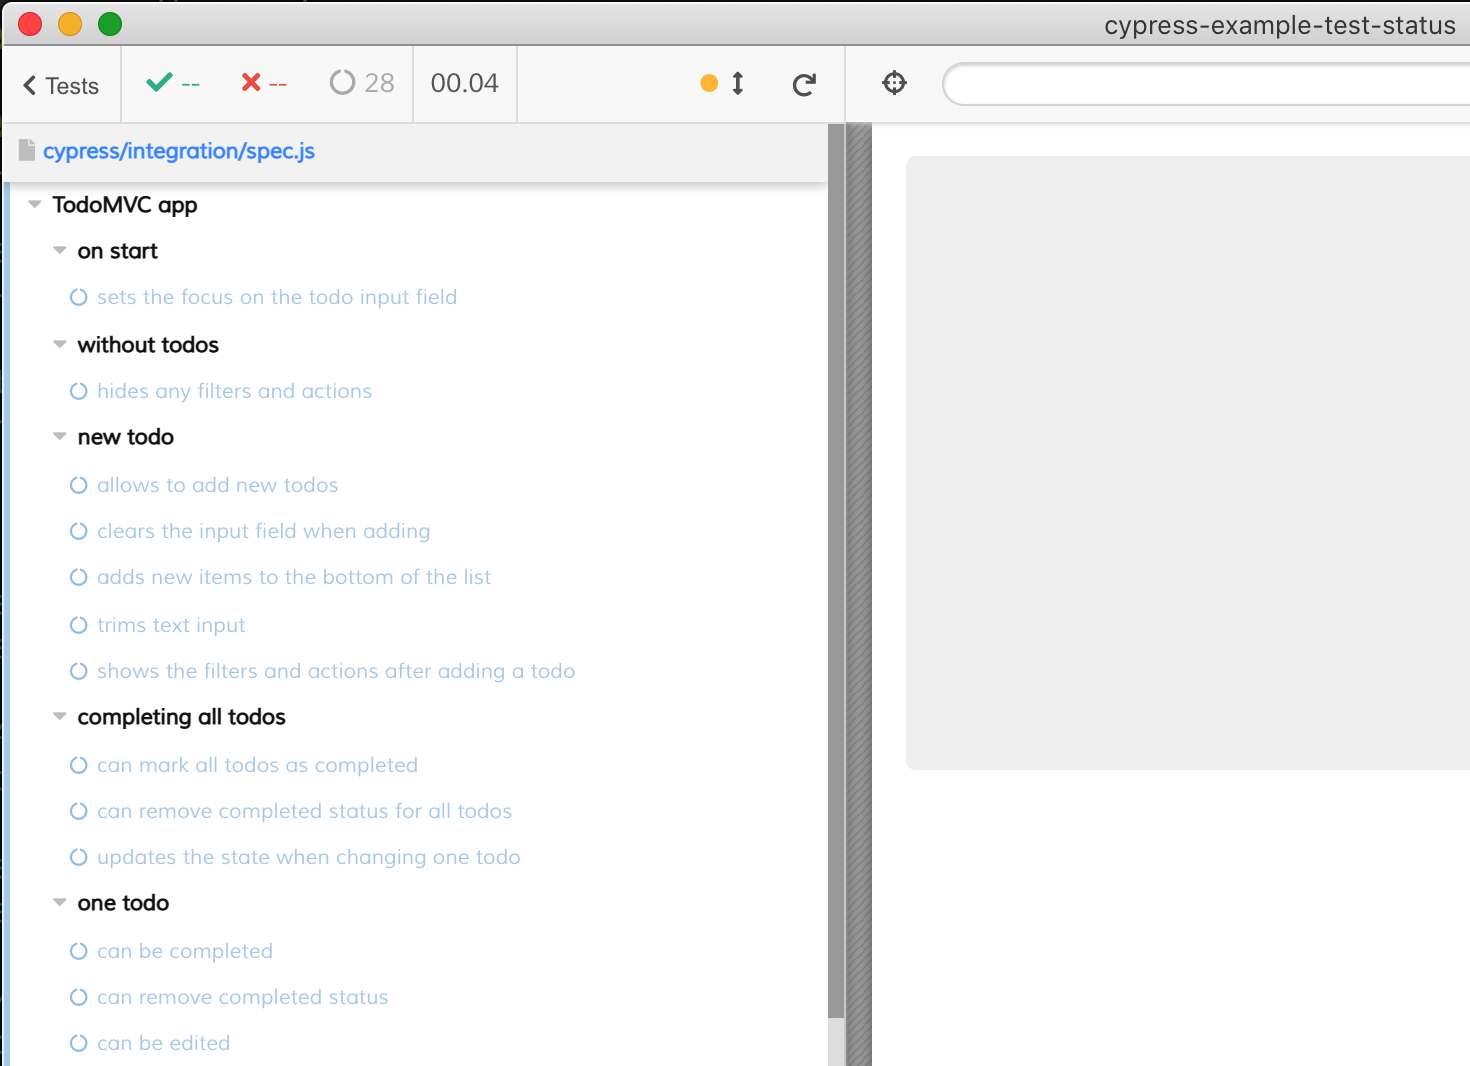
If you open this spec in Cypress, all 28 tests are shown as pending.
If you execute this spec in the headless mode using cypress run it shows the breakdown of tests by status:
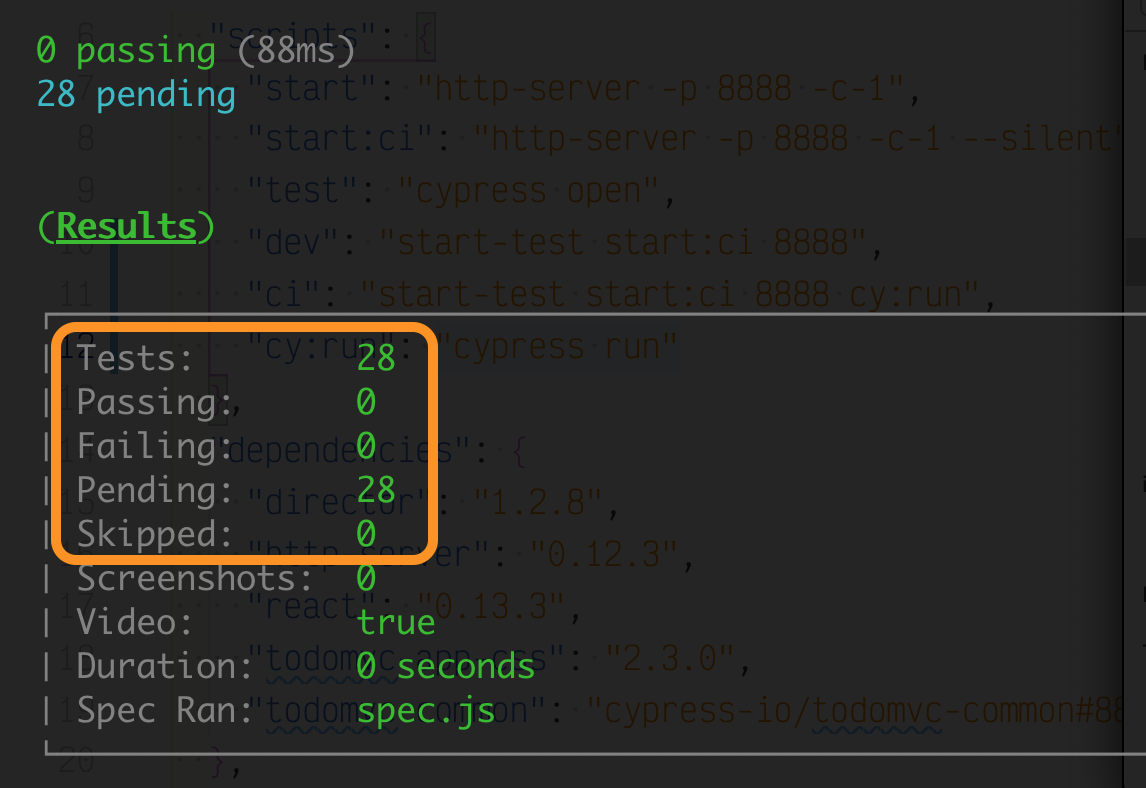
Nice - we plan to write a lot of tests to thoroughly test the application.
Start recording
We start with 28 placeholder tests, and now let's fill in the test bodies. We can incrementally test the most important features, and every pull request would drive down the number of pending tests and drive up the number of passing tests. You can use the "depth first" strategy where you write all the related tests for each context, or the "breadth first" strategy to write a few simple tests for each context first, before testing the edge cases.
Let's knock off a few simple tests in some contexts.
Before I start doing this, I will start recording the tests on Cypress Dashboard. You do NOT have to do this, of course. You can simply look at the number of pending tests at any time to see the test writing progress, or store the test artifacts yourself. Cypress Dashboard just makes it so much easier, and so much more visible when you work as a team.
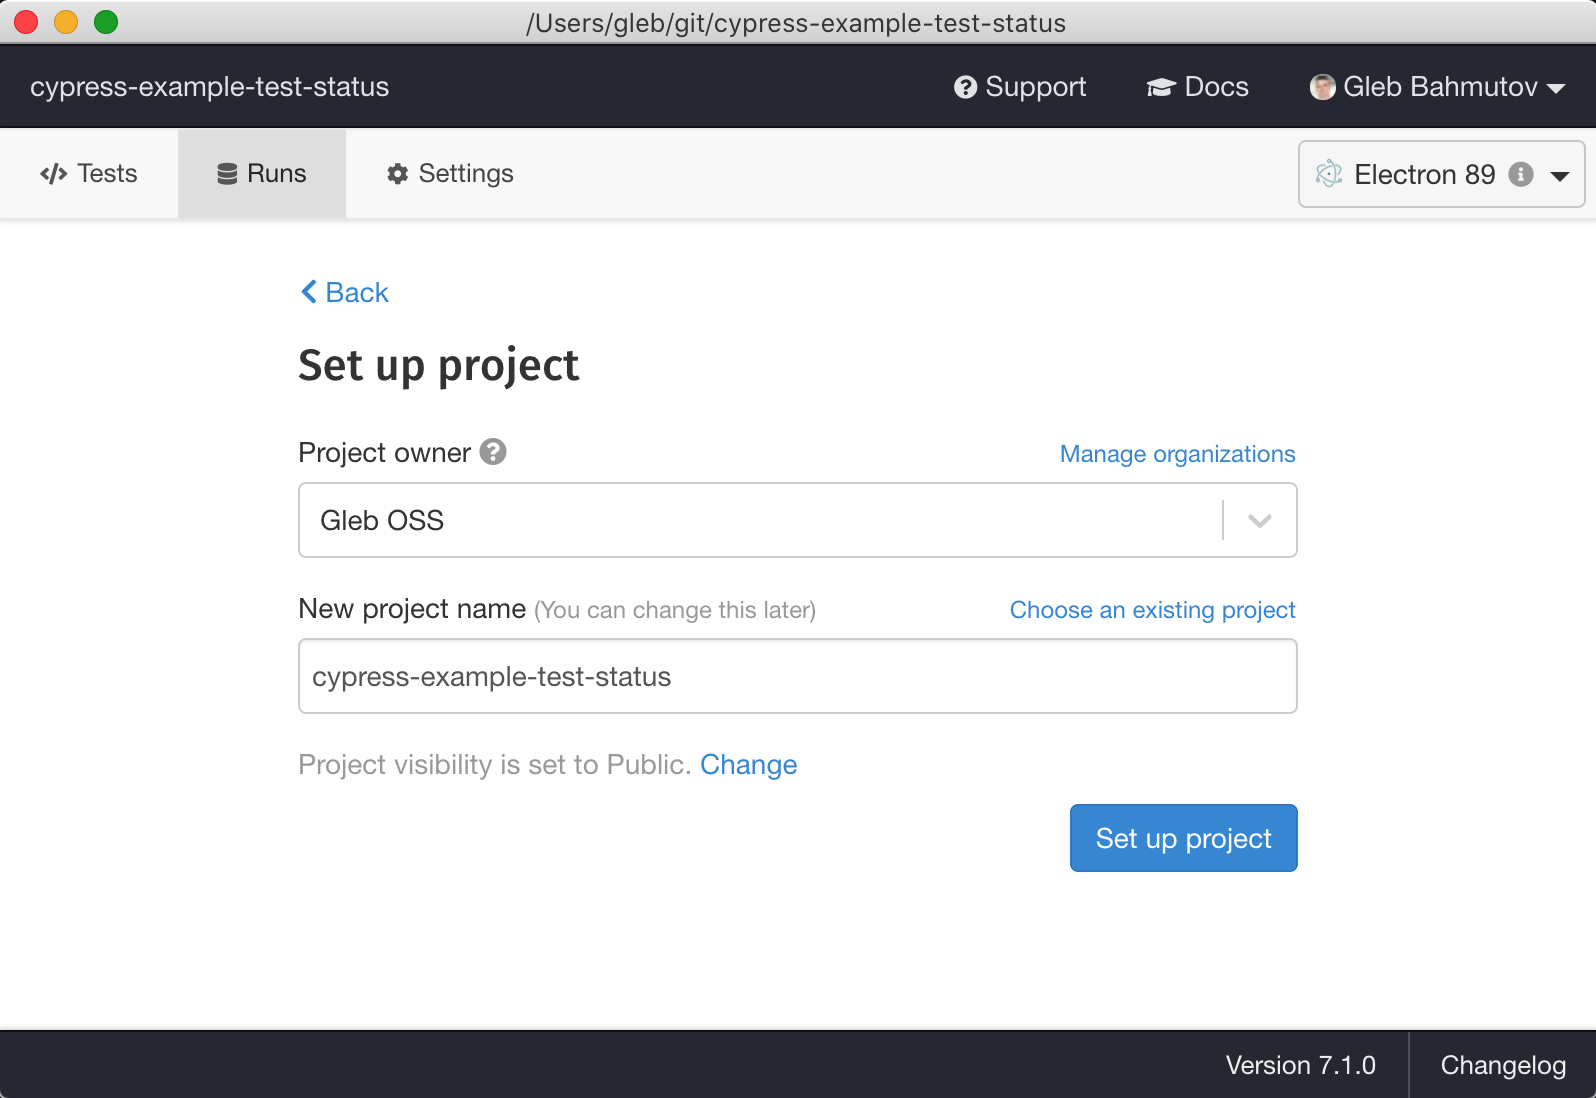
We can pass the created Cypress record key as GH secret when running the Cypress GitHub Action
1 | - name: Run E2E tests 🧪 |
You can find the Cypress Dashboard for the example project bahmutov/cypress-example-test-status at dashboard.cypress.io/projects/9g2jiu.
After the first GH Actions execution the Dashboard shows the passing and pending tests. That's our start baseline.

I think it is important to make these numbers as prominent and easily tracked as possible, as the team's goal is to implement all the pending tests.
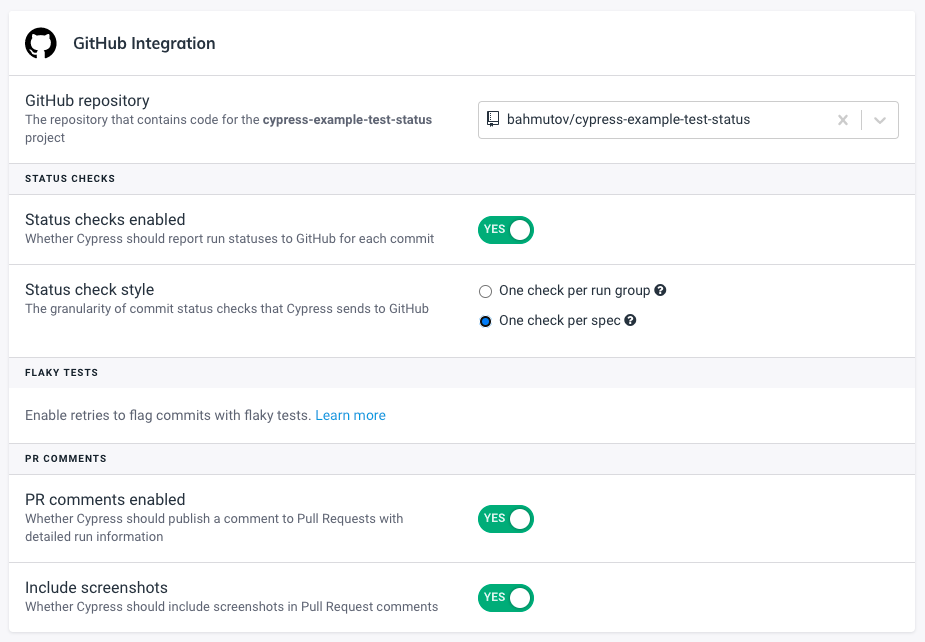
I will always enable the Cypress GitHub Integration for this repository. The integration will post the latest test counts for each pull request.
Write tests
Let's open a pull request with a few end-to-end tests implementations. We implement a few tests and watch them pass locally.
1 | /// <reference types="cypress" /> |

We can probably move cy.visit('/') into beforeEach hook, since every test probably needs to visit the site first.
When we open the first pull request the Cypress GH Integration application posts a comment with the test numbers. Good start - 3 tests are passing (1 smoke test plus two regular tests) and 26 pending tests to be implemented. I wish the PR comment had the "delta" numbers - how many tests were added / passing / pending compared to the main branch.
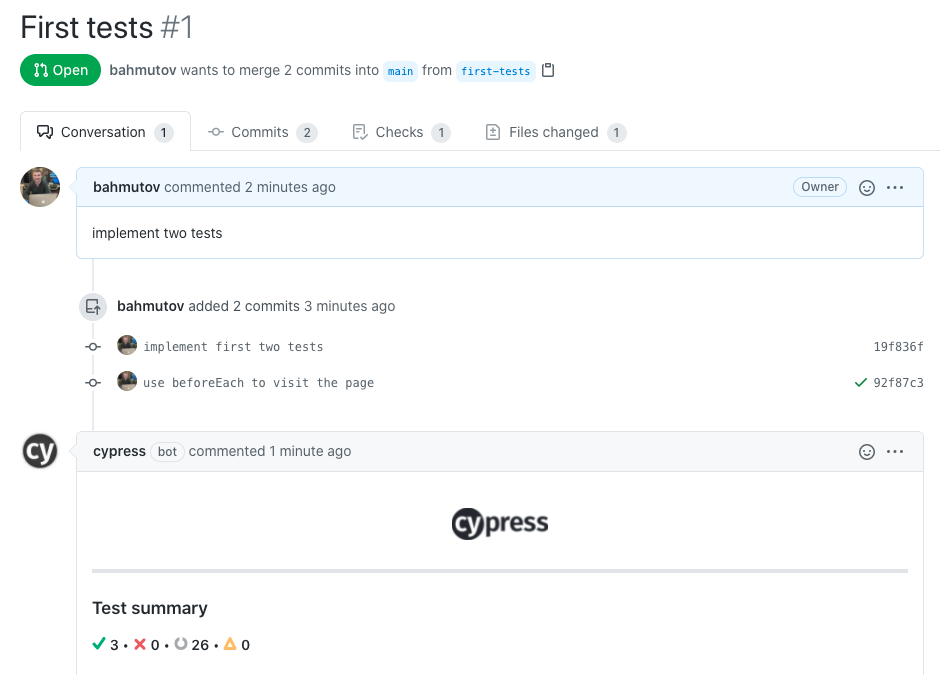
The tests pass, so let's merge the pull request.
As we write more tests, we can refactor the existing test code, creating utility functions.
1 | /// <reference types="cypress" /> |
We can use the createDefaultTodos function to quickly get a few Todo items to test the app features other than adding the new todos.
1 | it('adds new items to the bottom of the list', () => { |
Then we can implement the "complete all" suite of tests, providing the test bodies for these pending tests:
1 | context('completing all todos', () => { |
You can see the pull request #3 that drives the number pf pending tests down to 20.
The next pull request #4 implements completing the single todo tests
1 | context('one todo', () => { |
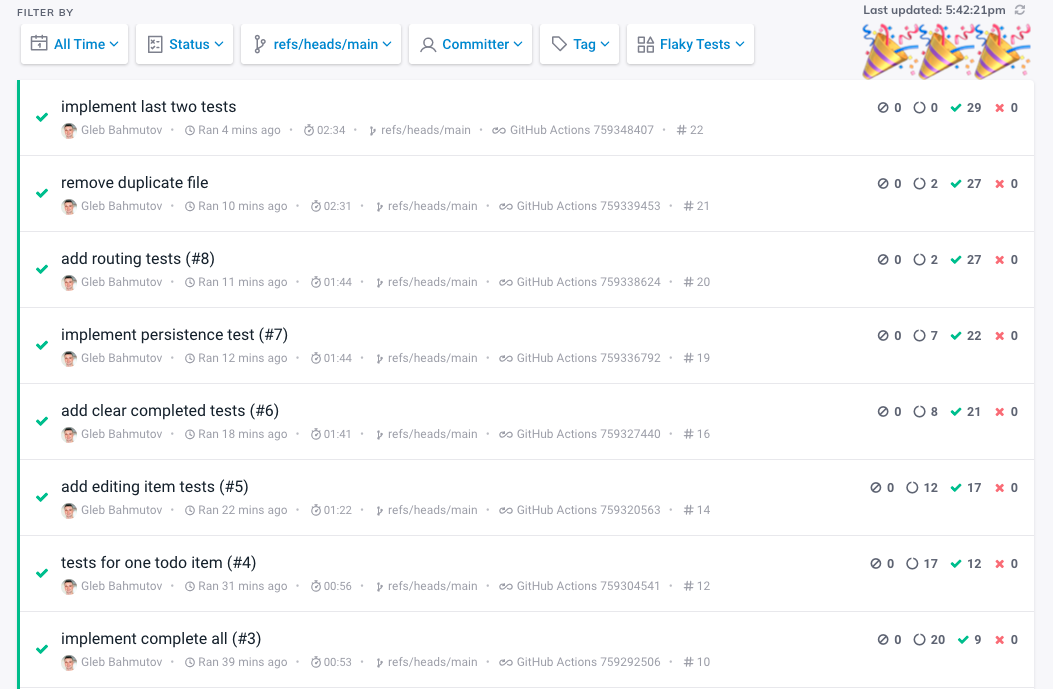
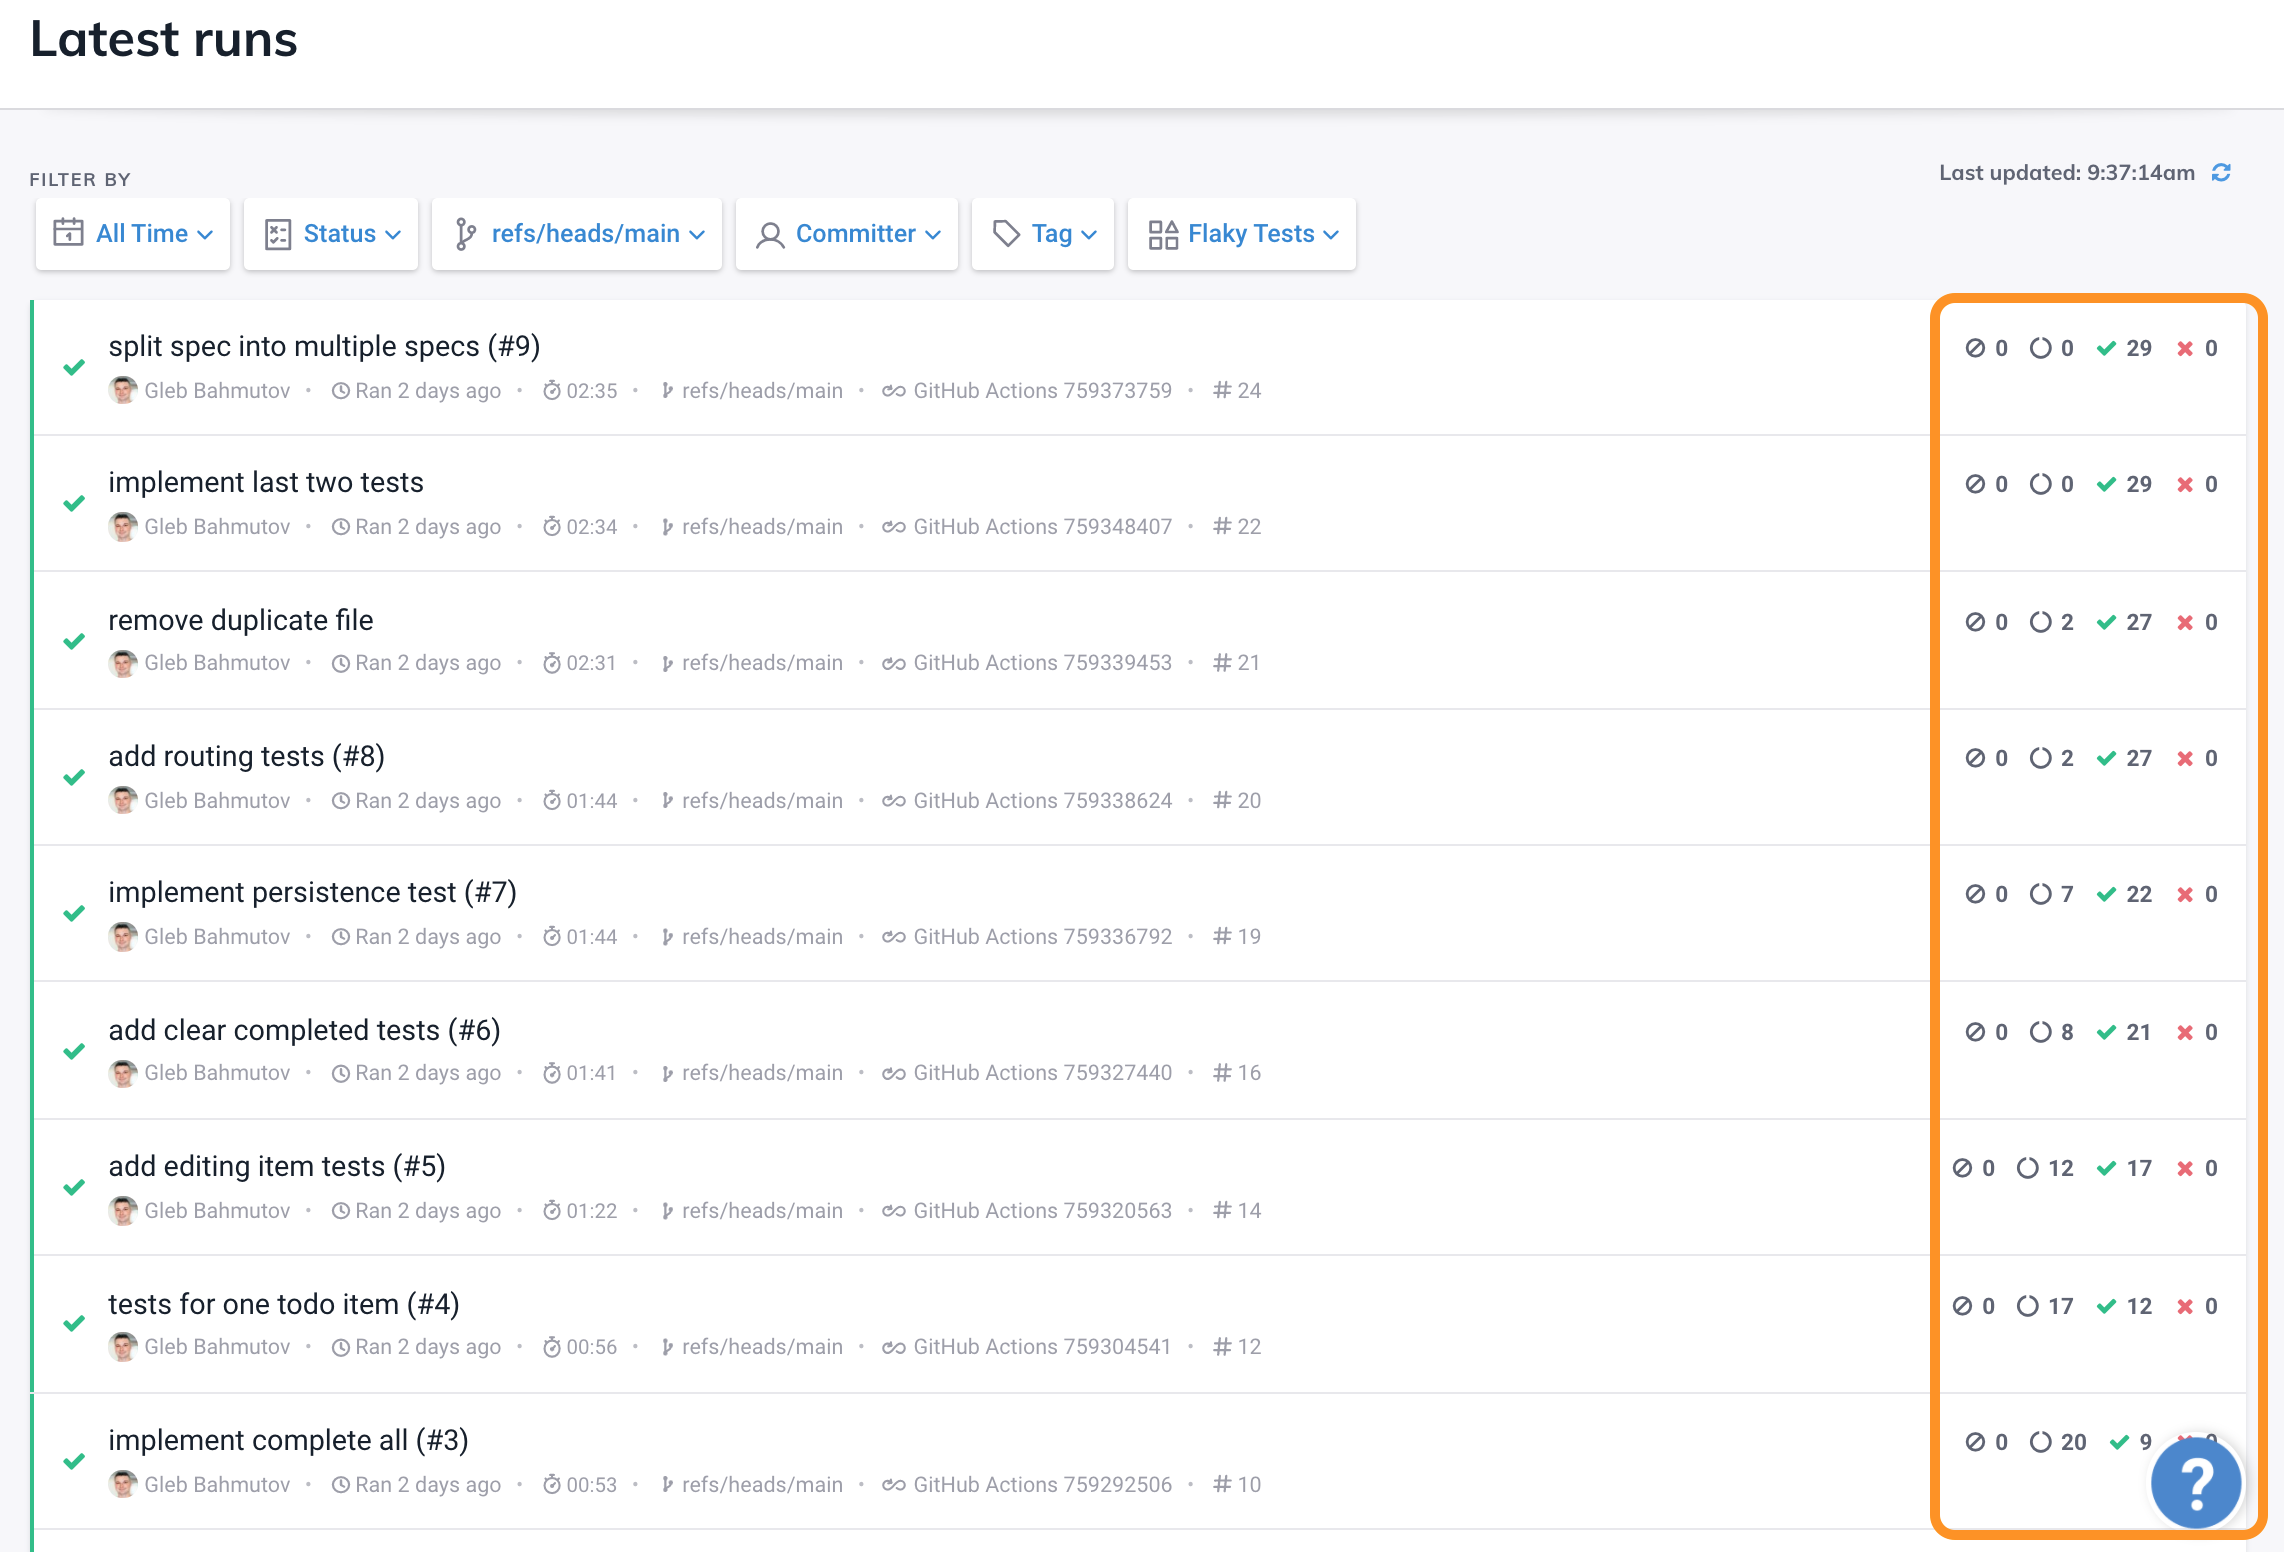
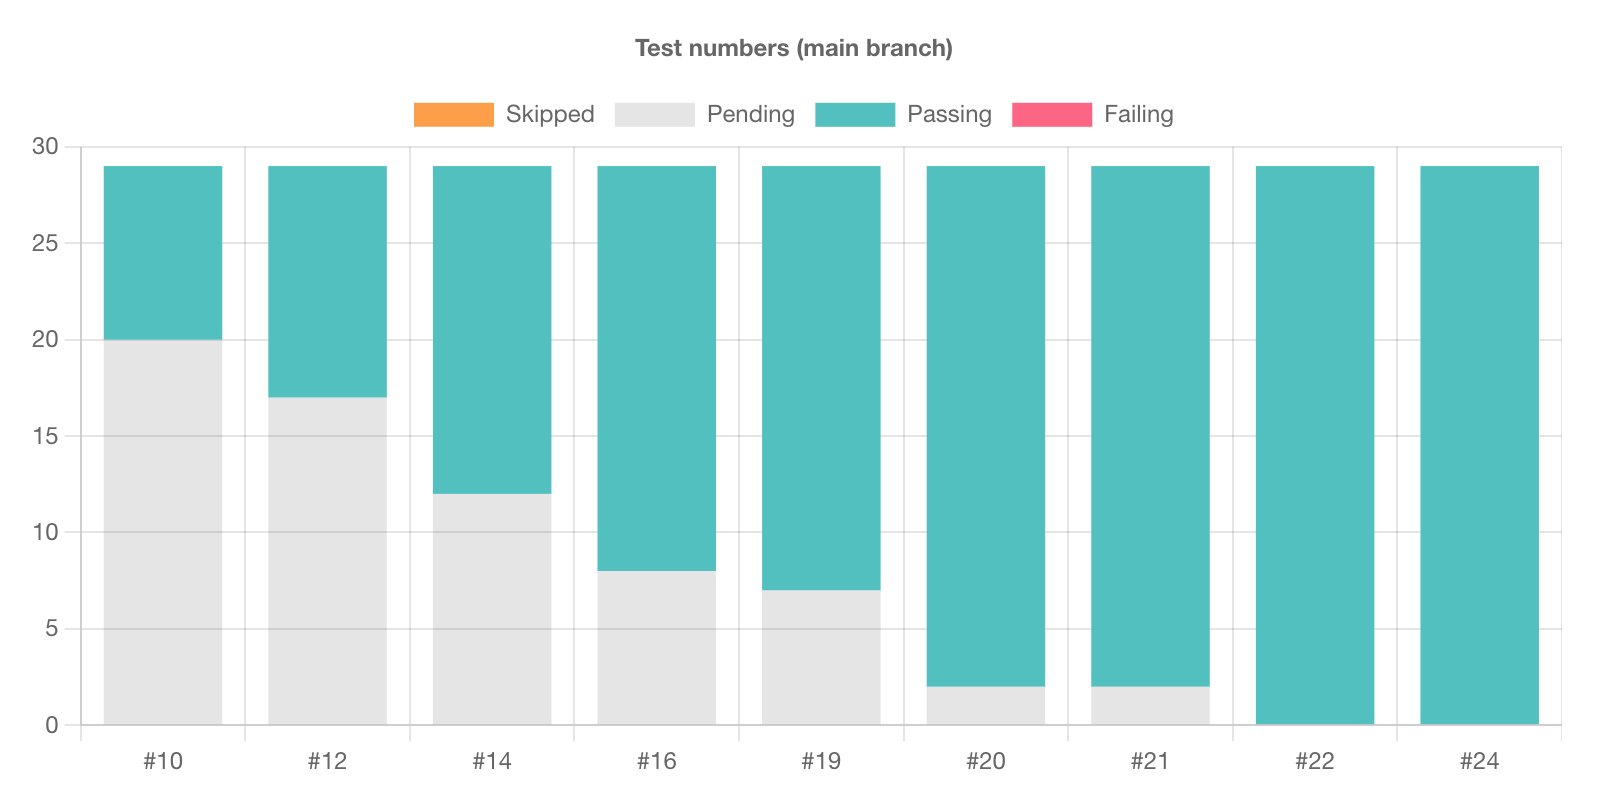
What we expect to see in the long term is the number of pending tests going down, and the number of passing tests going up.
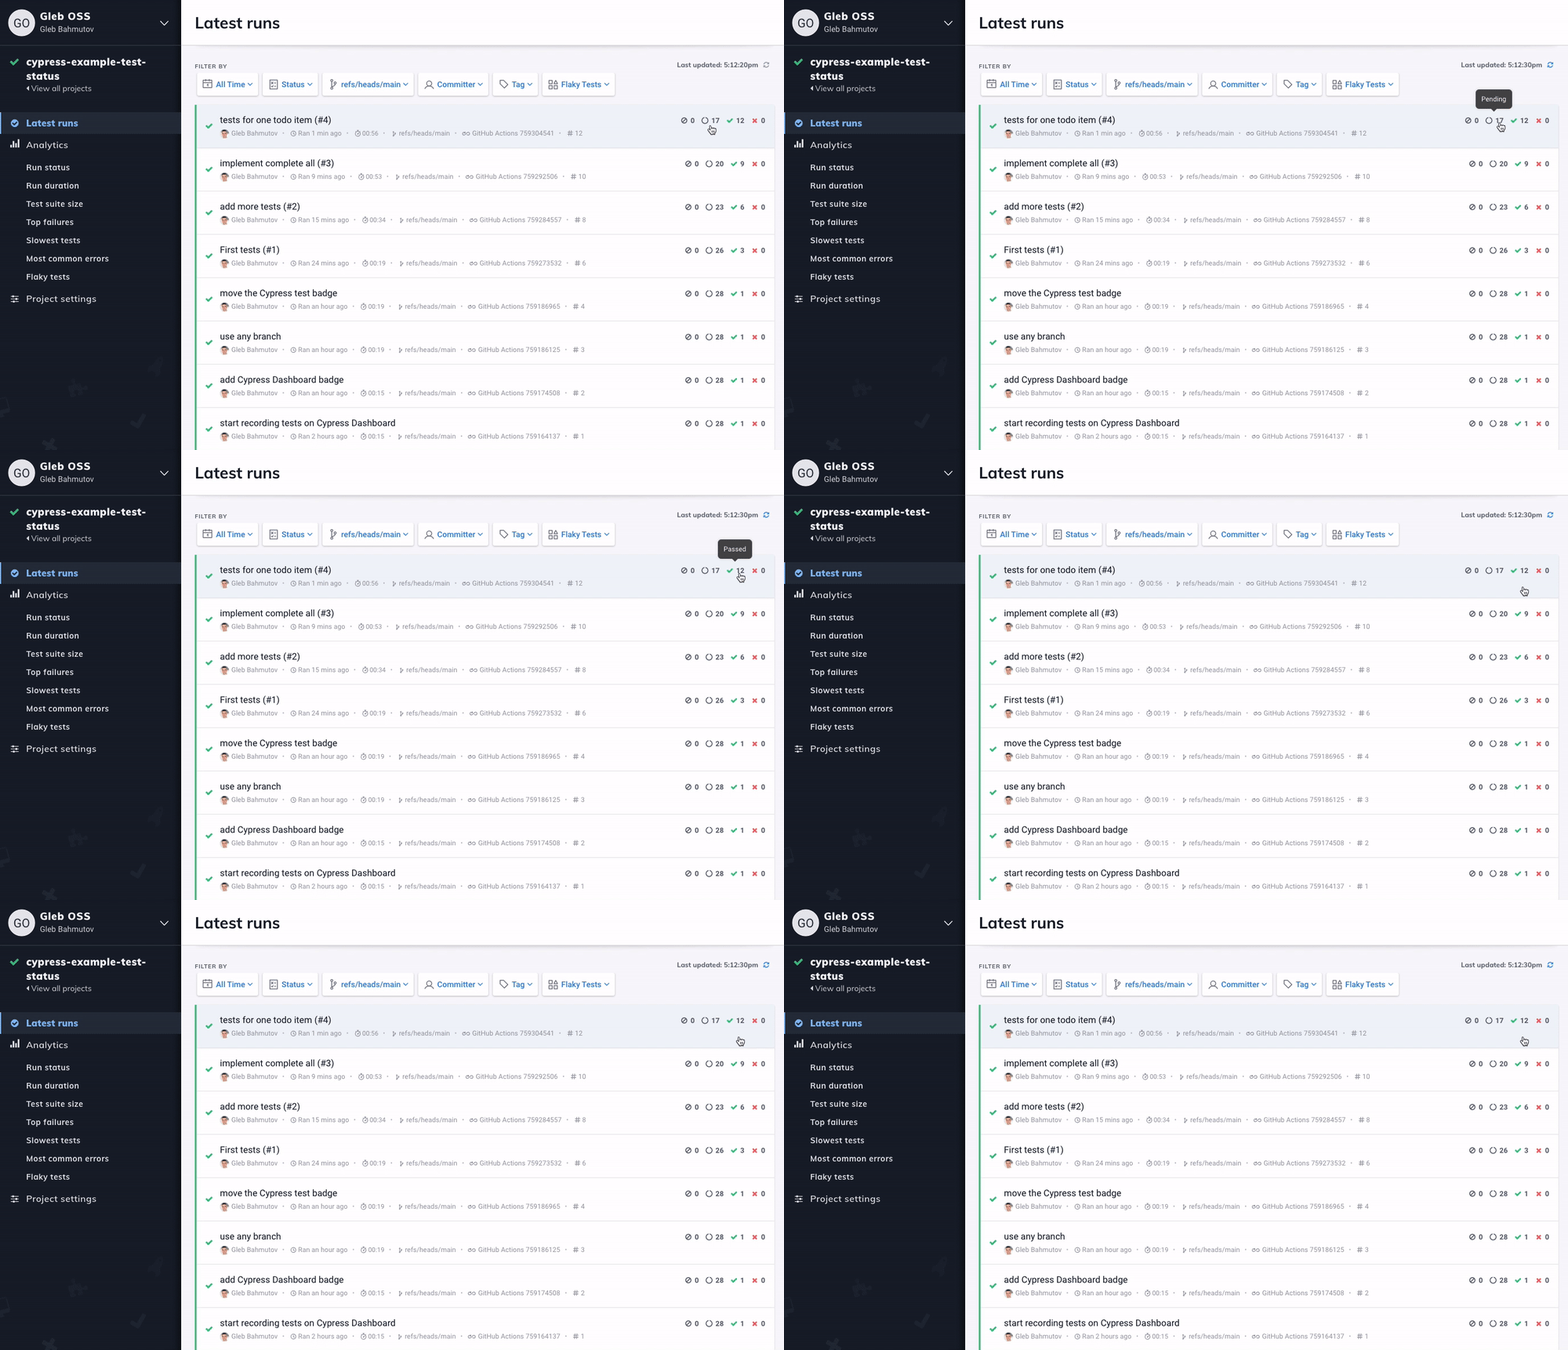
When the number of pending tests hits zero we know we have implemented all the tests planned.
Bonus 1: split into the separate specs
Once we have a lot of tests in a single spec file, it becomes unwieldy. We can move the test suites into separate spec files; potentially this will speed the test run if we want to run the specs in parallel. Read the blog post Split Long GitHub Action Workflow Into Parallel Cypress Jobs for details.
Our current integration specs folder can look like this:
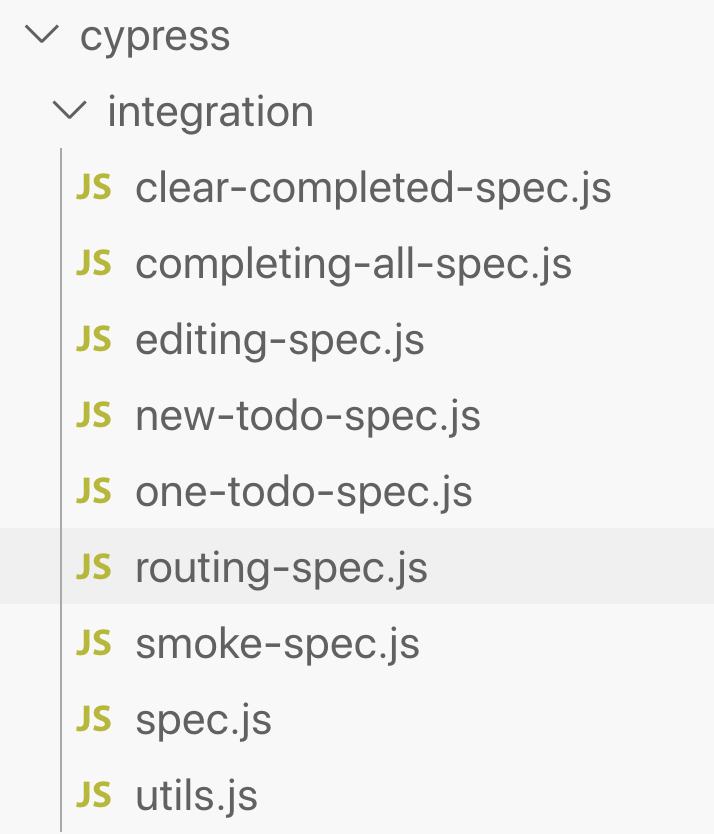
I have left only a few smaller tests in the spec.js file.
Because the utils.js file contains the utility functions like createDefaultTodos and no tests of its own, we can hide it from the Cypress test runner using the ignoreTestFiles list in the config file
1 | { |
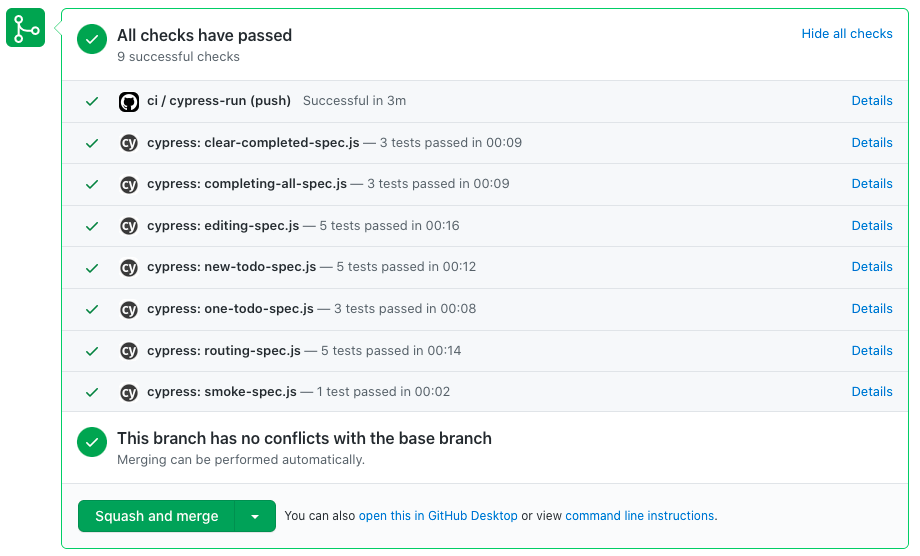
When splitting a single spec into multiple, I recommend setting the Cypress GitHub Integration to display a single status check per spec file. Then every PR has detailed information for every spec file.
Wish: show the test breakdown over time
I really would like to see the number of pending tests vs passing tests over time, probably per branch. Today I can look at the column of test numbers for the main branch to kind of see it.
But I would love to see it explicitly over time / over commits.
Hope the above analytics helps the project execute its testing strategy better.