- Application
- The test
- Iteration
- Recording to Cypress Dashboard
- Continuous Integration
- Load balancing
- See more
This blog post shows step by step how to execute the same tests for different browser time zone settings. Then I show how to correctly record all test results into the same logical Dashboard run. We then execute the tests in parallel on the continuous integration service to speed them up. The approach described in this blog post will be useful to everyone trying to run specs against different environments, or with different browser settings.
🧭 You can find the source code for this blog post in the repository bahmutov/test-timezones-example.
Application
Let's take a simple page that prints the local time.

1 | document.getElementById( |
The output depends on the browser's time zone, so how do run our tests "around the world"?
The test
Our test will just confirm the time zone text is present, we won't do anything more complicated than that.
1 | /// <reference types="cypress" /> |
We confirm the presence of the text and take a screenshot of the app. Because we plan to run the same test in multiple time zones, we add the time zone name to the file name (after remove the / characters).
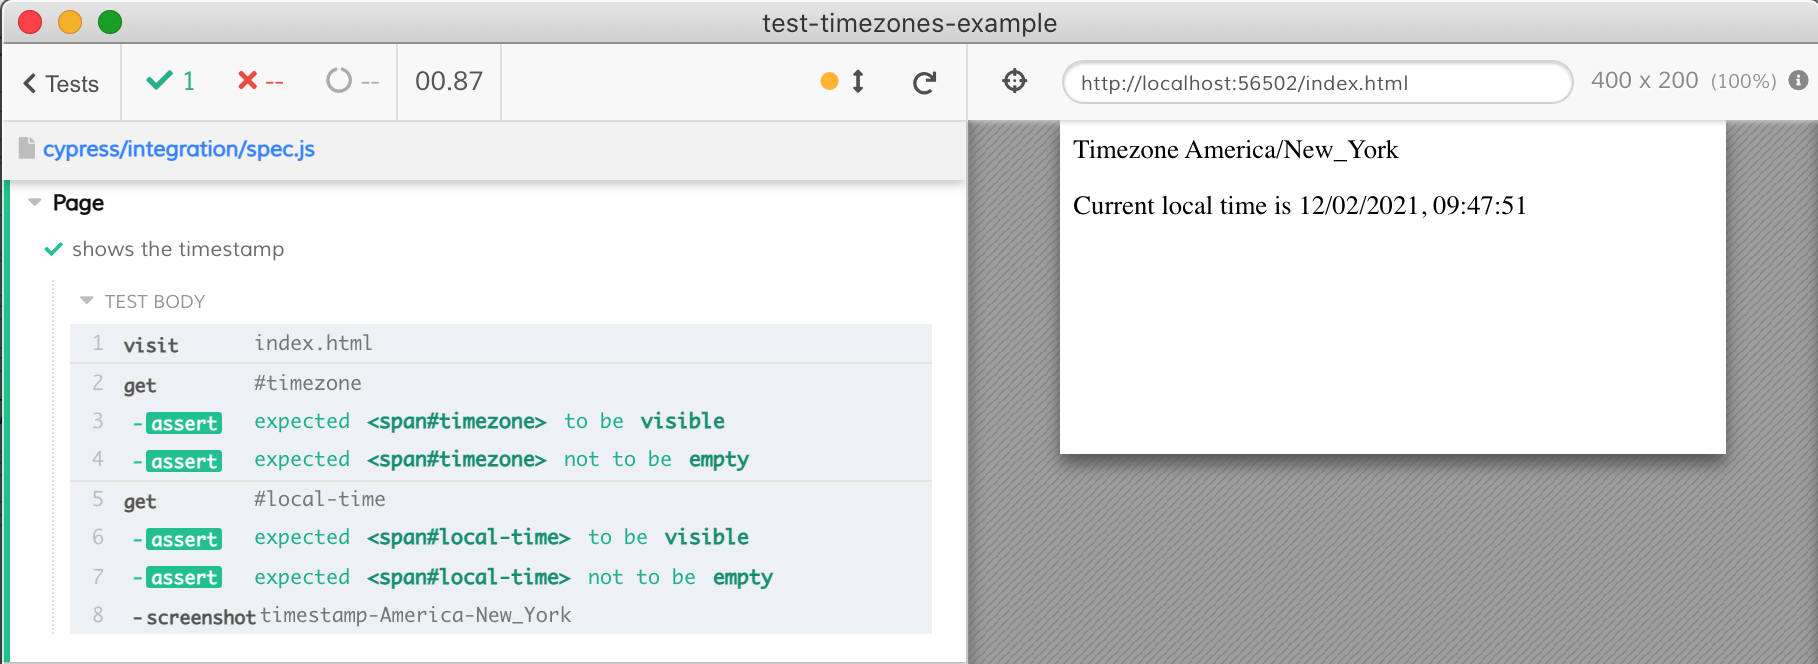
By default my laptop sitting in Boston executes the test and shows the following:
1 | npx cypress open |
How does this test run in Tokyo? Let's find out - on Mac / Linux open Cypress with TZ environment variable set to the desired time zone.
1 | TZ=Asia/Tokyo npx cypress open |
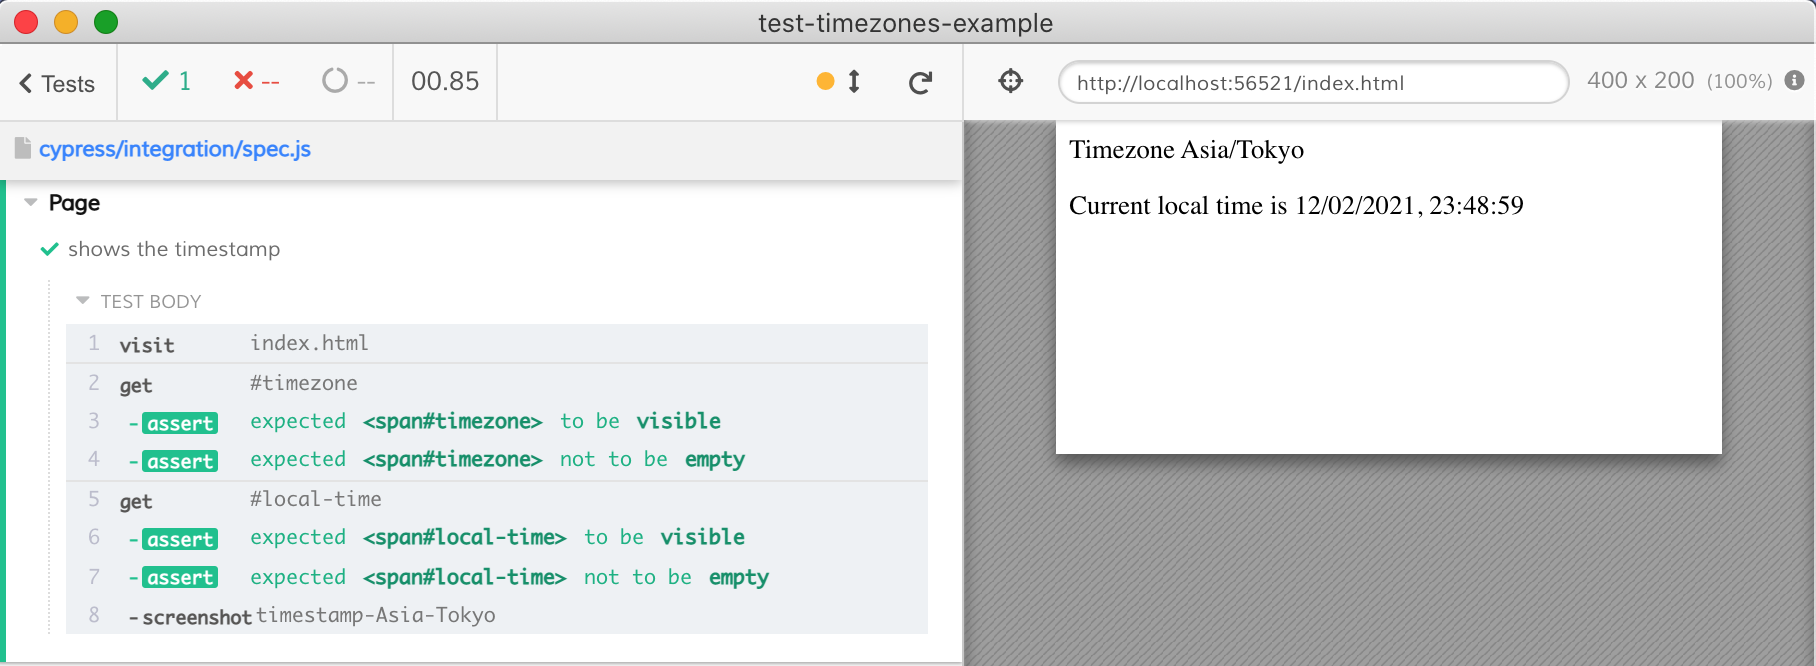
Nice, so we can vary the TZ value while running Cypress to get the browser to use the desired time zone.
Iteration
If we have a list of time zones, we can iterate over them and run Cypress tests with each time zone. We can write our code in JavaScript by using Cypress NPM module.
Incorrect TZ env
First, let me show the iteration that DOES NOT WORK. This script uses the env property of cypress.run to pass the time zone. This is INCORRECT.
1 | // we want to test the following timezones |
Let's launch the above script
1 | node ./test-timezones.js |
Hmm, we can see from the screenshots that all specs used the same America/New_York time zone, even though we have set the Cypress environment variable TZ:
1 | const runTests = (timeZone) => { |
When we call cypress.run({ env: { TZ: ... } }) to pass the time zone, it is NOT the same as setting the process environment variable before launching the child browser process. cypress.run({ env: ... }) simply passes the variable values and populates the Cypress.env object.
Correct process.env
Thus we need an alternate approach. When Cypress launches the child browser process, it inherits the parent's environment variables. Thus we simply need to change the process.env.TZ before running Cypress!
1 | const runTests = (timeZone) => { |
Let's run the tests
1 | node ./test-timezones.js |
Super, the time zone is set correct for every test run.
Do not delete the screenshots
Hmm, the test run correctly, but we only have the screenshot from the last run
1 | ls cypress/screenshots/spec.js/ |
Cypress removes cypress/videos and cypress/screenshots before its run, but we do not want that. We want to preserve all screenshots from all test runs. Thus we need to tell Cypress to keep the test artifacts:
1 | const runTests = (timeZone) => { |
1 | $ node ./test-timezones.js |
If we want, we can delete the cypress/screenshots and other folders from our test-timezones.js script ourselves.
Recording to Cypress Dashboard
Let's set our project to record test results to the Cypress Dashboard. From the Cypress screen click "Runs" tab. I picked the organization and set the project's visibility to public.
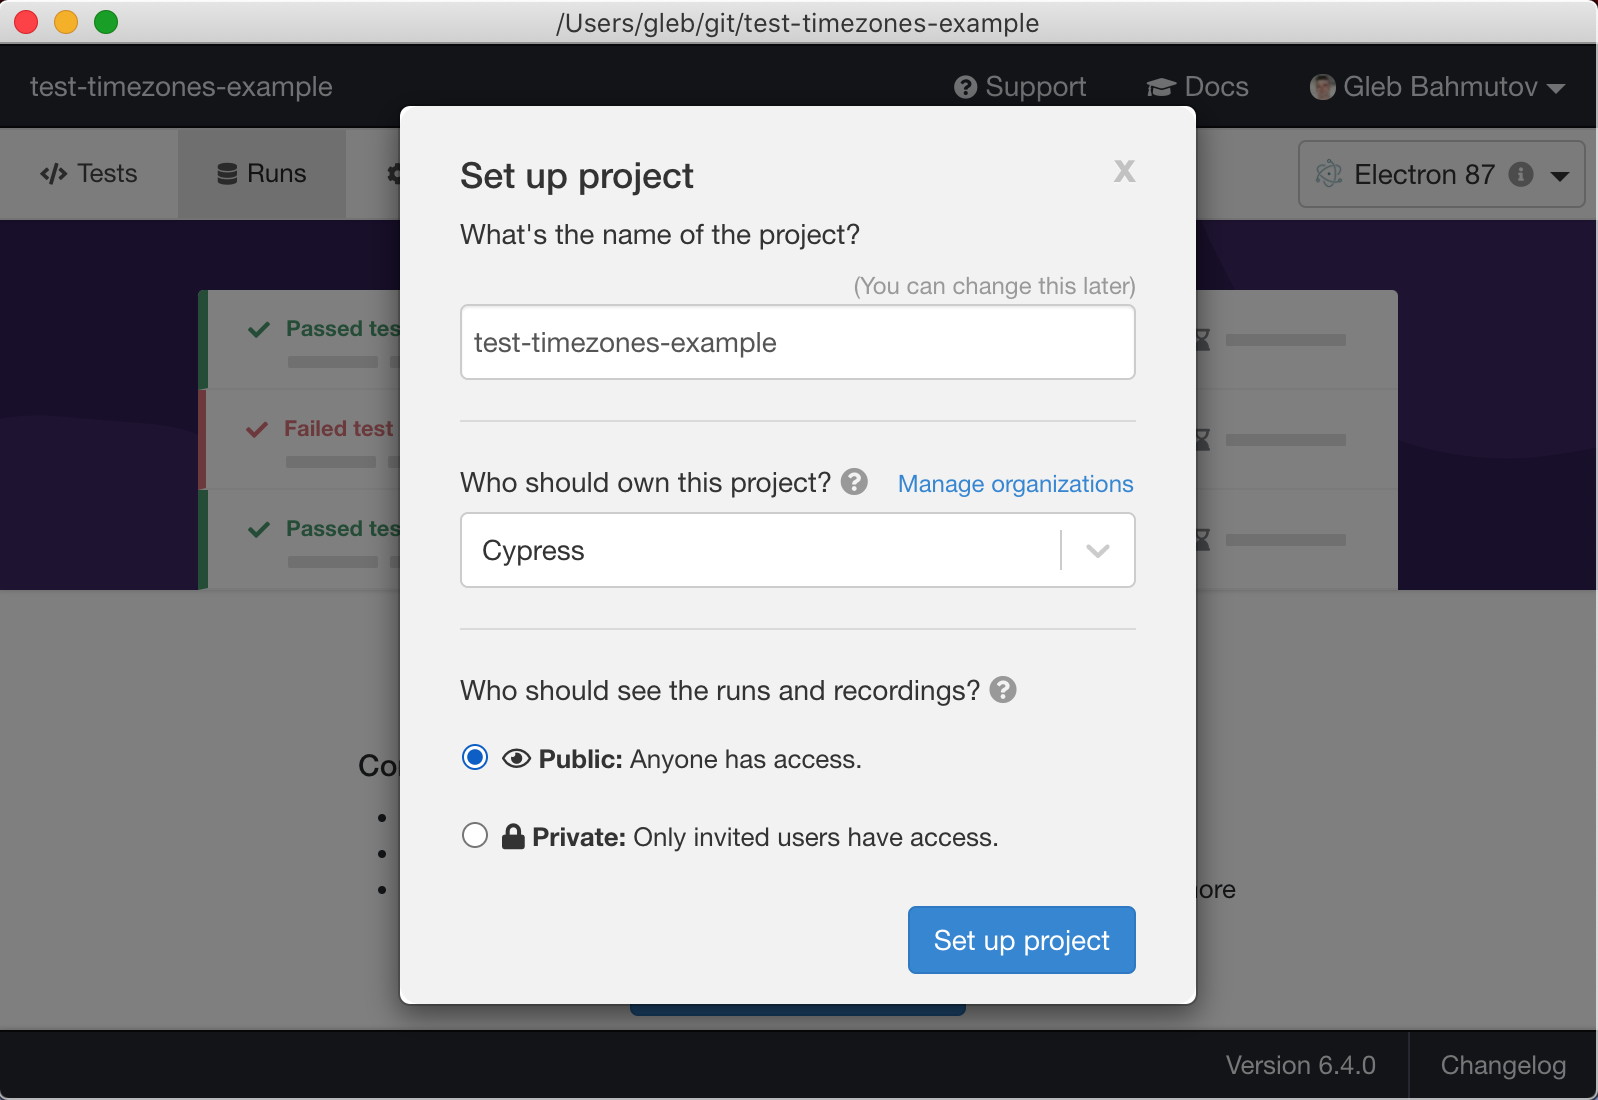
👀 You can see the Cypress Dashboard for this project here
The next screen gives me the CYPRESS_RECORD_KEY value - I should keep it secret. Because I want to record to the Dashboard from my local laptop first, I will use as-a utility. I added another section to the local hidden file ~/.as-a/.as-a.ini for my current project:
1 | [test-timezones-example] |
Let's change the test-timezones.js to record test results.
1 | const runTests = (timeZone) => { |
I will run the script with CYPRESS_RECORD_KEY set as environment variable from my local laptop
1 | as-a test-timezones-example node ./test-timezones.js |
Nice, Cypress shows the tests being record on the dashboard by showing the run URL

Unfortunately, every new cypress.run call creates its own run on the Dashboard. Four time zones generated four separate recorded runs.
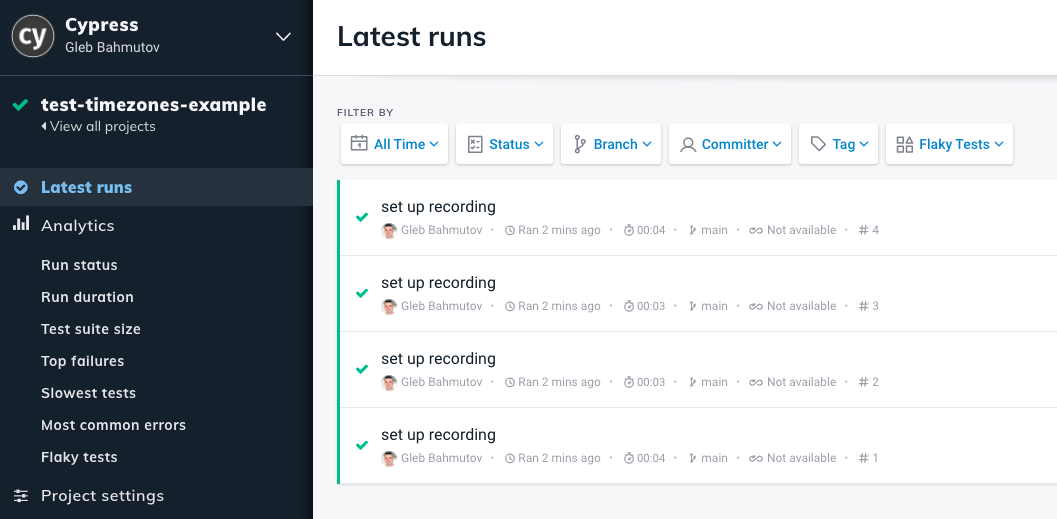
Cypress Dashboard has no idea that you want to group all these separate cypress.run results into a single logical run. But we can certainly do this - by providing the same ciBuildId for these runs. For example, the local timestamp would be a good unique ID we could use. We should also distinguish the separate test groups inside the single run by using the group parameter - the time zone itself would be a good group name.
1 | const cypress = require('cypress') |
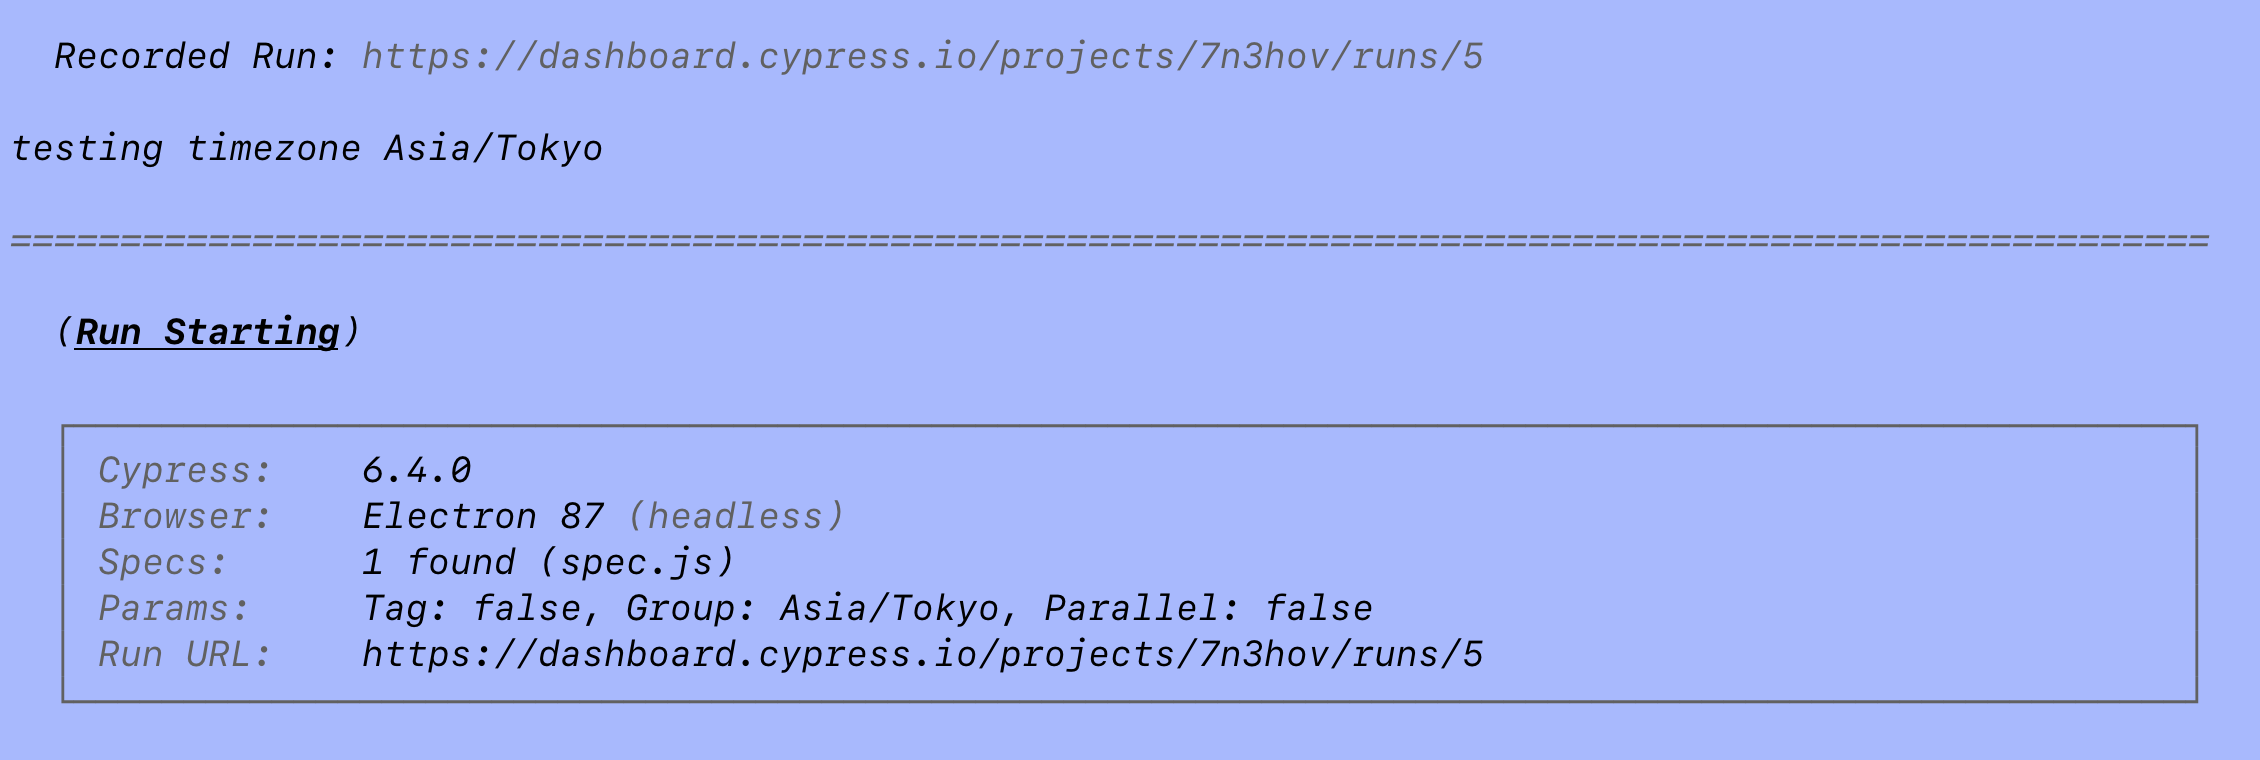
Super, now all test go into the same logical Dashboard run #5, as the end of the terminal output shows.
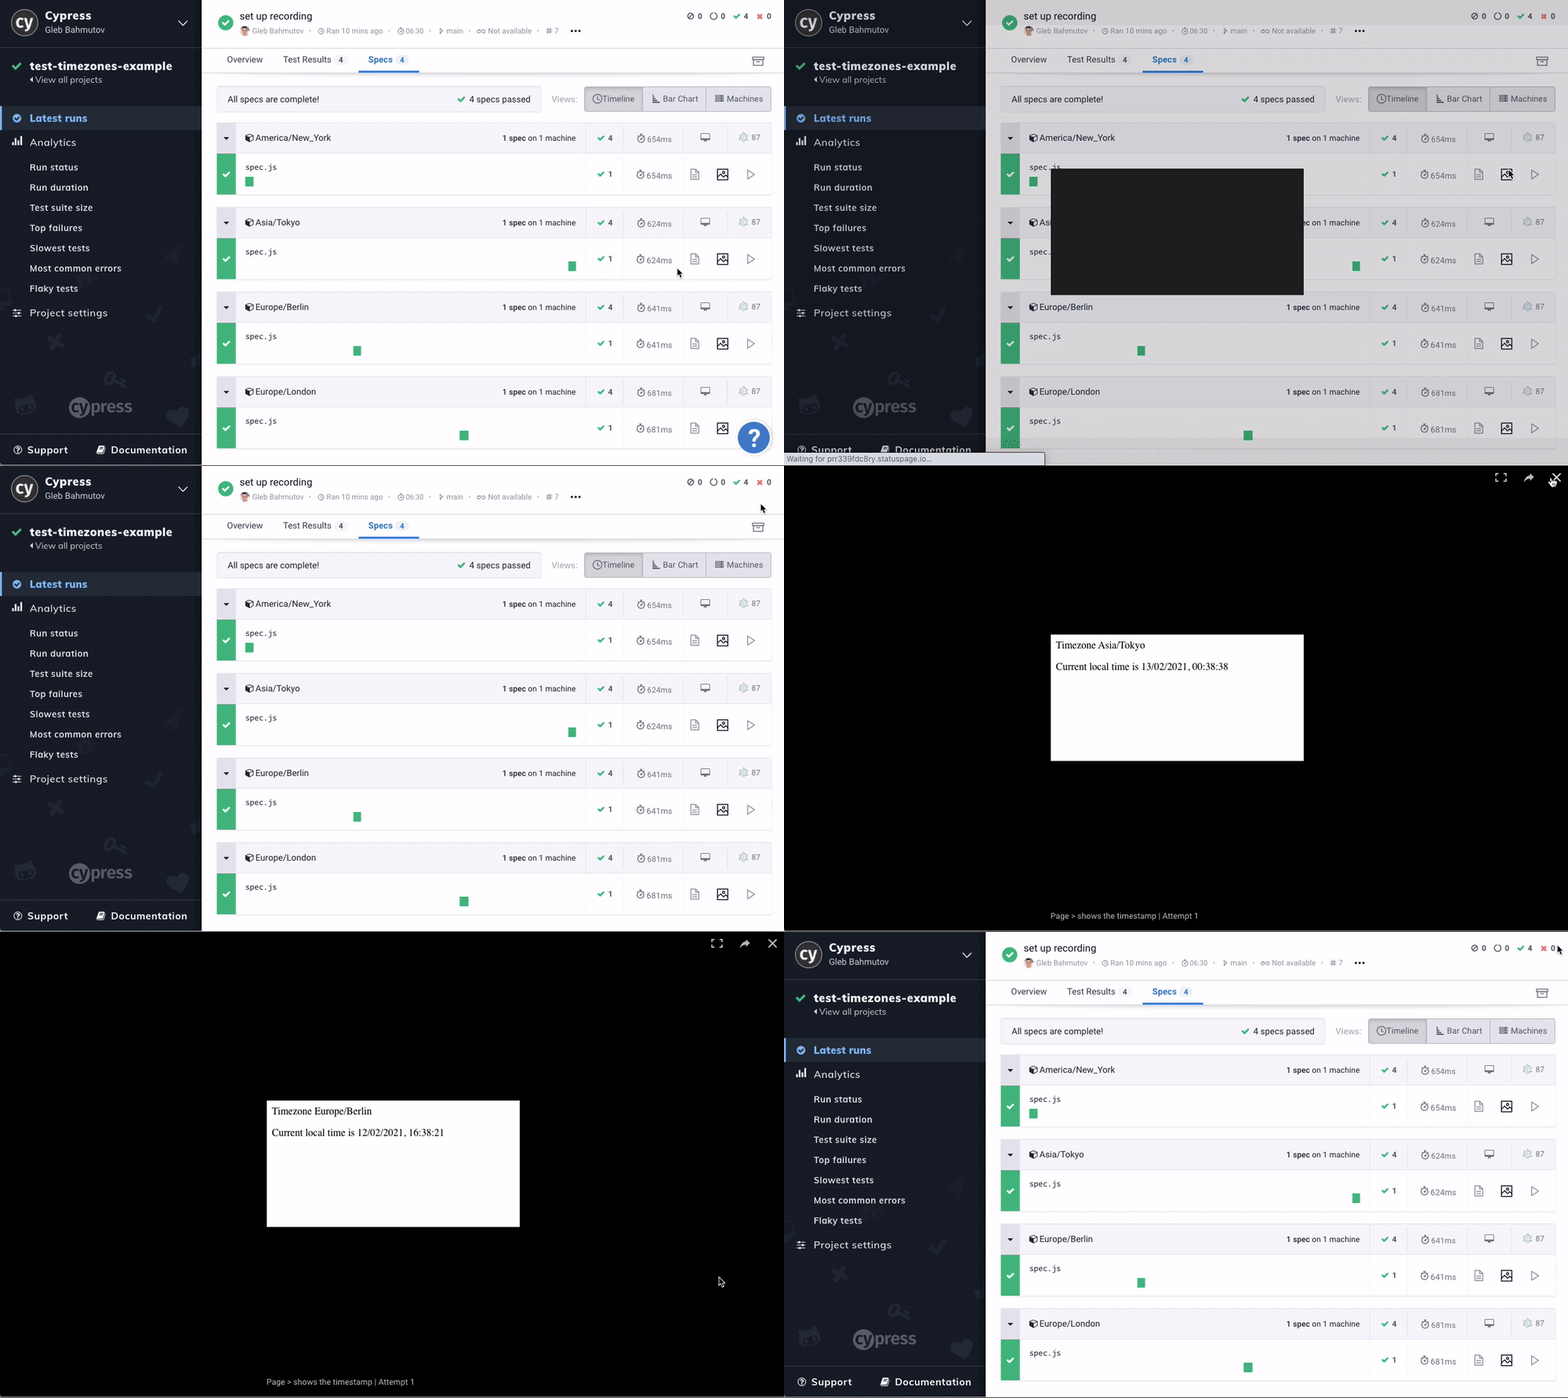
We can see the 4 groups of tests and inspect the uploaded screenshots from the Dashboard. Notice the different timestamps shown in the local time zone.
Continuous Integration
Of course, we want to run these tests on CI, instead of my local laptop. I will set up GitHub Actions to run the tests by using cypress-io/github-action.
1 | name: e2e |
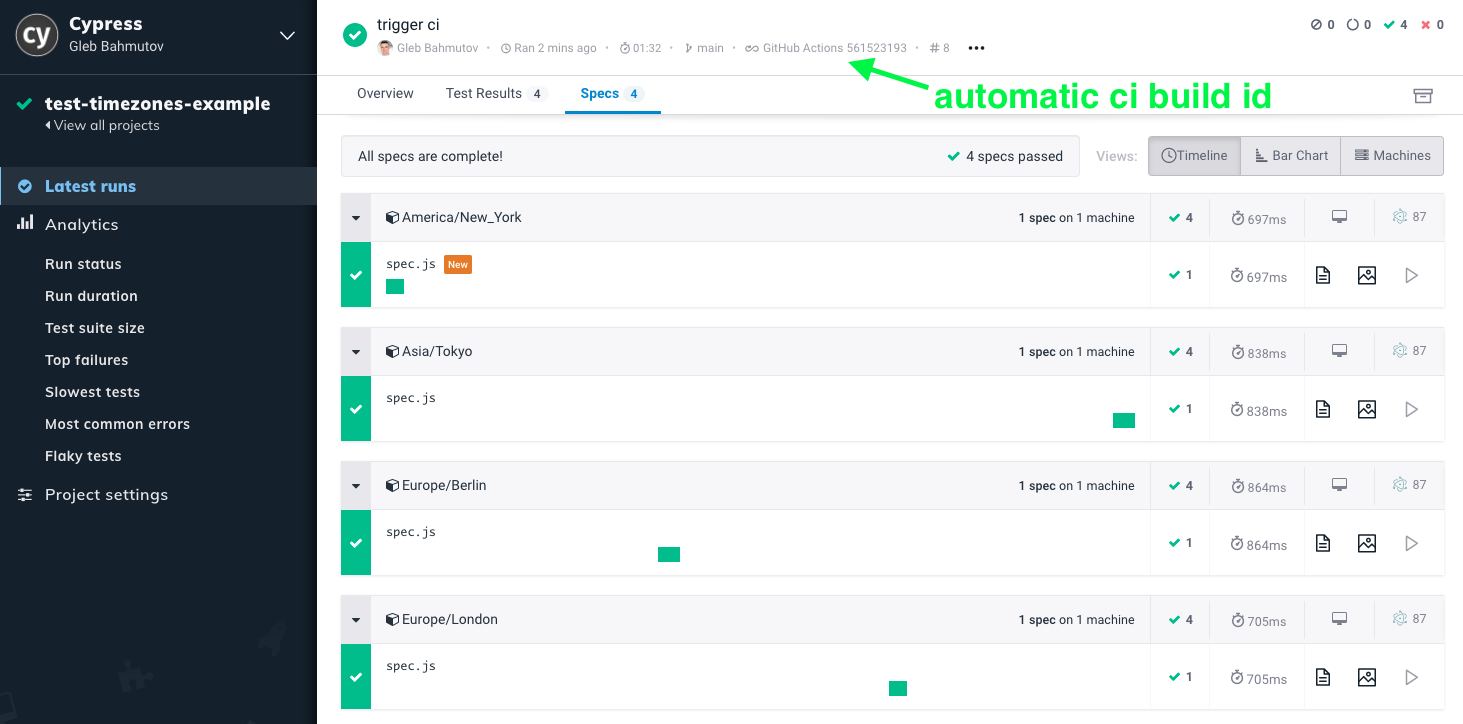
I will need to set the CYPRESS_RECORD_KEY in the project's settings on GitHub to be able to record. But I do not need to use the timestamp to link the separate cypress.run calls into a single logical recorded run - because Cypress automatically uses an appropriate CI variable. Thus my test script can set the ciBuildId only when not running on CI:
1 | const cypress = require('cypress') |
GitHub Actions executes the workflow and records the test results to Cypress Dashboard
Load balancing
Now imagine our application grew and we have more end-to-end tests, and each test takes longer to run. We simulate this by addding cy.wait(10000) to our test and by cloning the spec file several times.
1 | /// <reference types="cypress" /> |
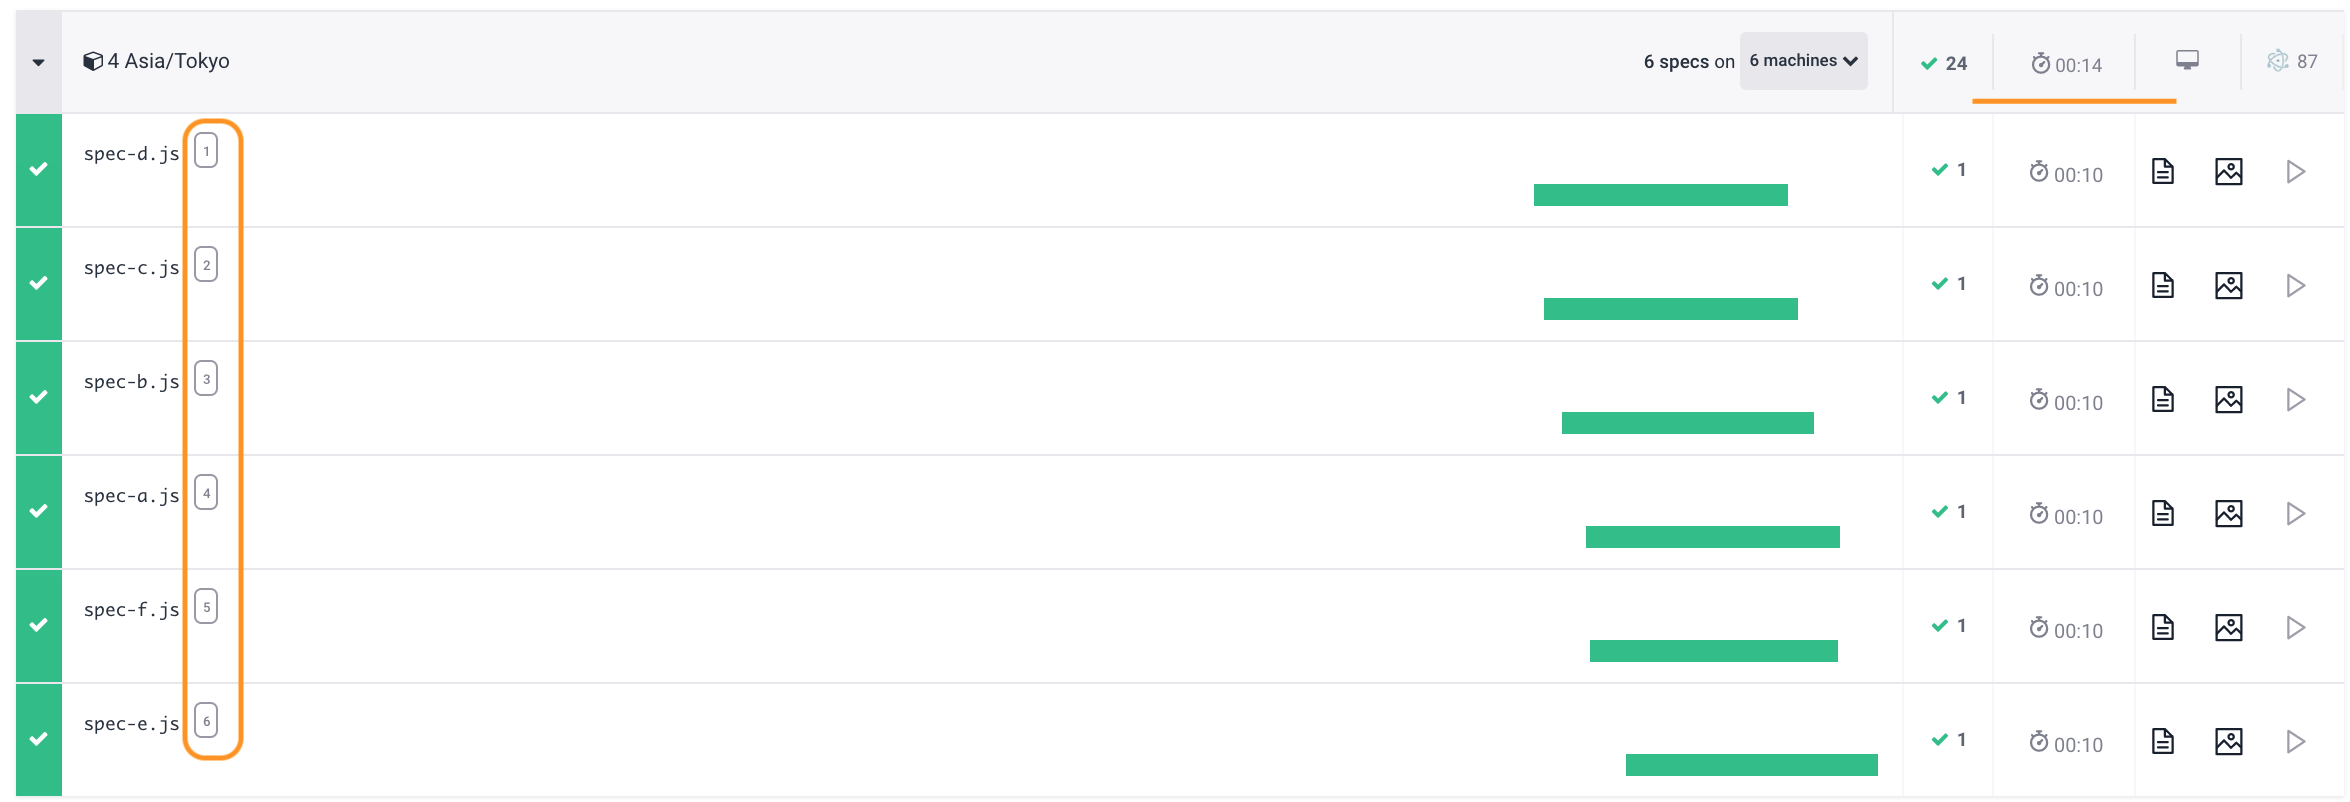
Now we have to wait for single CI machine to go through each time zone and then run every spec file one by one ... The Dashboard clearly shows the waterfall of specs being executed one by one (I had to zoom out a lot of show 4 time zone groups with 6 specs in each group)
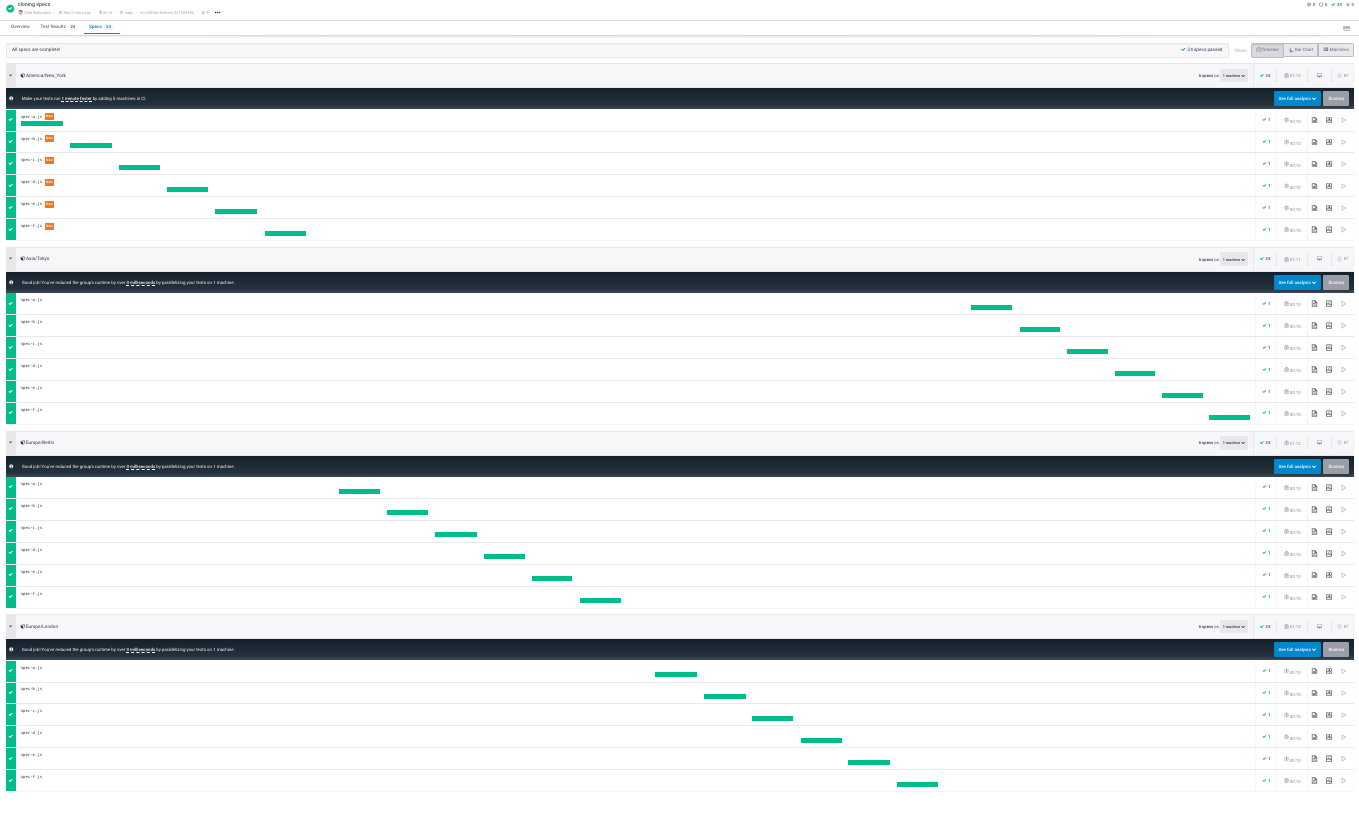
Tip: it helps to prefix group name with an index to arrange them in order on the Dashboard
1 | let index = 0 |
Now the groups are shown in the Dashboard in their order of execution
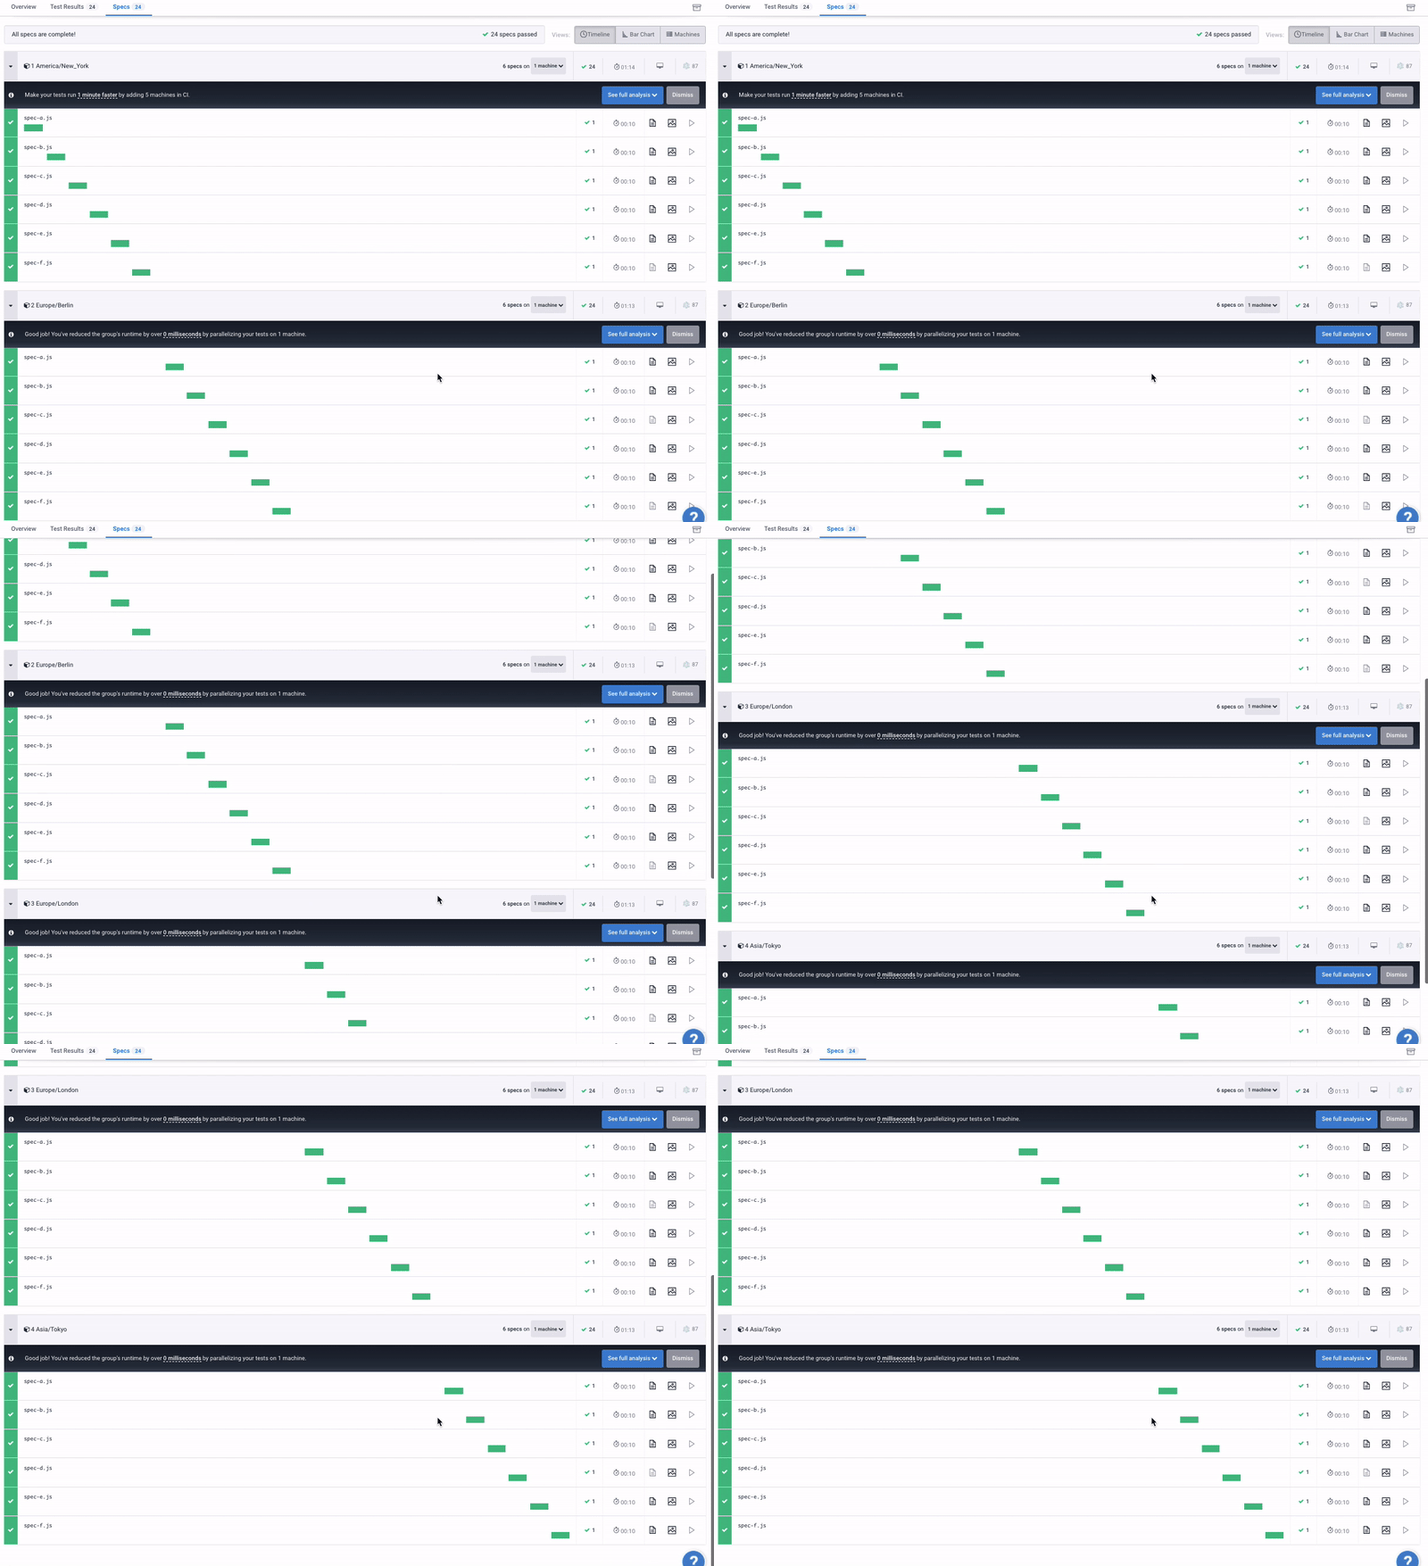
Let's execute the specs for each group in parallel!
Parallelization
Cypress Dashboard provides parallelization where multiple Test Runners can join the single logical run and split the specs amongst themselves. The dashboard API tells each Cypress Test Runner the next spec to run. Let's update our test script:
1 | return cypress.run({ |
We only needed to add parallel: true to the cypress.run({ }) options - that's it. The specs in each group will be split amongst multiple CI machines automatically.
Tip: when running the same script parallel: true would not make much difference, since only a single machine is running.
We need to spawn several CI containers to load balance our specs. On GitHub Actions we can use the strategy: matrix to do this following the parallel example. Our updated workflow file is:
1 | name: e2e |
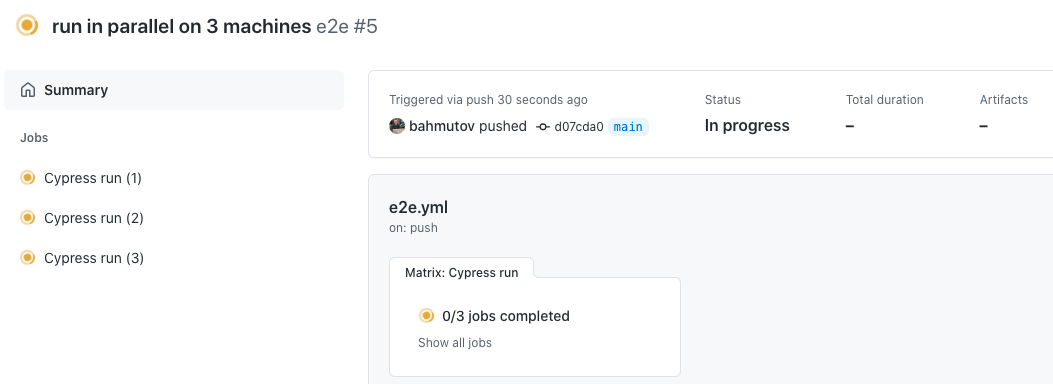
Let's push the code - GitHub UI shows the 3 machines running our code as part of the job
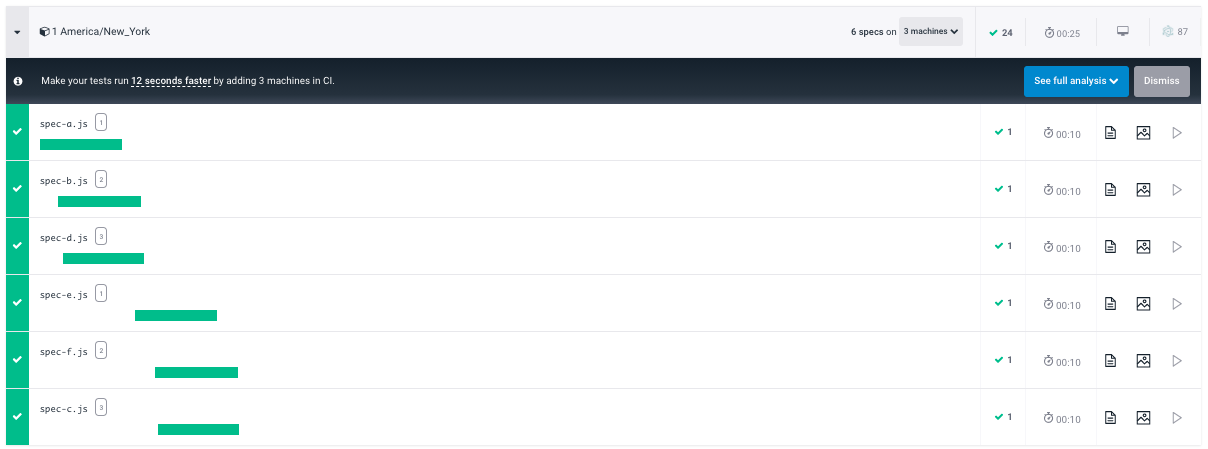
Each group on the Dashboard shows how the specs are executing in parallel, notice the "1", "2", and "3" indices of the machines participating in the group.
Use more machines
Want an even faster run? Click on the parallelization calculator button to see the projected time savings for different number of machines.

Each group cannot run faster than its longest spec, and there are only 6 specs - thus the fastest we can get is to bring 6 machines into the mix. Let's do it.
1 | matrix: |
And push the code again.

Our run time has dropped further. Let's drill down into individual spec timings using the Dashboard chart. As you can see, the very first group 1 America/New_York had 5 machines execute the tests - the 6th machine did not join the group in time. Thus the very first machine had to execute two specs, and the total group duration was 22 seconds.
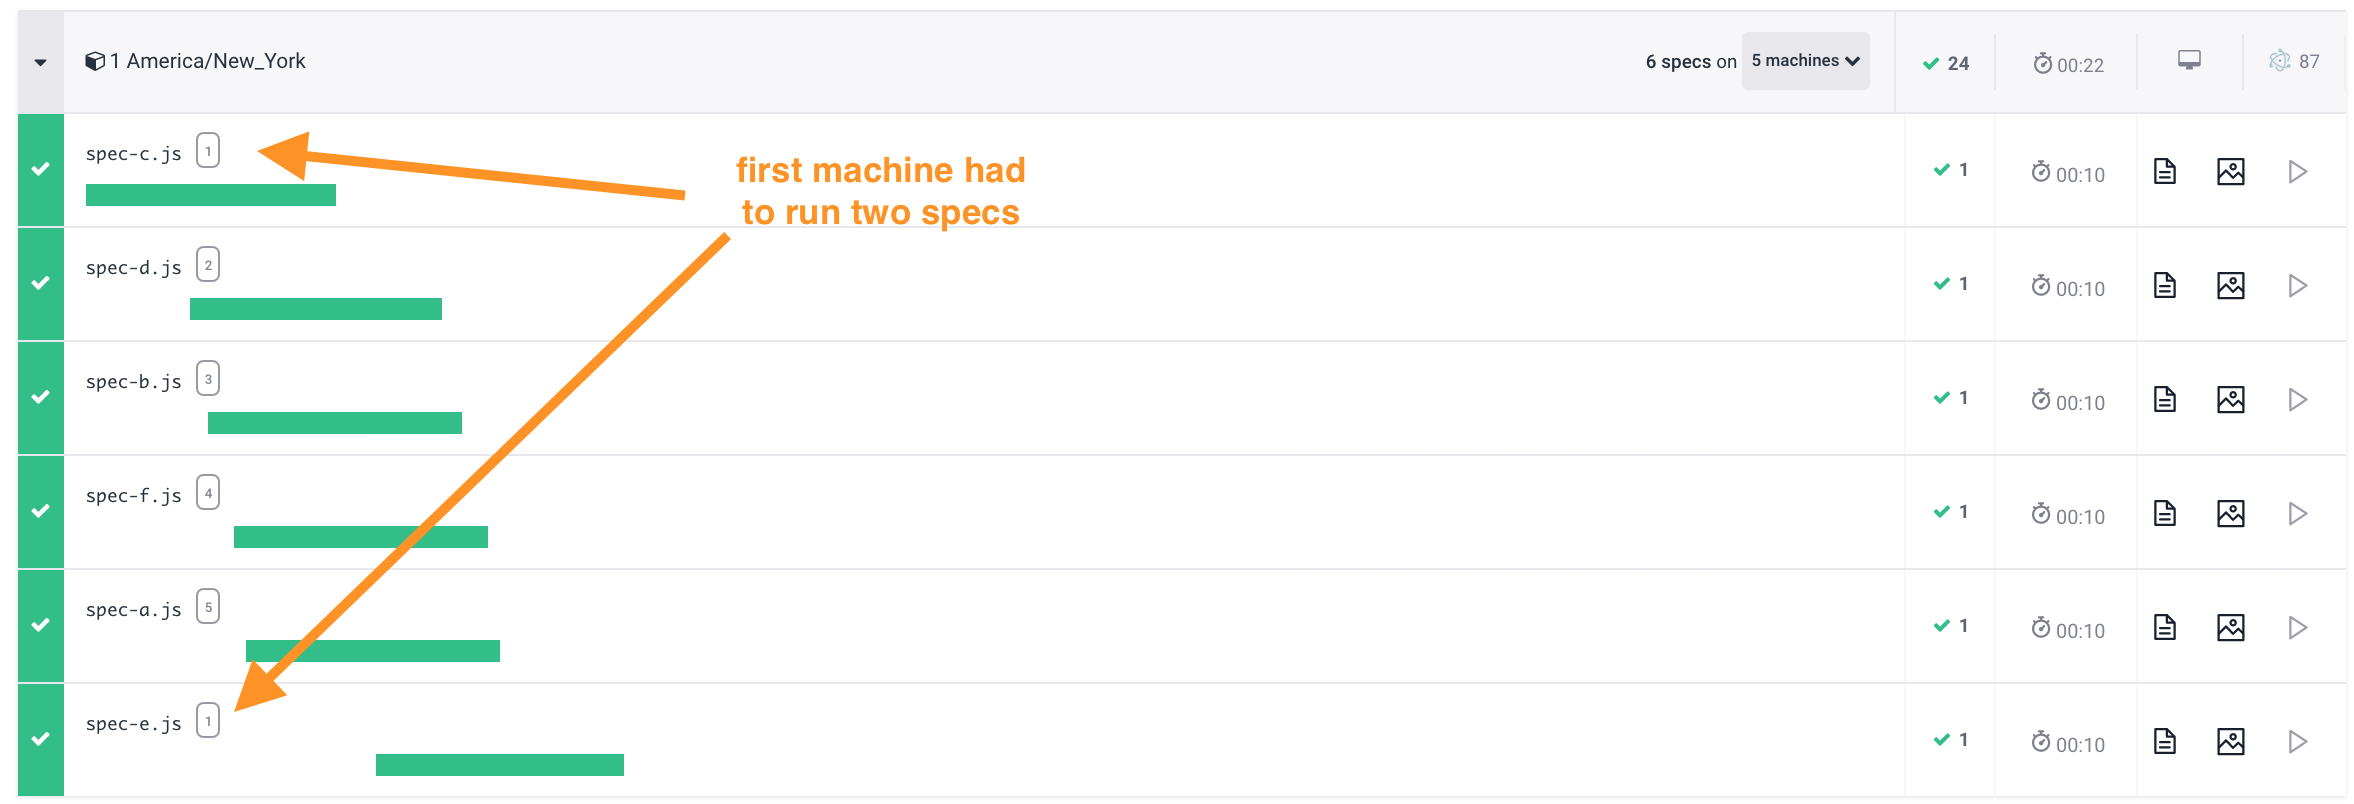
Because CIs take different time to spin the containers, some machines might be "late to the party". That's fine - all machines were working to execute the second, third, and the fourth group. Look at the last group where all 6 specs were executed in parallel by 6 CI machines, finishing the group in 14 seconds.
