📦 you can find the source code for this blog post in the repository bahmutov/todomvc-express-api-test-coverage
- Best practices
- The example application
- Cypress API tests
- Code coverage
- Continuous integration service
- Code coverage service
- Increasing code coverage
- Covering the edge cases
- The last step to reach 100
- See also
Best practices
- Instrument the backend JavaScript or TypeScript server using nyc and create coverage reports using @cypress/code-coverage plugin
- Hit the backend from Cypress tests using cy.request
- Set up the continuous integration and code coverage services early
- Start by adding tests for the major features, this is will quickly increase the coverage percentage
- Later concentrate on the edge cases using the code coverage report to find the missing source lines
The example application
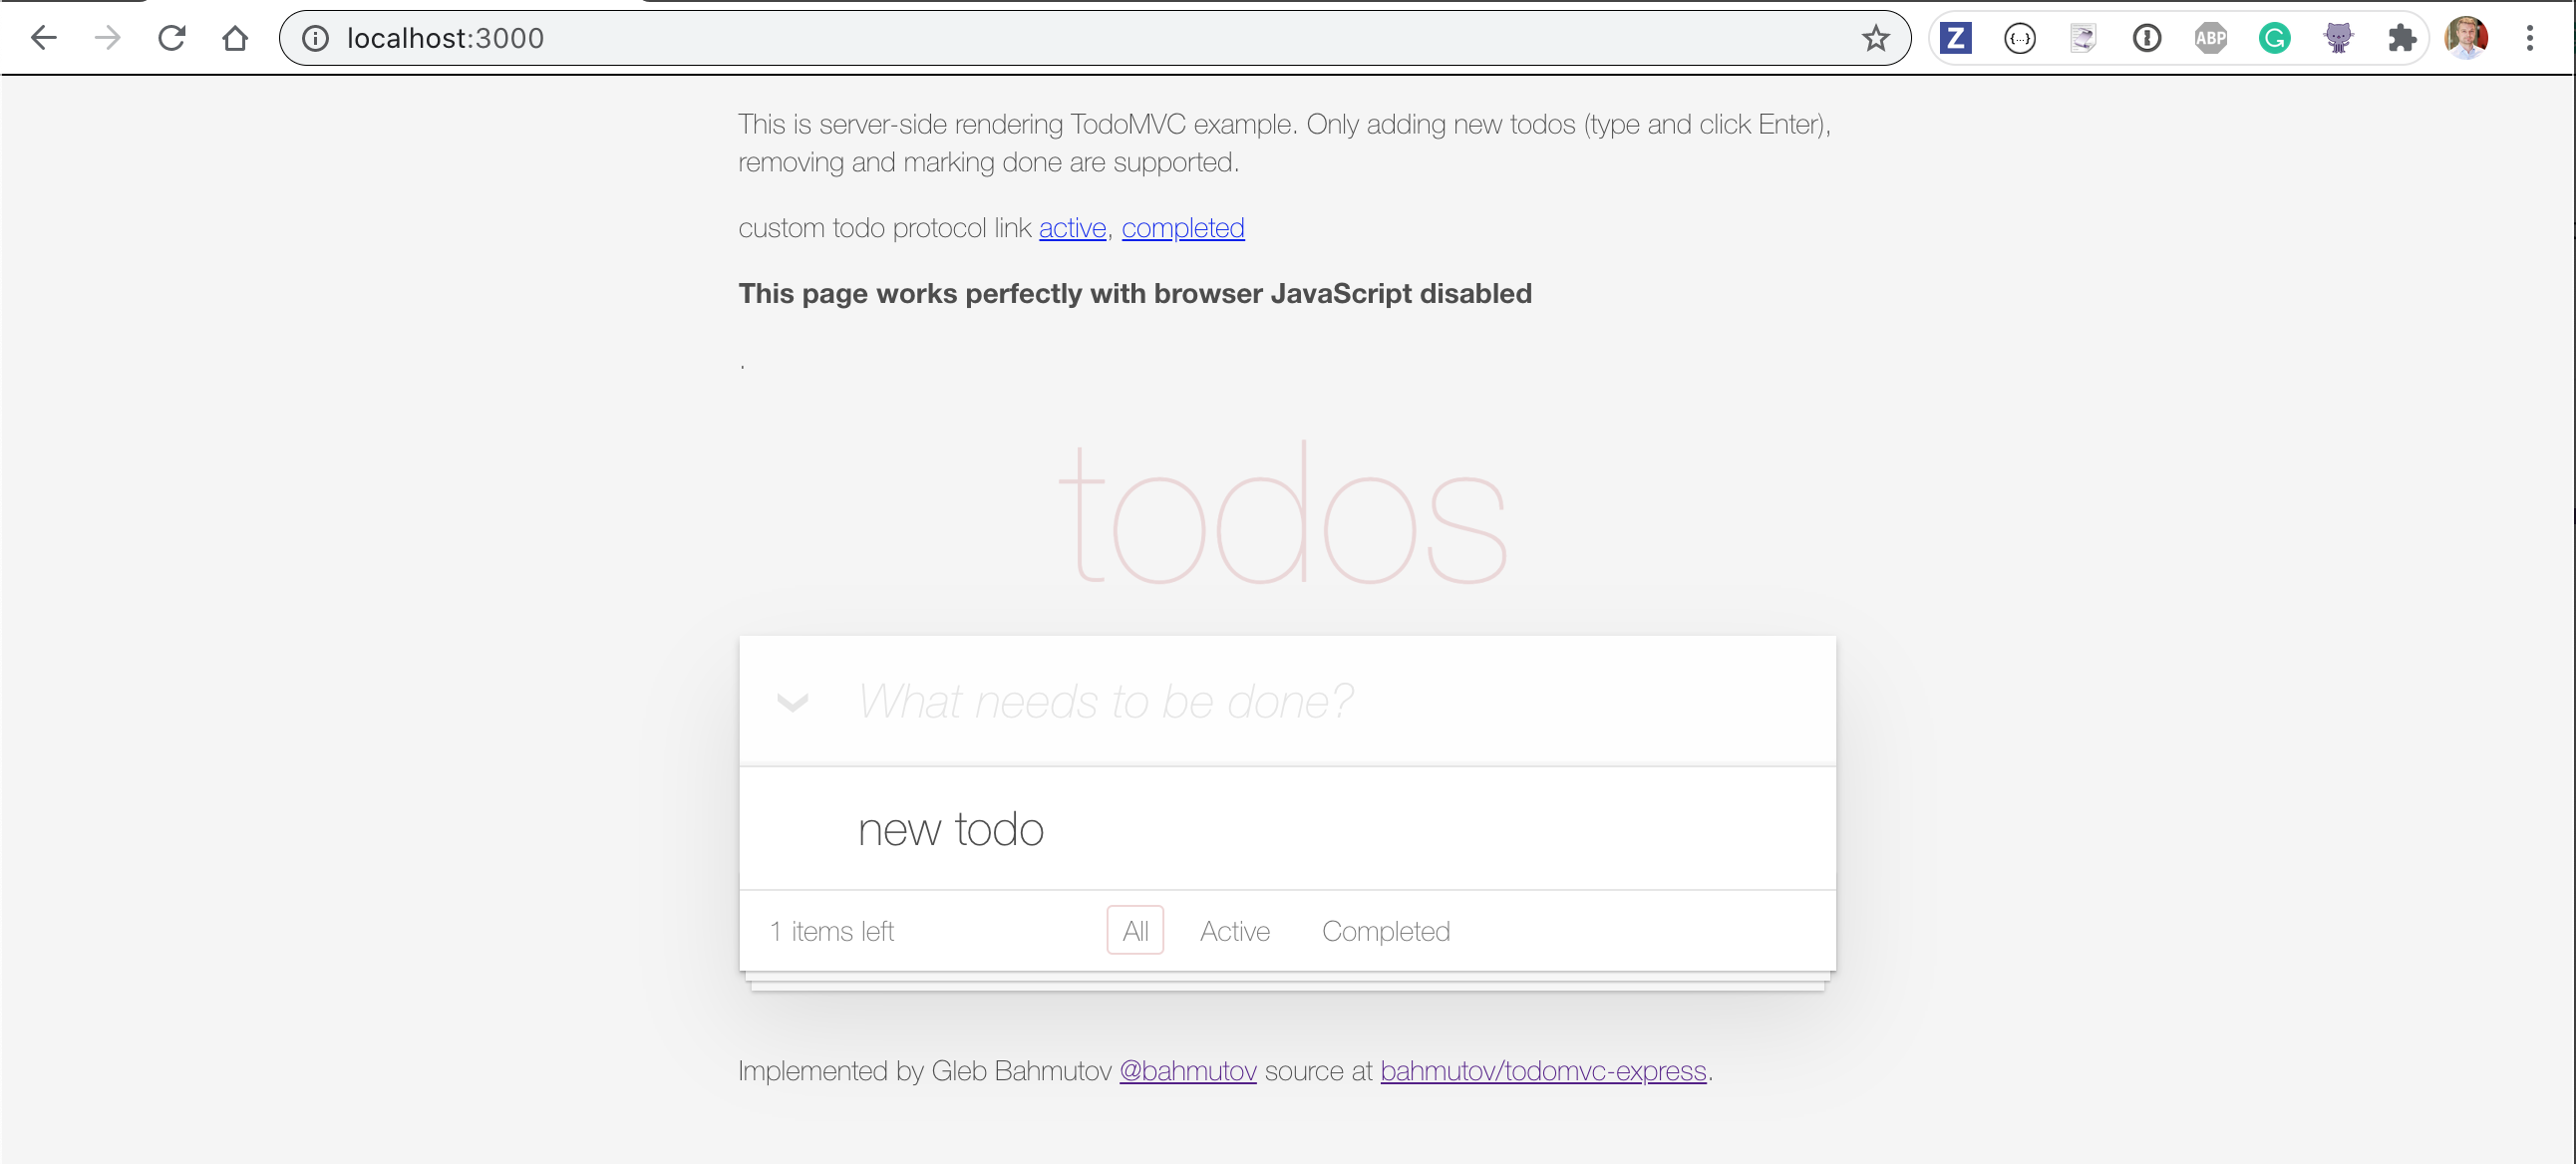
Let's test a TodoMVC application - except our application will be completely rendered server-side. Here is how the application looks to the user
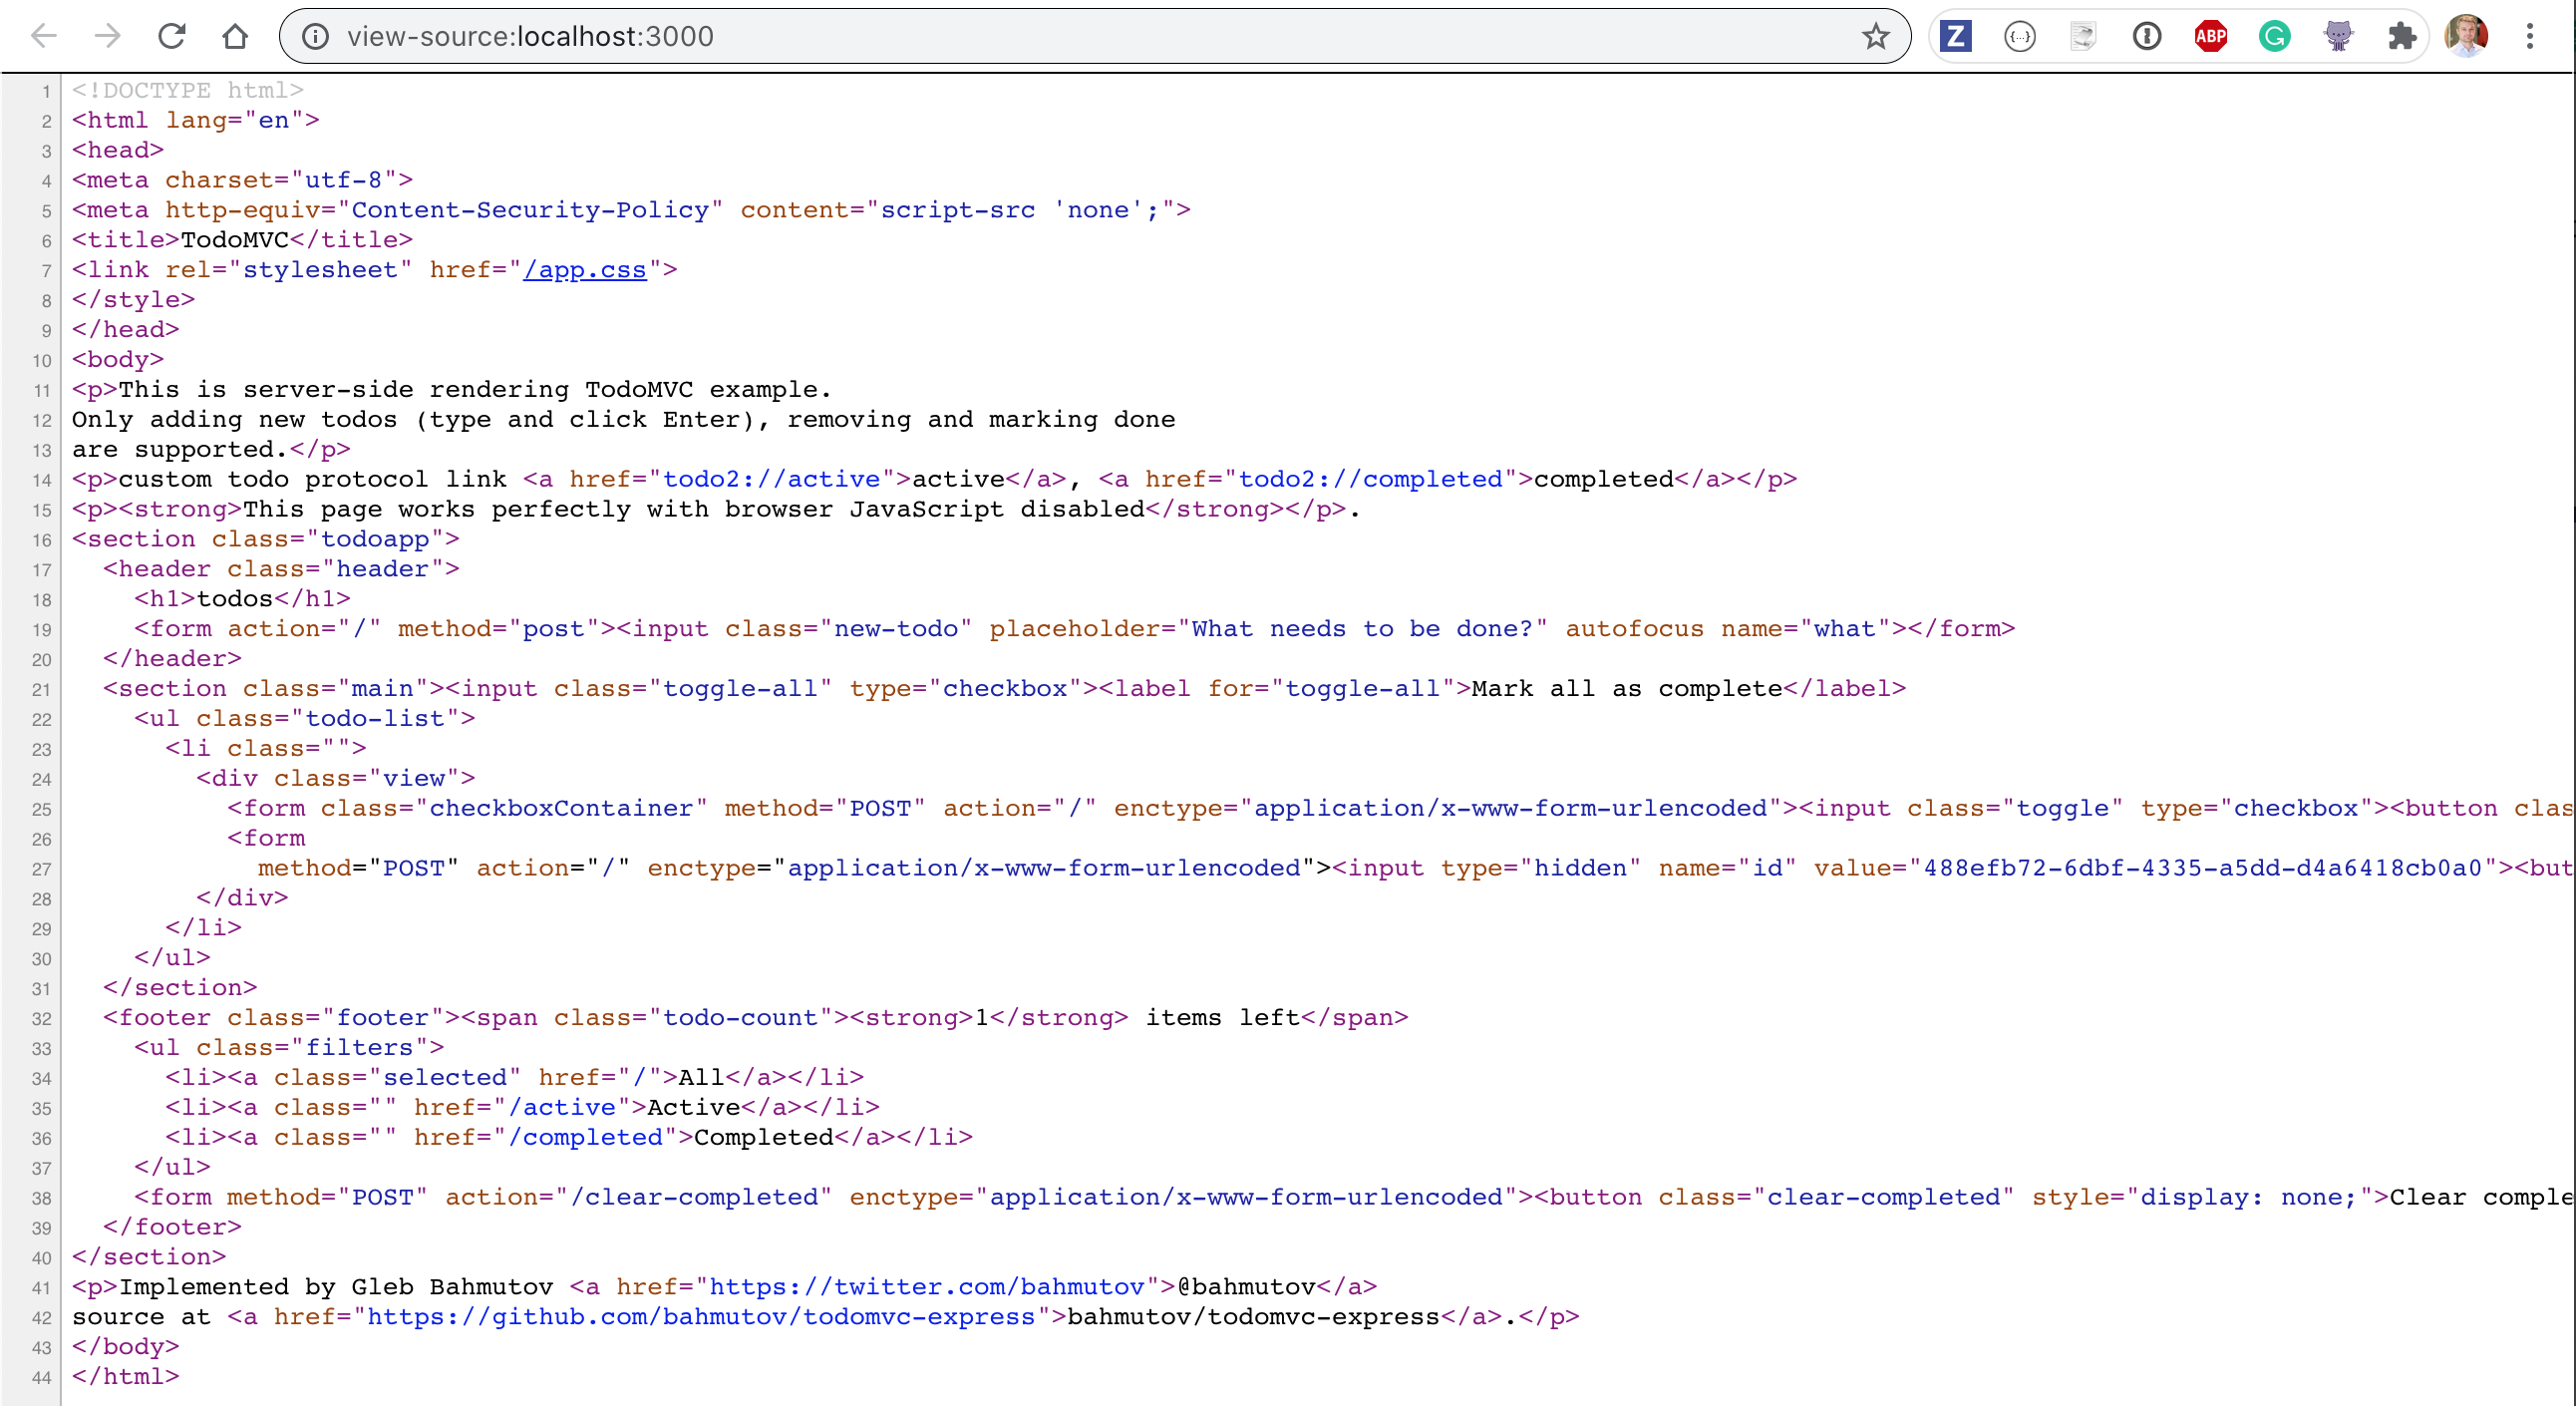
If we look at the source code we can see the sources disabled using Content-Security-Policy and the entire application just using forms.
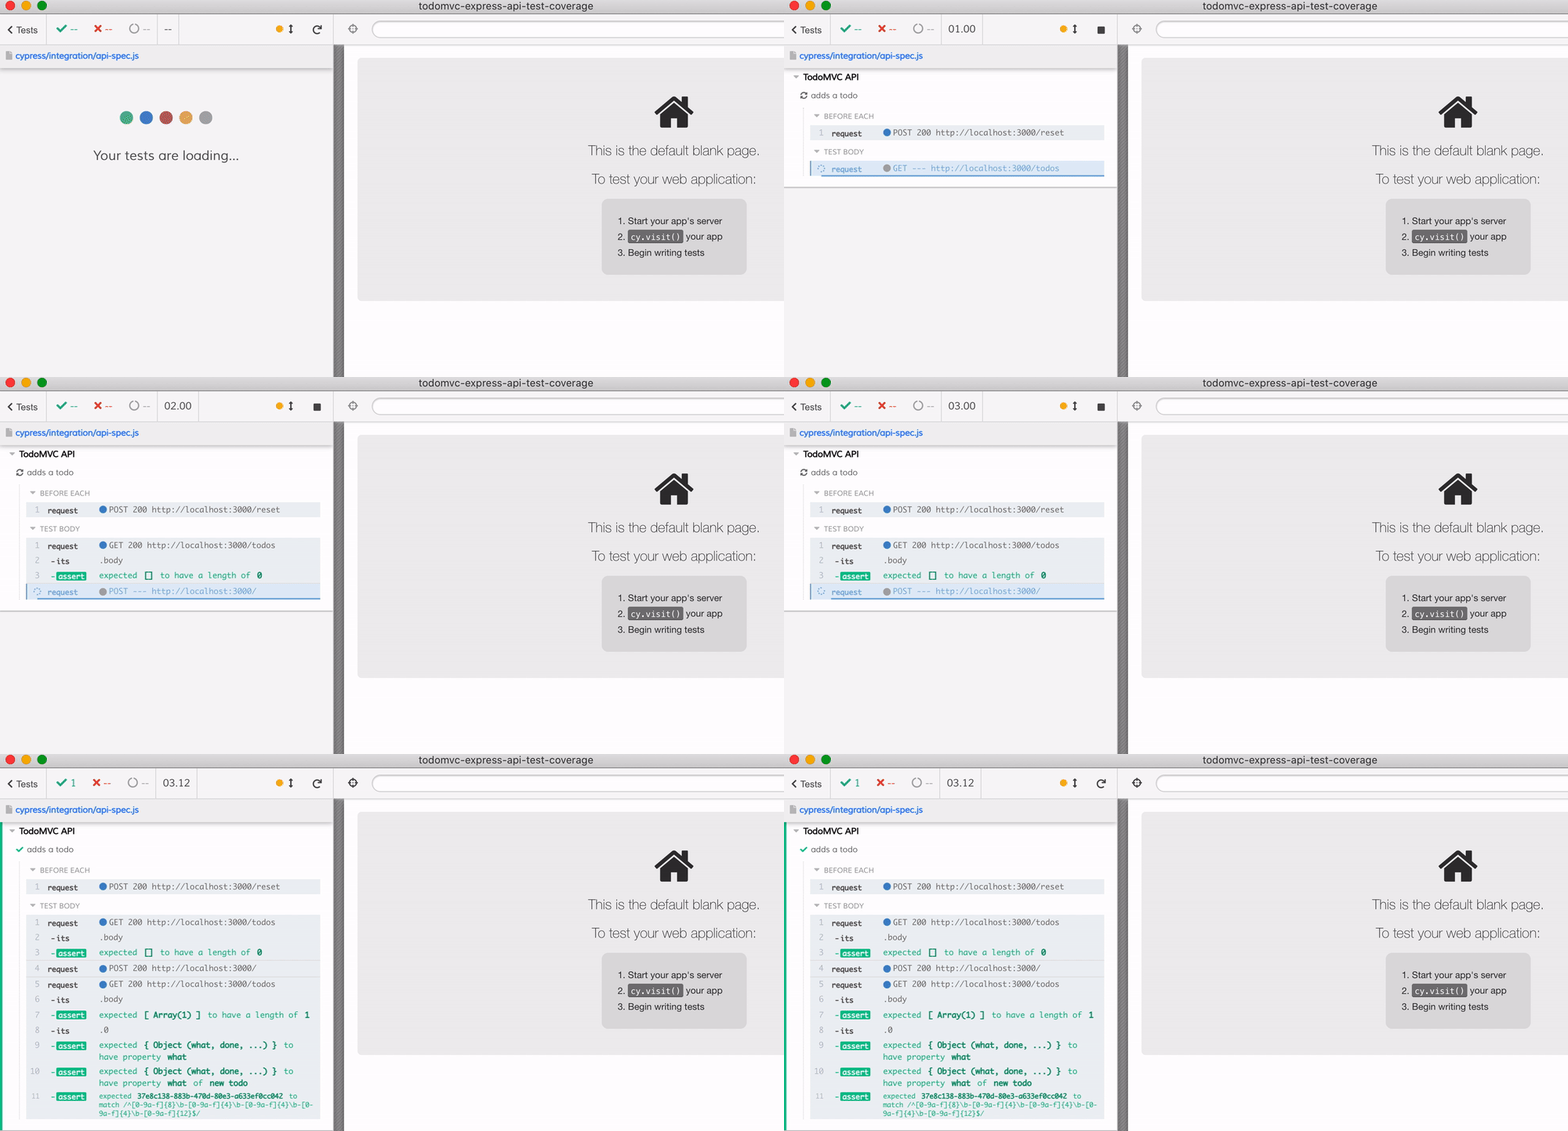
Note: for demo purpose this application has artificial delays added to its code.
Cypress API tests
We could write end-to-end tests to operate on the app via its user interface, as I have done in the bahmutov/todomvc-express repo. But let's have some fun. Let's test our application by executing just API tests. We can use cy.request commands and assert the results. If we wanted we could even use cy.api custom command to show each request in the empty iframe, as I described in Black box API testing with server logs.
For example, let's validate that we can add a todo by executing a POST request.
1 | describe('TodoMVC API', () => { |
The test passes - we can add a todo using API requests
Show the result
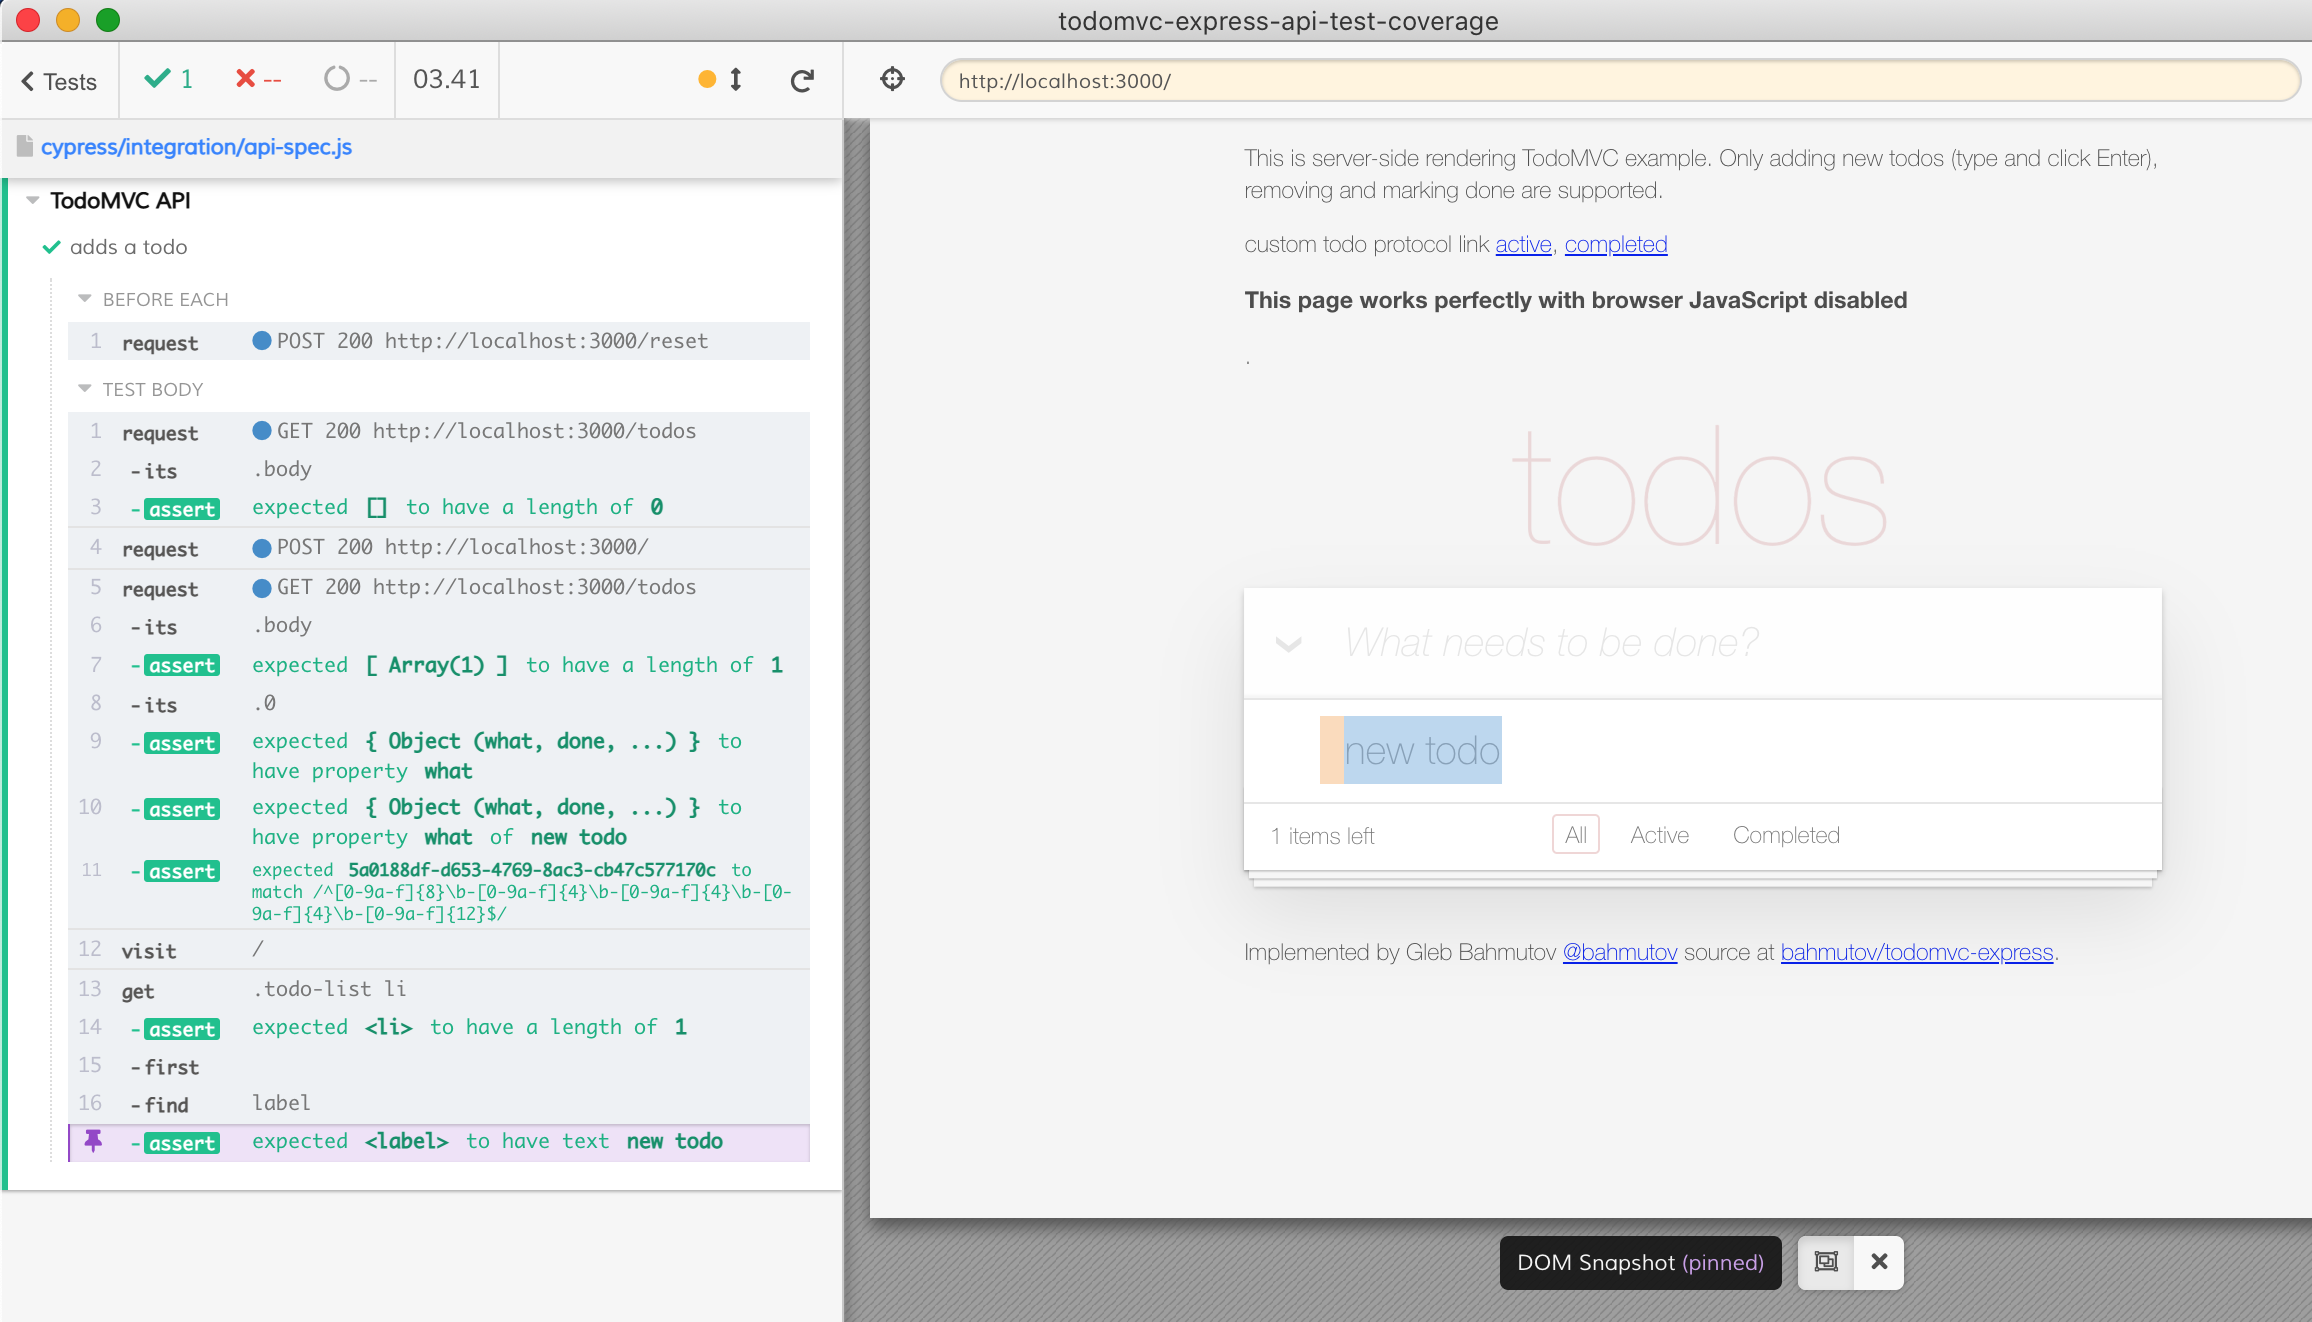
We have an empty iframe where the application would normally be. Let's use it. We can simply load the base url using cy.visit('/') command at the end of the test.
1 | // the same API test |
We have confirmed the todo has the expected text
We can also go about this the other way - the GET / should return the rendered HTML page. Let's write this HTML into the document directly, without using cy.visit
1 | // the same API test |
The tested application looks the same way.
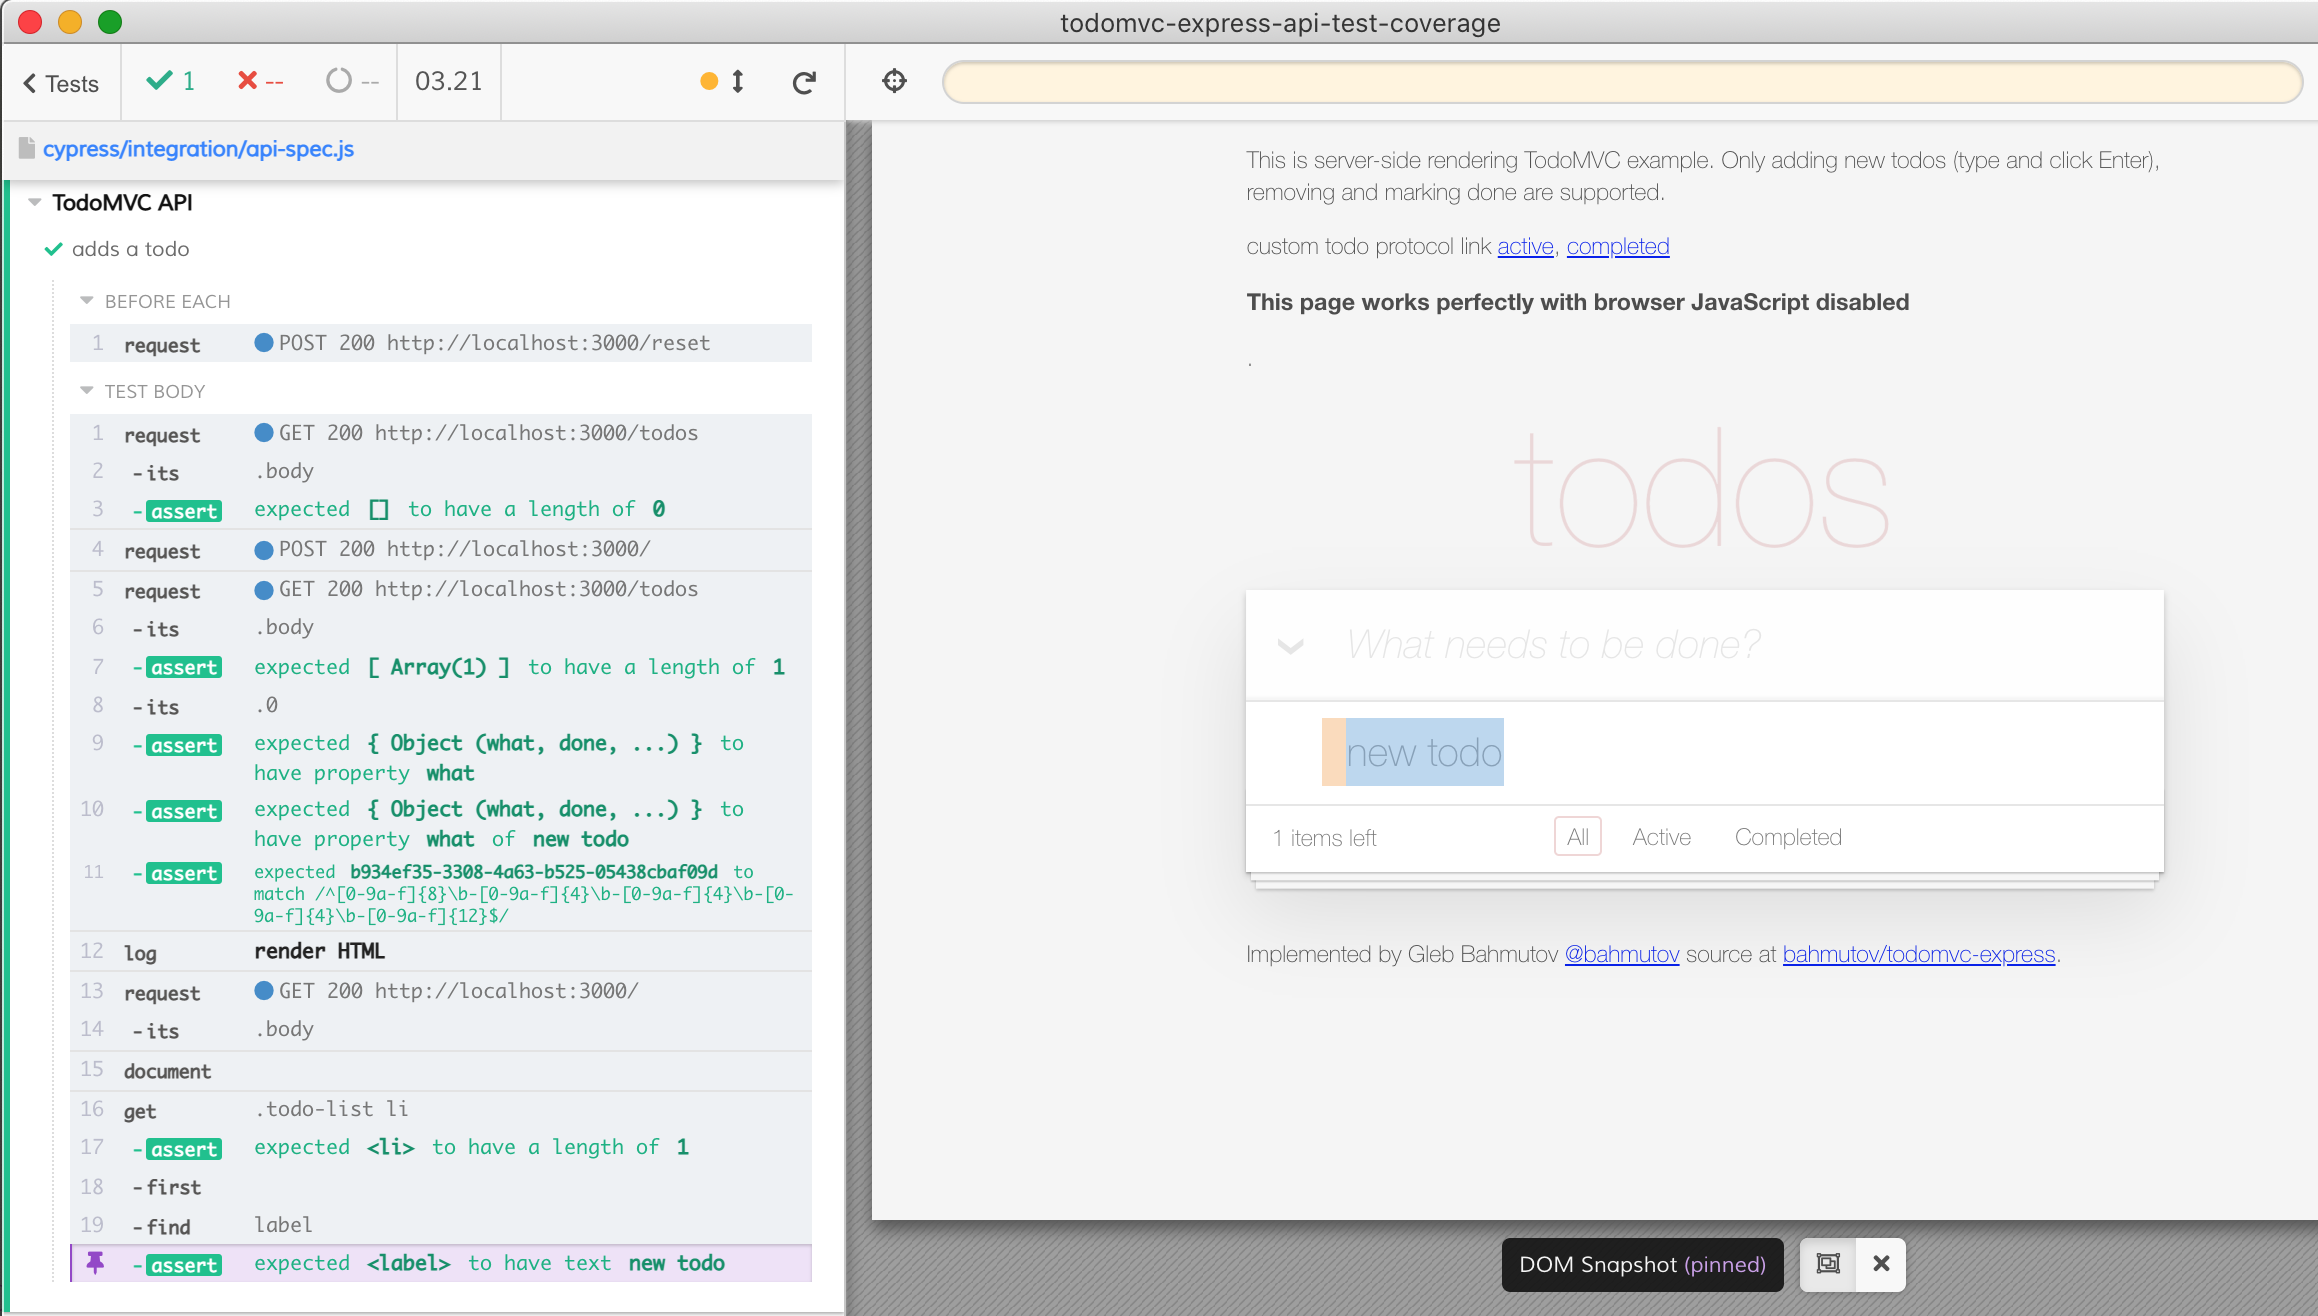
Tip: a good way to always replace the document's HTML is to use a helper method
1 | // replaces any current HTML in the document with new html |
Code coverage
Let's measure the backend code in the "src" folder we exercise with our test. We can install cypress-io/code-coverage to generate the reports and nyc to instrument our Node.js server.
1 | npm i -D nyc @cypress/code-coverage |
To instrument the server prepend the node command with nyc in the package.json start script
1 | - "start": "node src/start.js" |
And add an endpoint returning the code coverage object when needed. Since our application uses Express.js we can use the Express helper code included with @cypress/code-coverage
1 | const express = require('express') |
Our Cypress config file tells the plugin where to find the backend code coverage. It also tells the plugin not to expect any frontend code coverage - since the app is purely HTML.
1 | { |
The application runs and shows messages from the code coverage plugin.
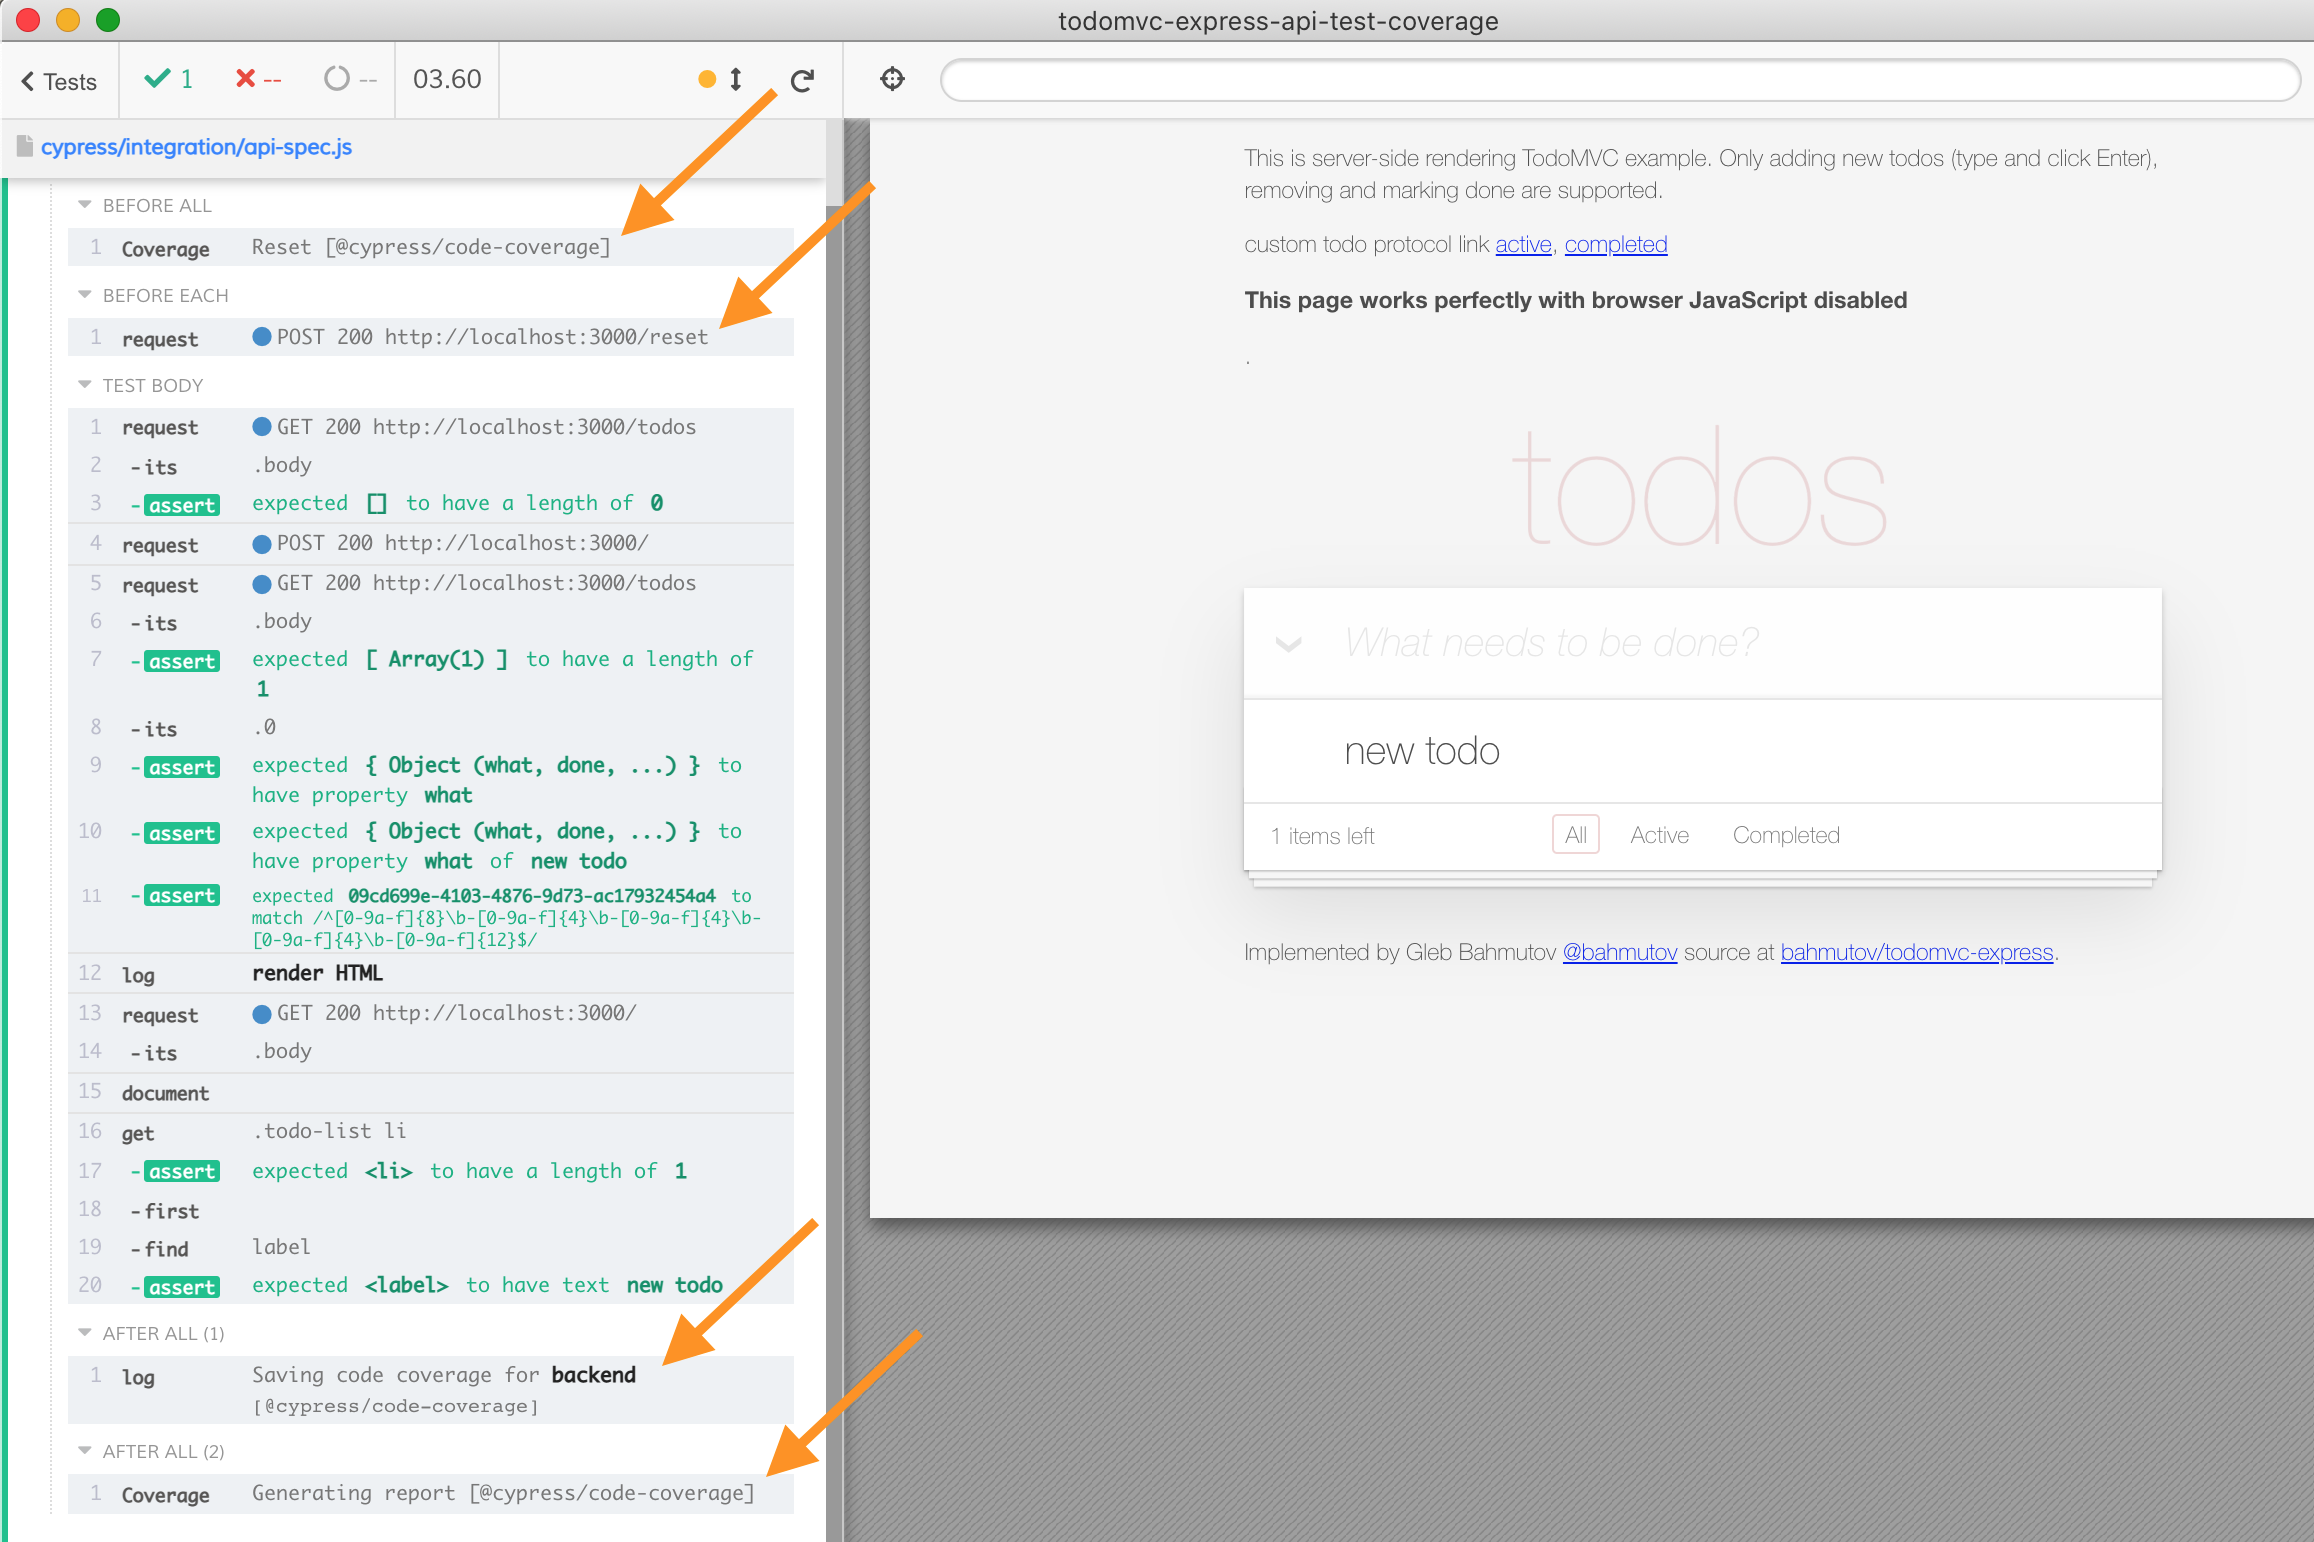
If you click on the last message "Generating report" you can find the output folder printed to the DevTools console

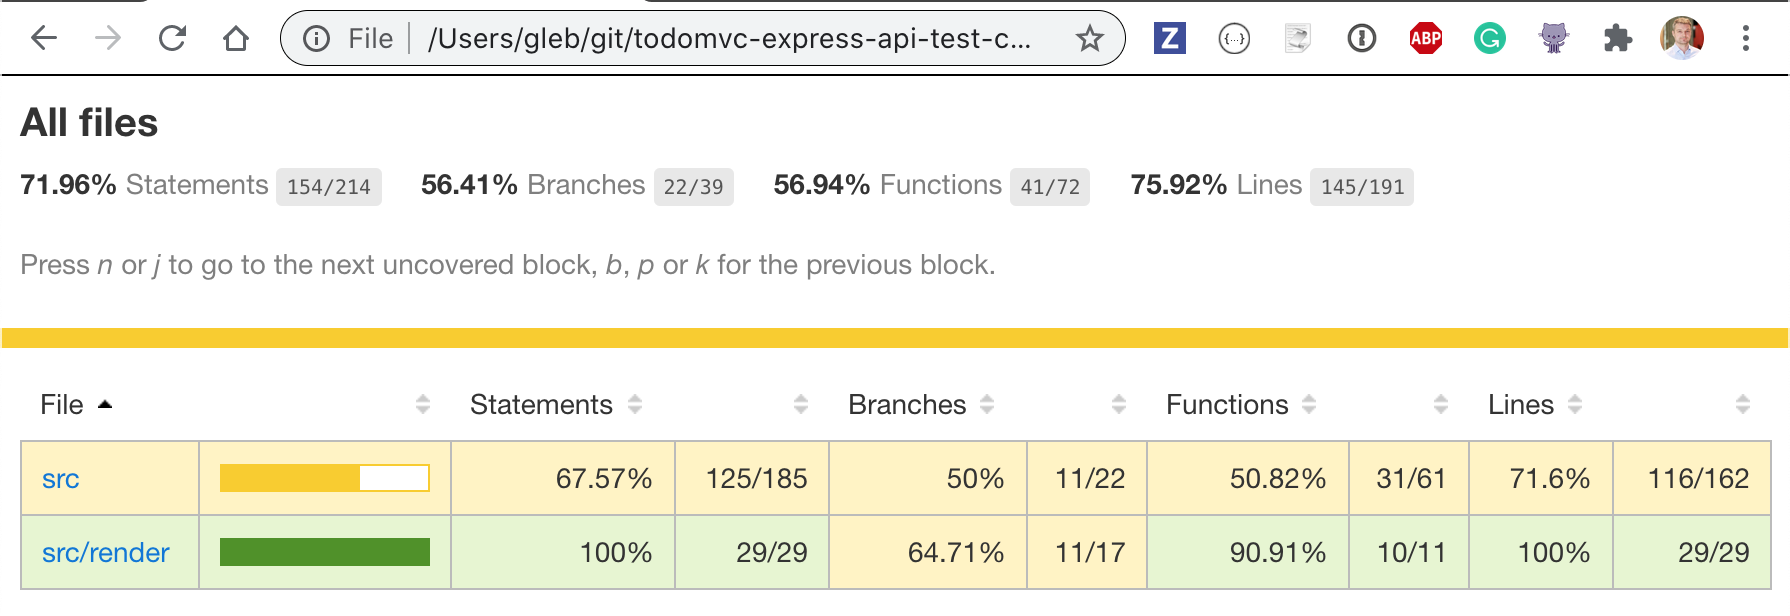
The folder coverage contains reports in multiple formats: html, clover, JSON, lcov. I mostly look at the html report
1 | open coverage/lcov-report/index.html |
Not bad - our single test covers 72% of the backend source code
Continuous integration service
Before we write more tests, I want to run E2E tests on CI. I will pick CircleCI because I can use Cypress orb to run tests, and because I can store the code coverage folder as a test artifact there.
1 | version: 2.1 |
Out tests pass and we can see the coverage report - it is a static HTML file served directly by CircleCI. Just click on the "Test Artifacts" tab in the job and select the "index.html" link.
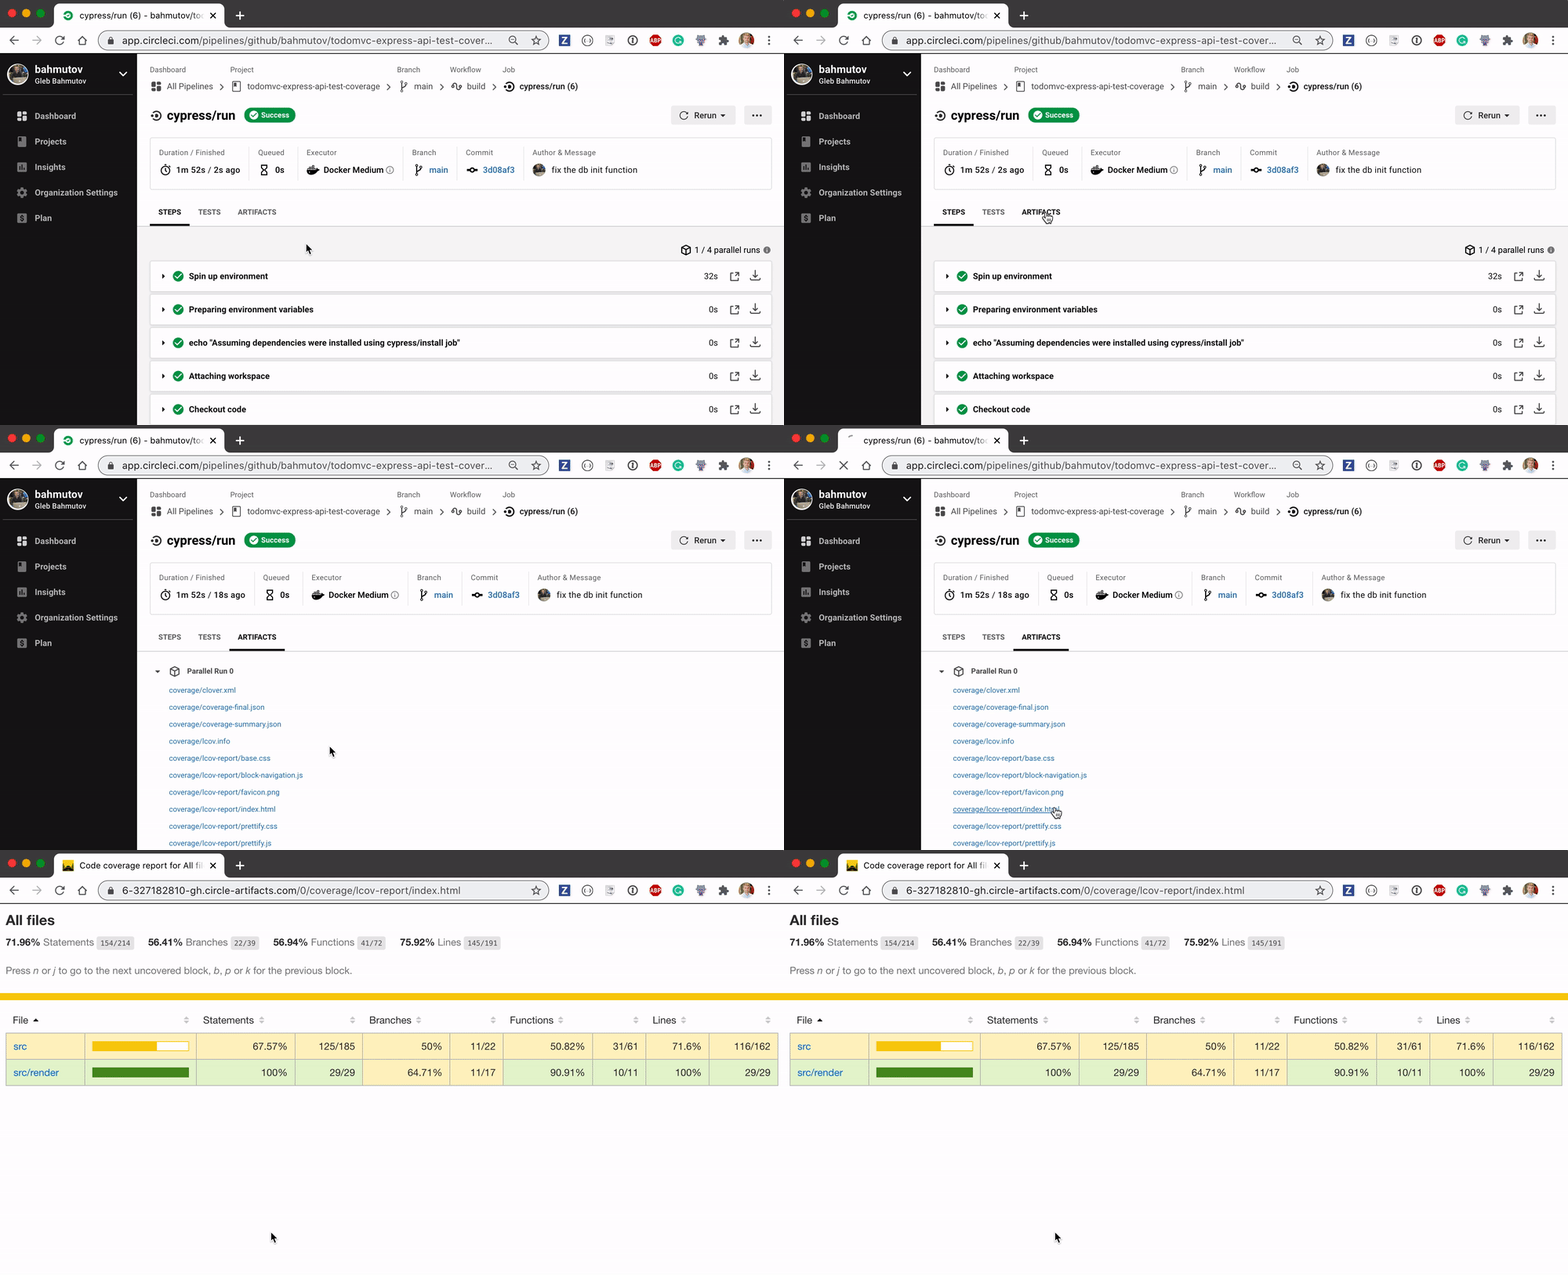
Code coverage service
We want to ensure that our app works. Thus we want to test every commit and every pull request using the CI service. Similarly, we want to ensure that every feature we add to the web application is tested at the same time. The simplest way to ensure our code coverage increases with new features, and does not increase with code refactorings is to use code coverage as a service. For this example, I picked codecov.io and you can see the latest results for this blog post's example repository at todomvc-express-api-test-coverage URL.
After every CI run, we need to upload the code coverage report (the JSON file in this case) to Codecov service. The simplest way to do this is to use their orb
1 | version: 2.1 |
We literally added 3 lines to our YML file: Codecov figures out the commit, the branch, the pull request automatically using the environment variables.
1 | codecov: codecov/codecov@1 |
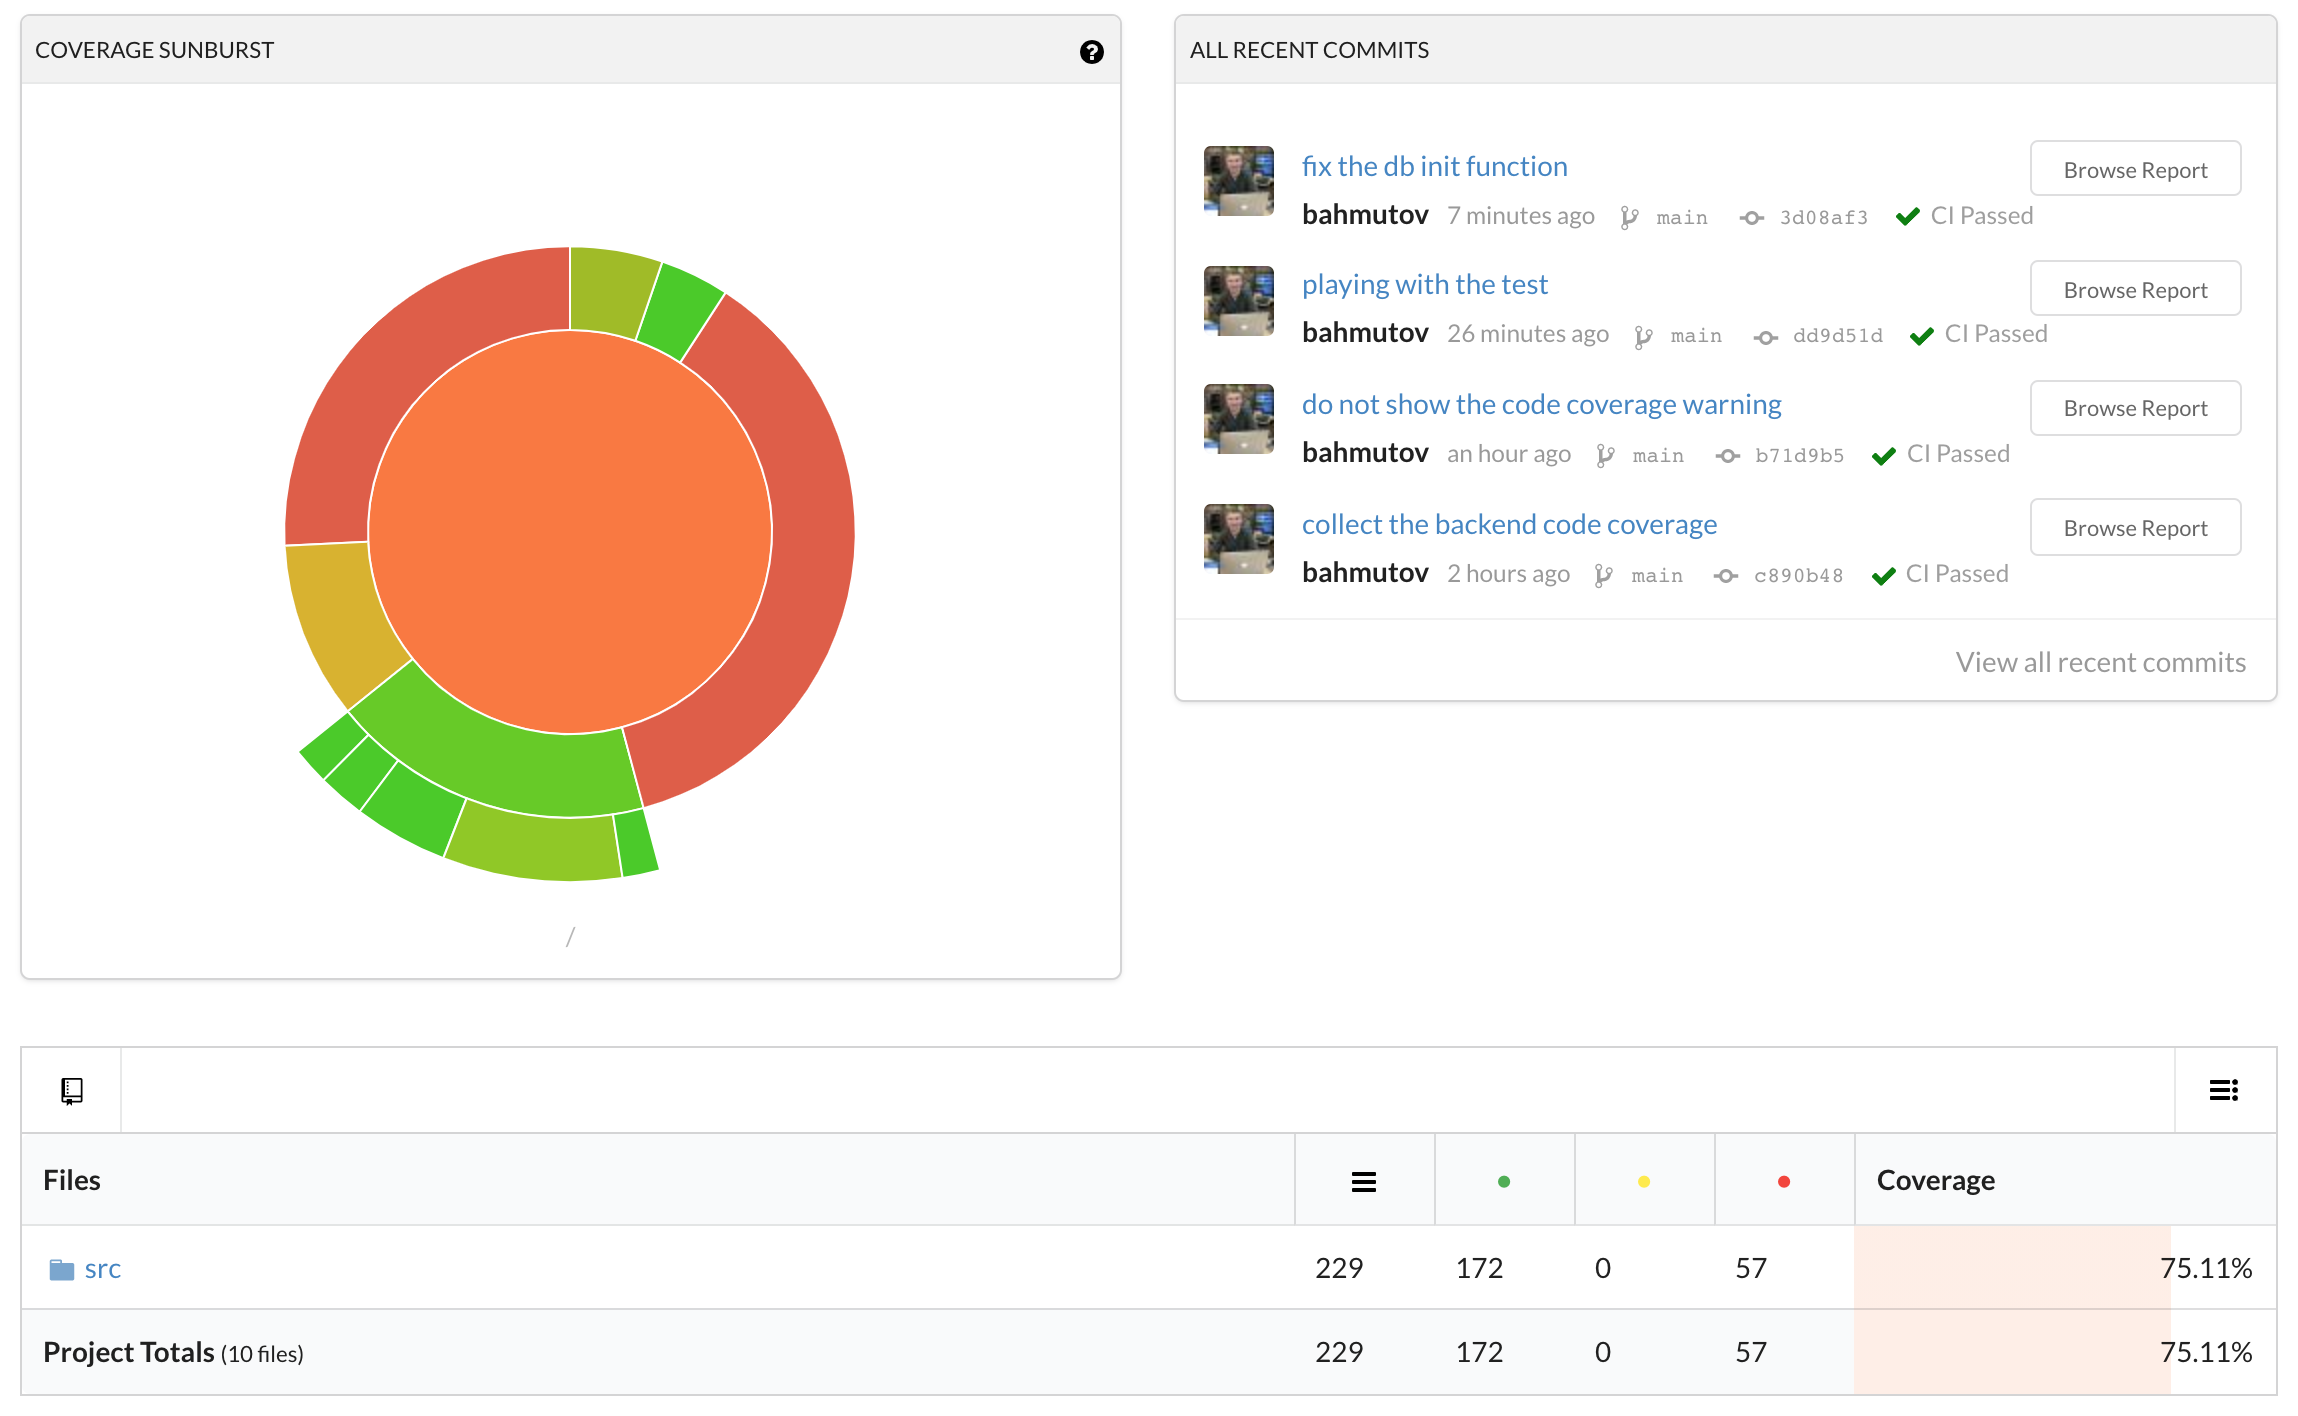
The dashboard shows approximately the same numbers (Codecov uses line coverage by default)
Codecov GitHub app
We will write more tests, but first let's ensure that every pull request increases the code coverage or at least keeps it the same. The simplest way to check the pull request against the current baseline coverage number is by installing a Codecov GitHub application.
After the application has been installed and configured to work on [bahmutov/todomvc-express-api-test-coverage] todomvc-express-api-test-coverage let's open a pull request. Let's inspect the source files with low code coverage to find a feature we are not testing yet.
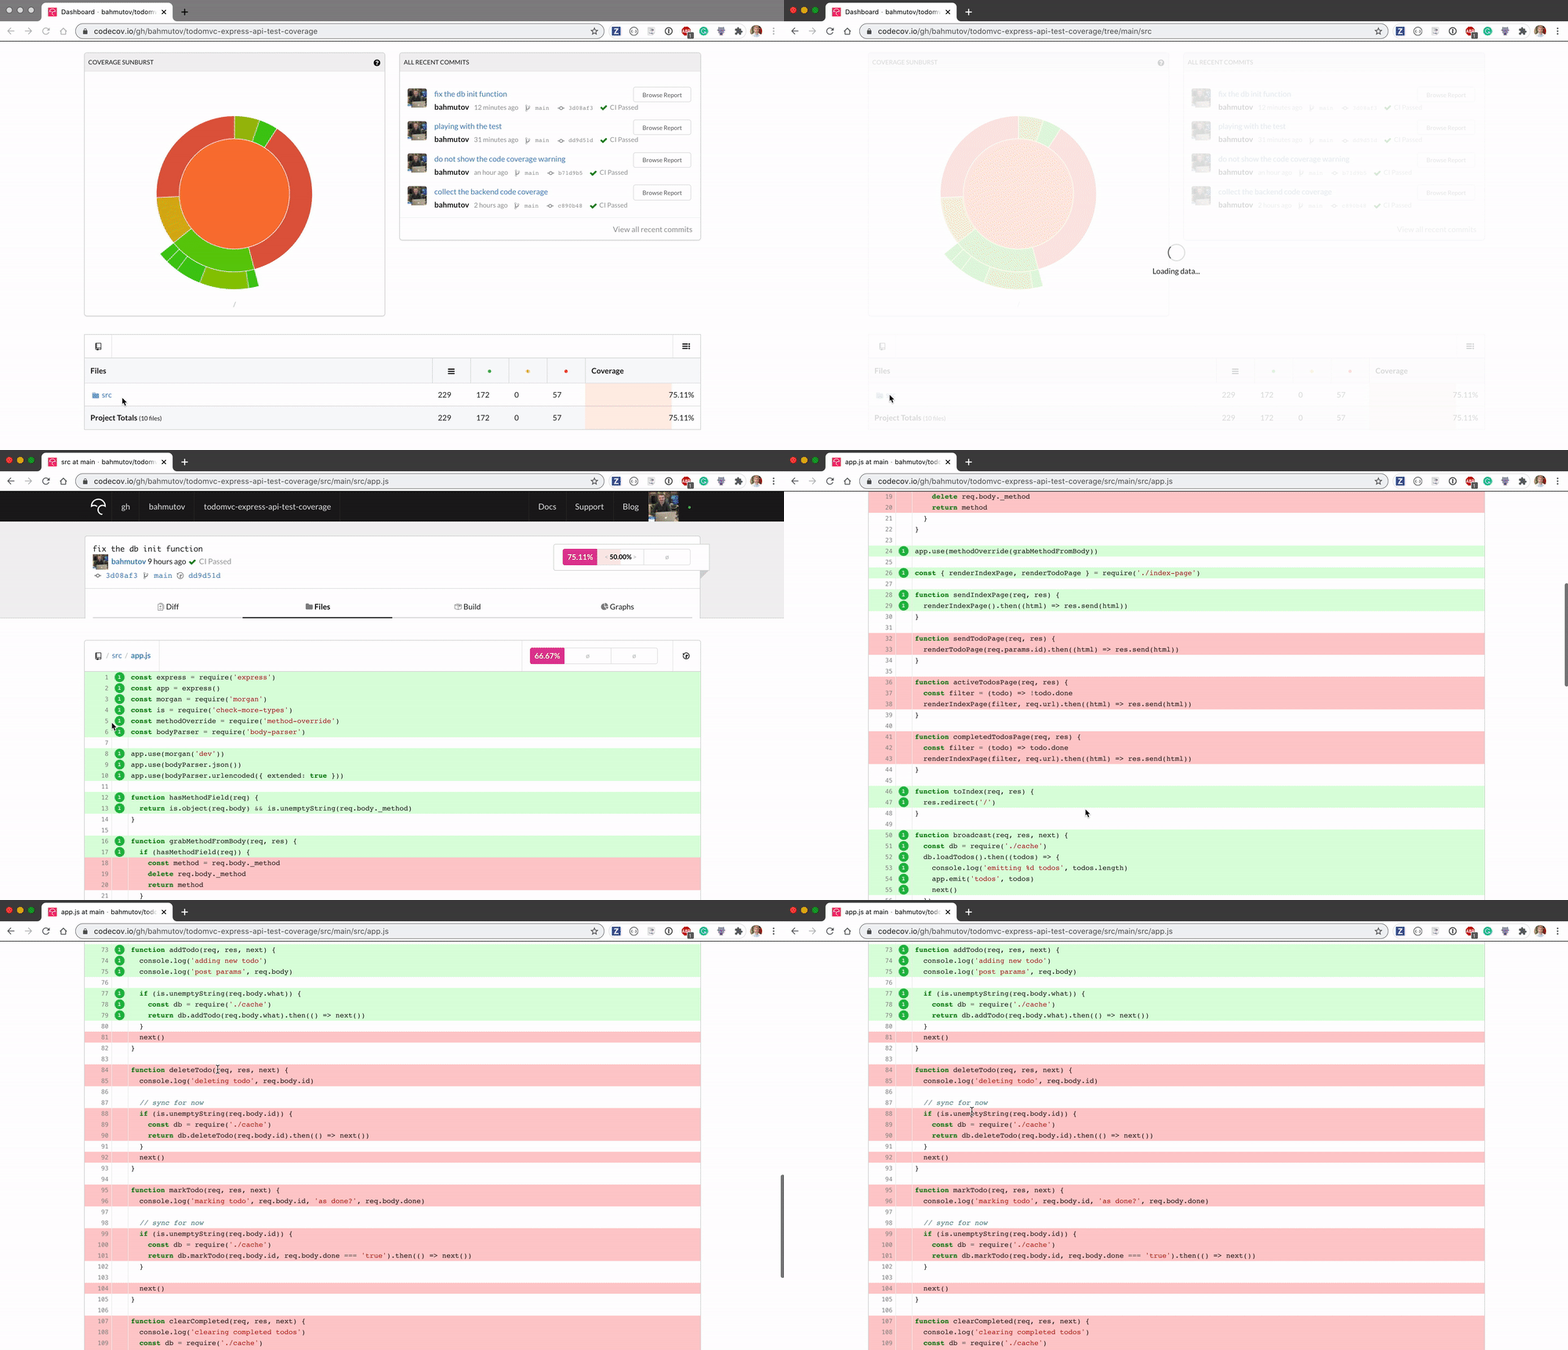
By inspecting the coverage report we see that deleting todos has not been tested yet. Let's write a test and open a pull request.
1 | it('deletes todo', () => { |
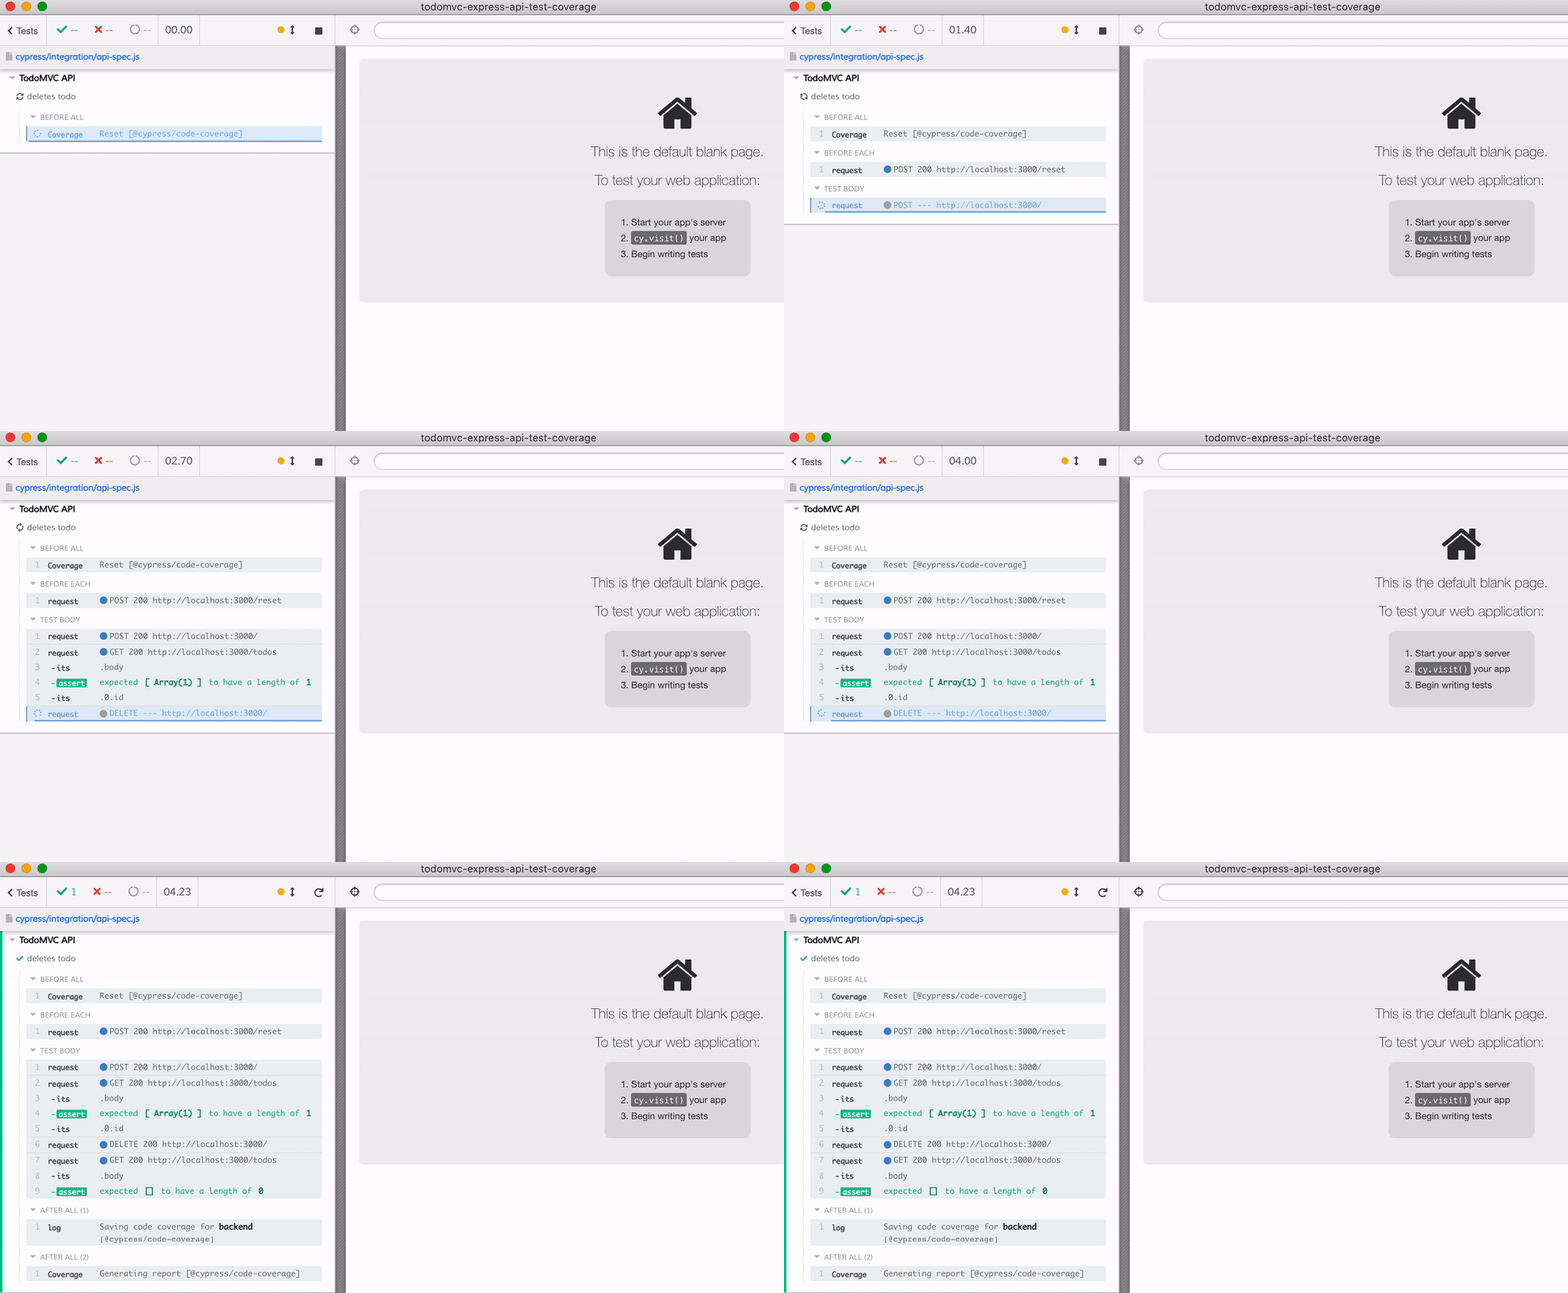
Let's open the pull request #1. The CI runs and the code coverage is sent to Codecov, which posts status checks on the pull request.
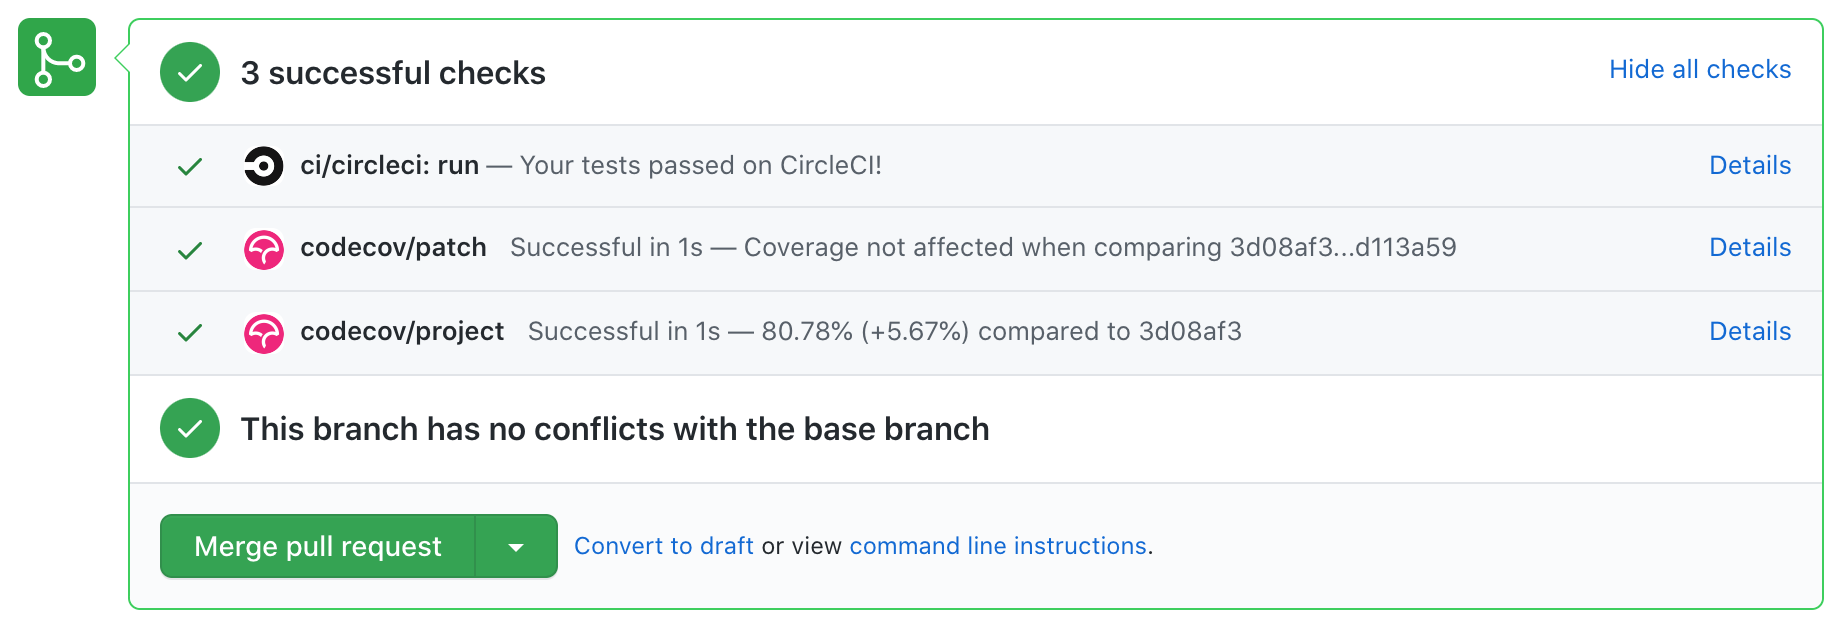
The status checks tell us the code coverage has increased by almost 6%. The more details are available in the PR comment posted by Codecov.
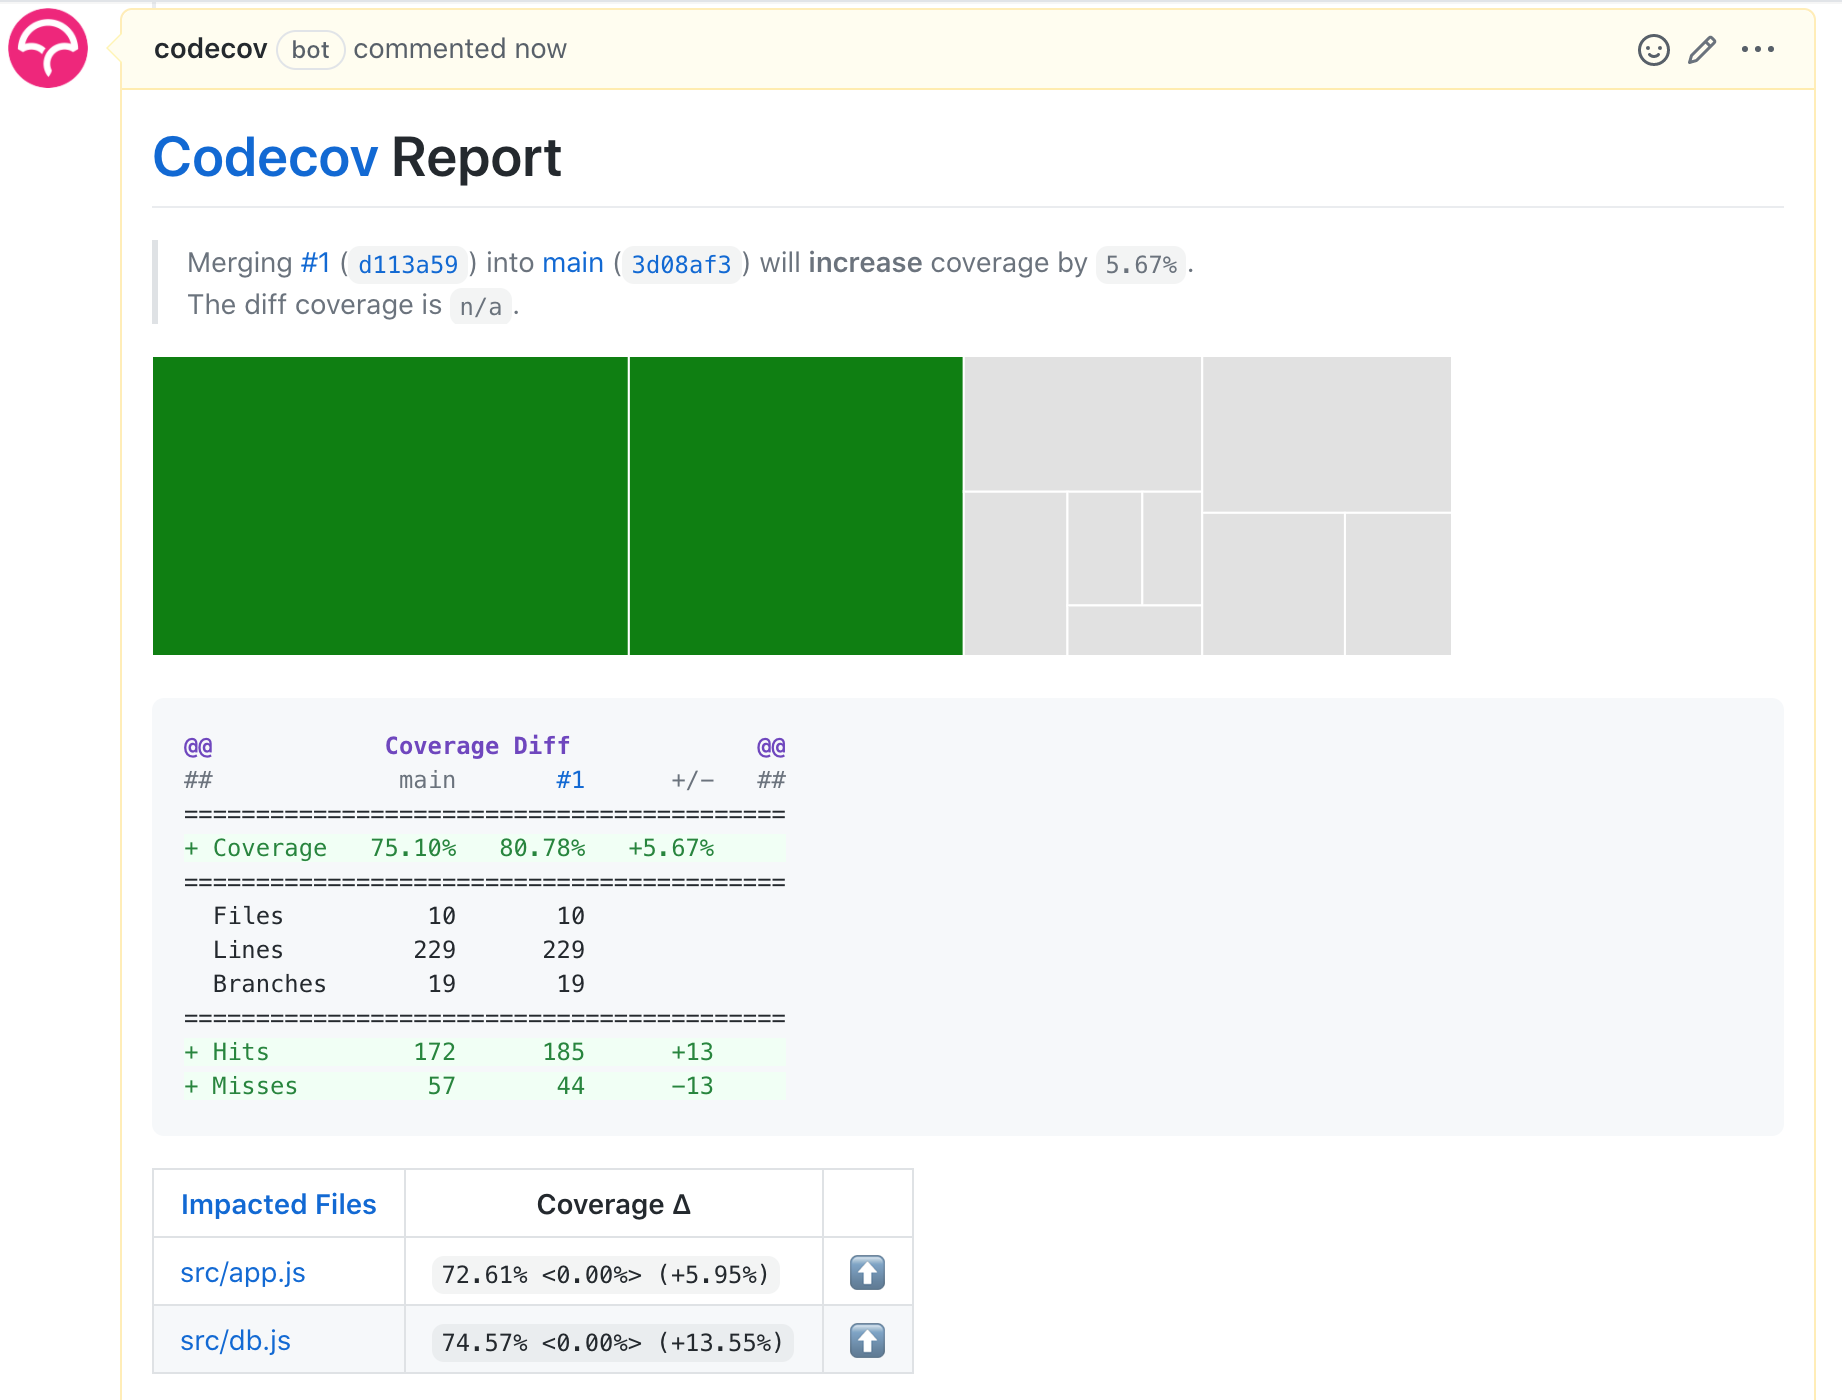
We can click on the comment to open the Codecov PR page where we can find every source file with changed code coverage. For example the src/app.js shows the following lines are now covered.
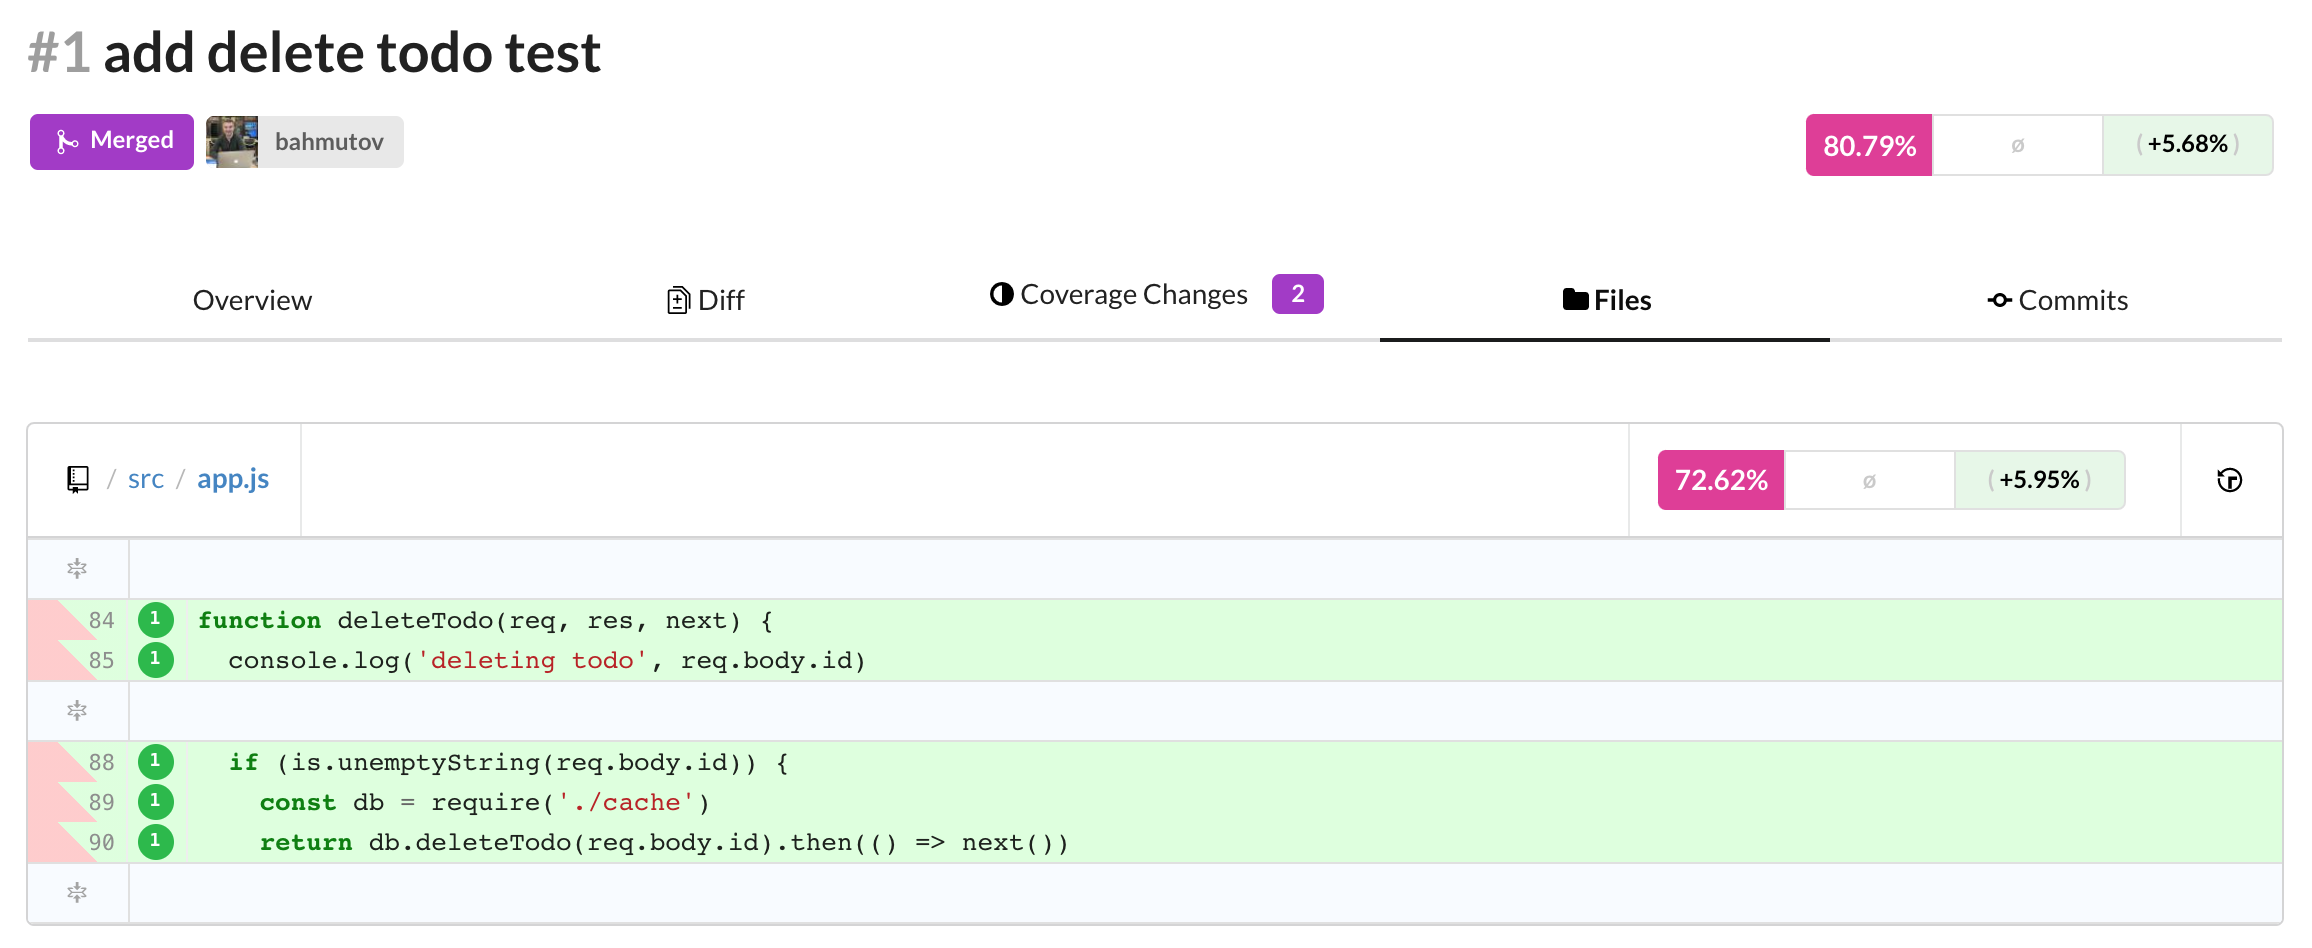
We can safely merge this pull request. The tests pass and the code coverage increases.
Increasing code coverage
We can repeat the process several times:
- inspect the code coverage report to find major features without tests
- write an API test to exercise the feature
- open a pull request and merge if tests pass and code coverage increases
Mark todo completed
For example, marking a todo completed needs a test.
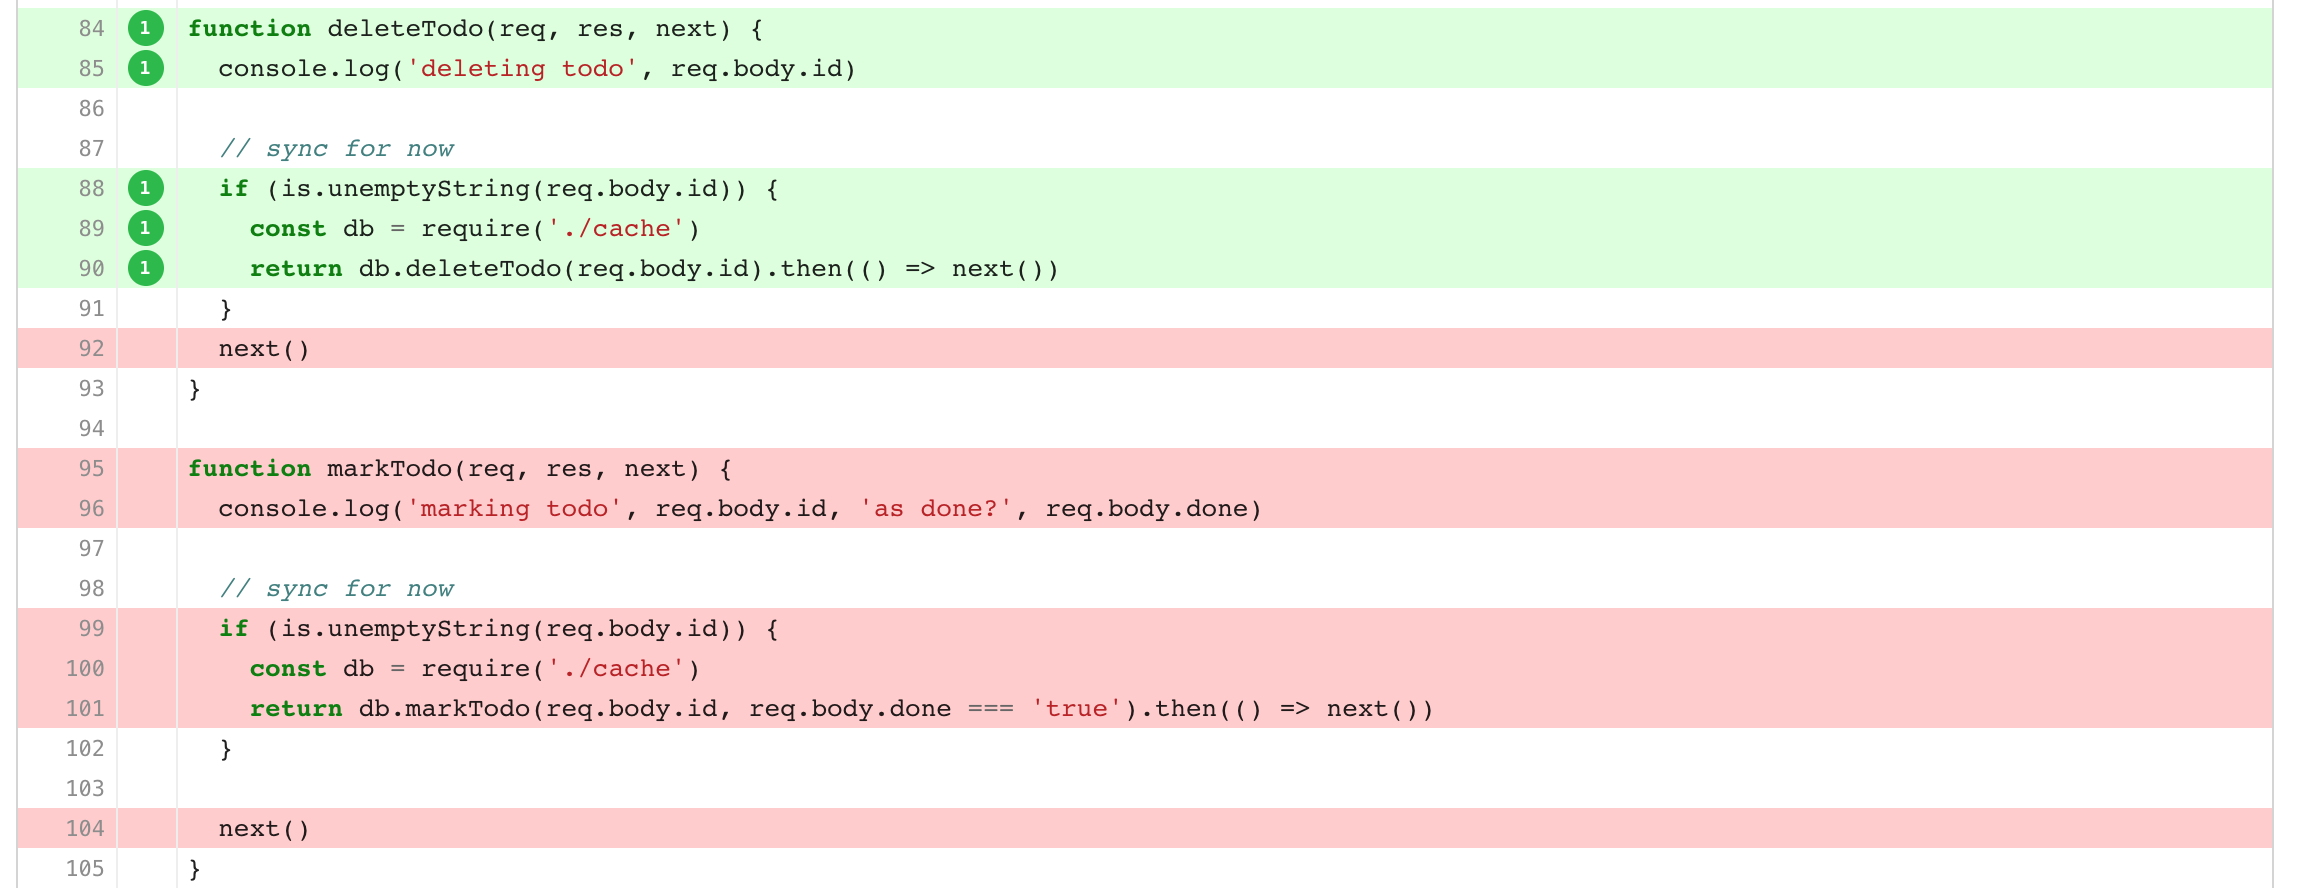
Let's write a test
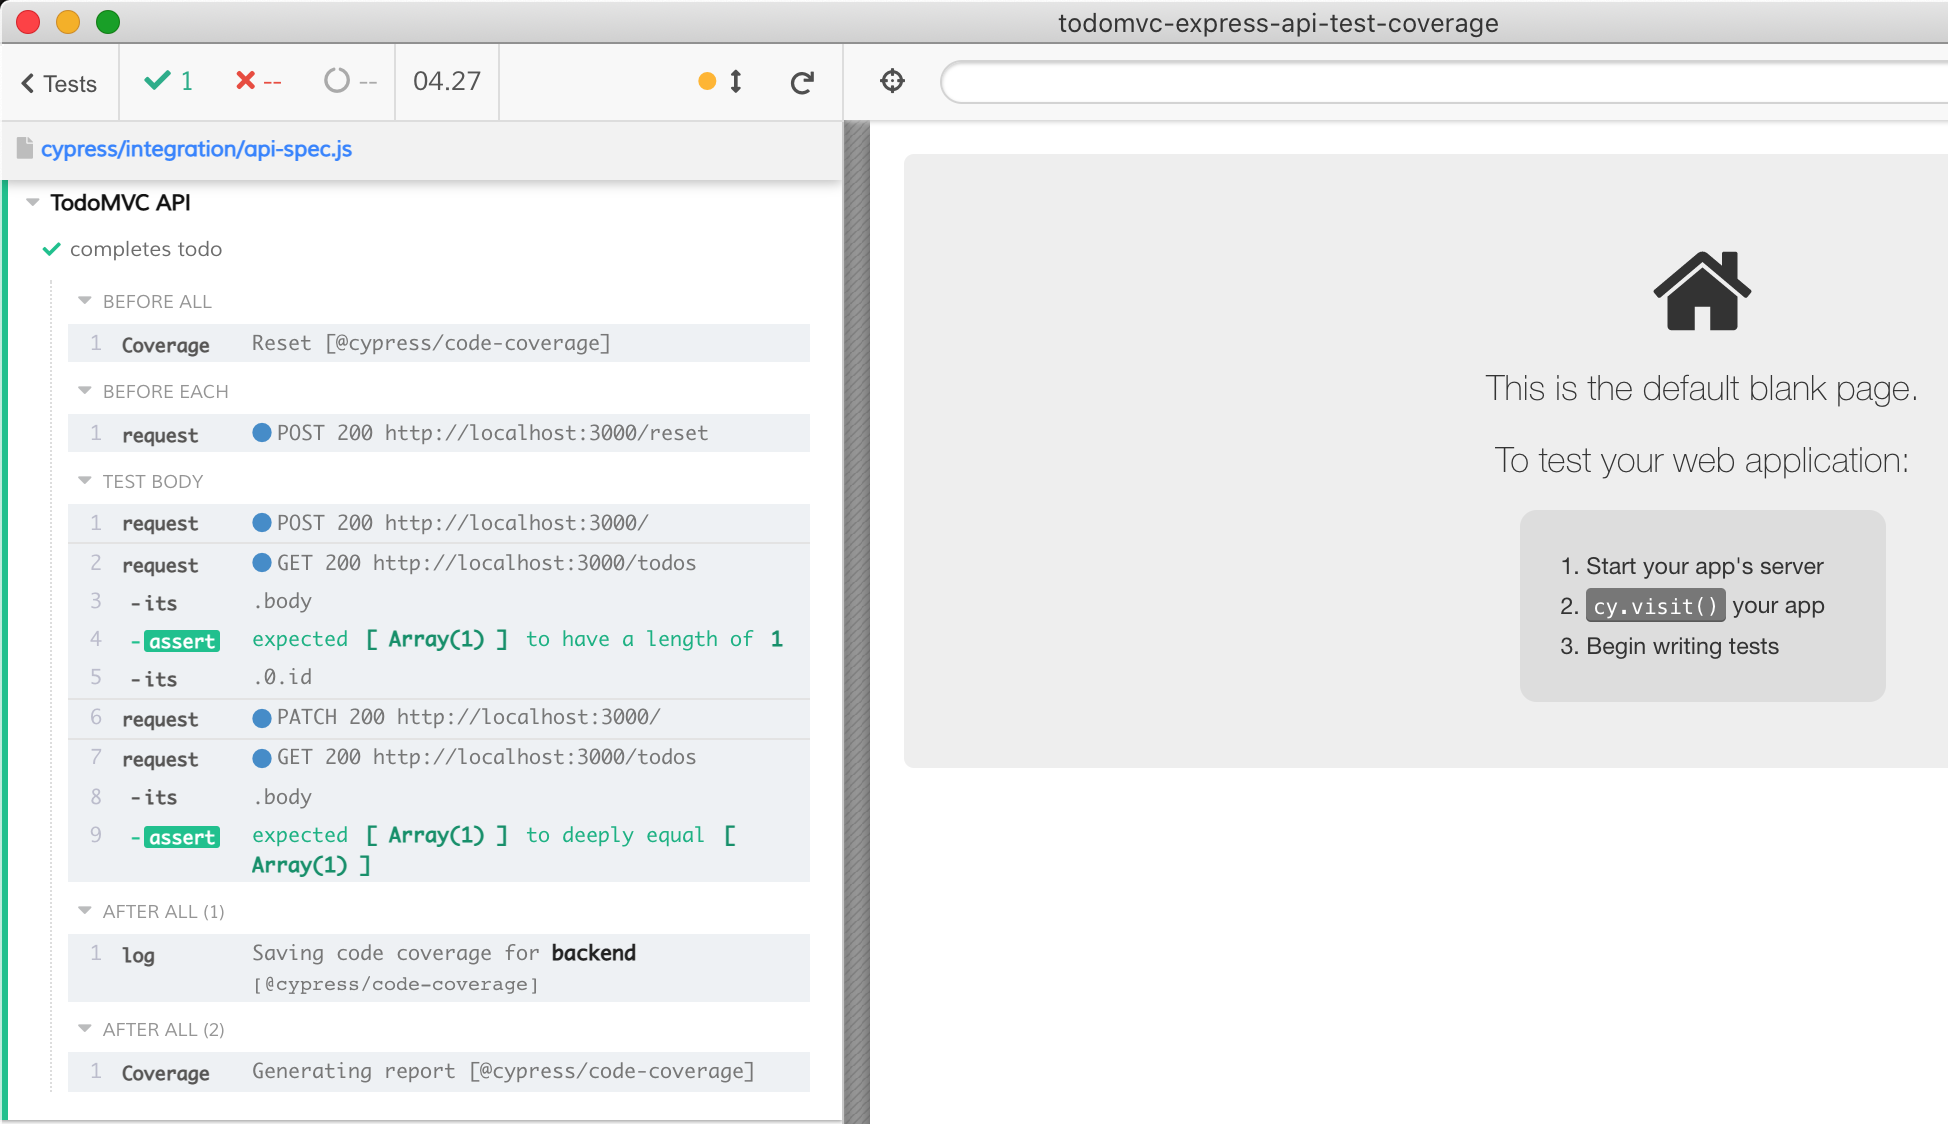
1 | it('completes todo', () => { |
The test passes locally
The pull request#2 increases the code coverage by another 6%.
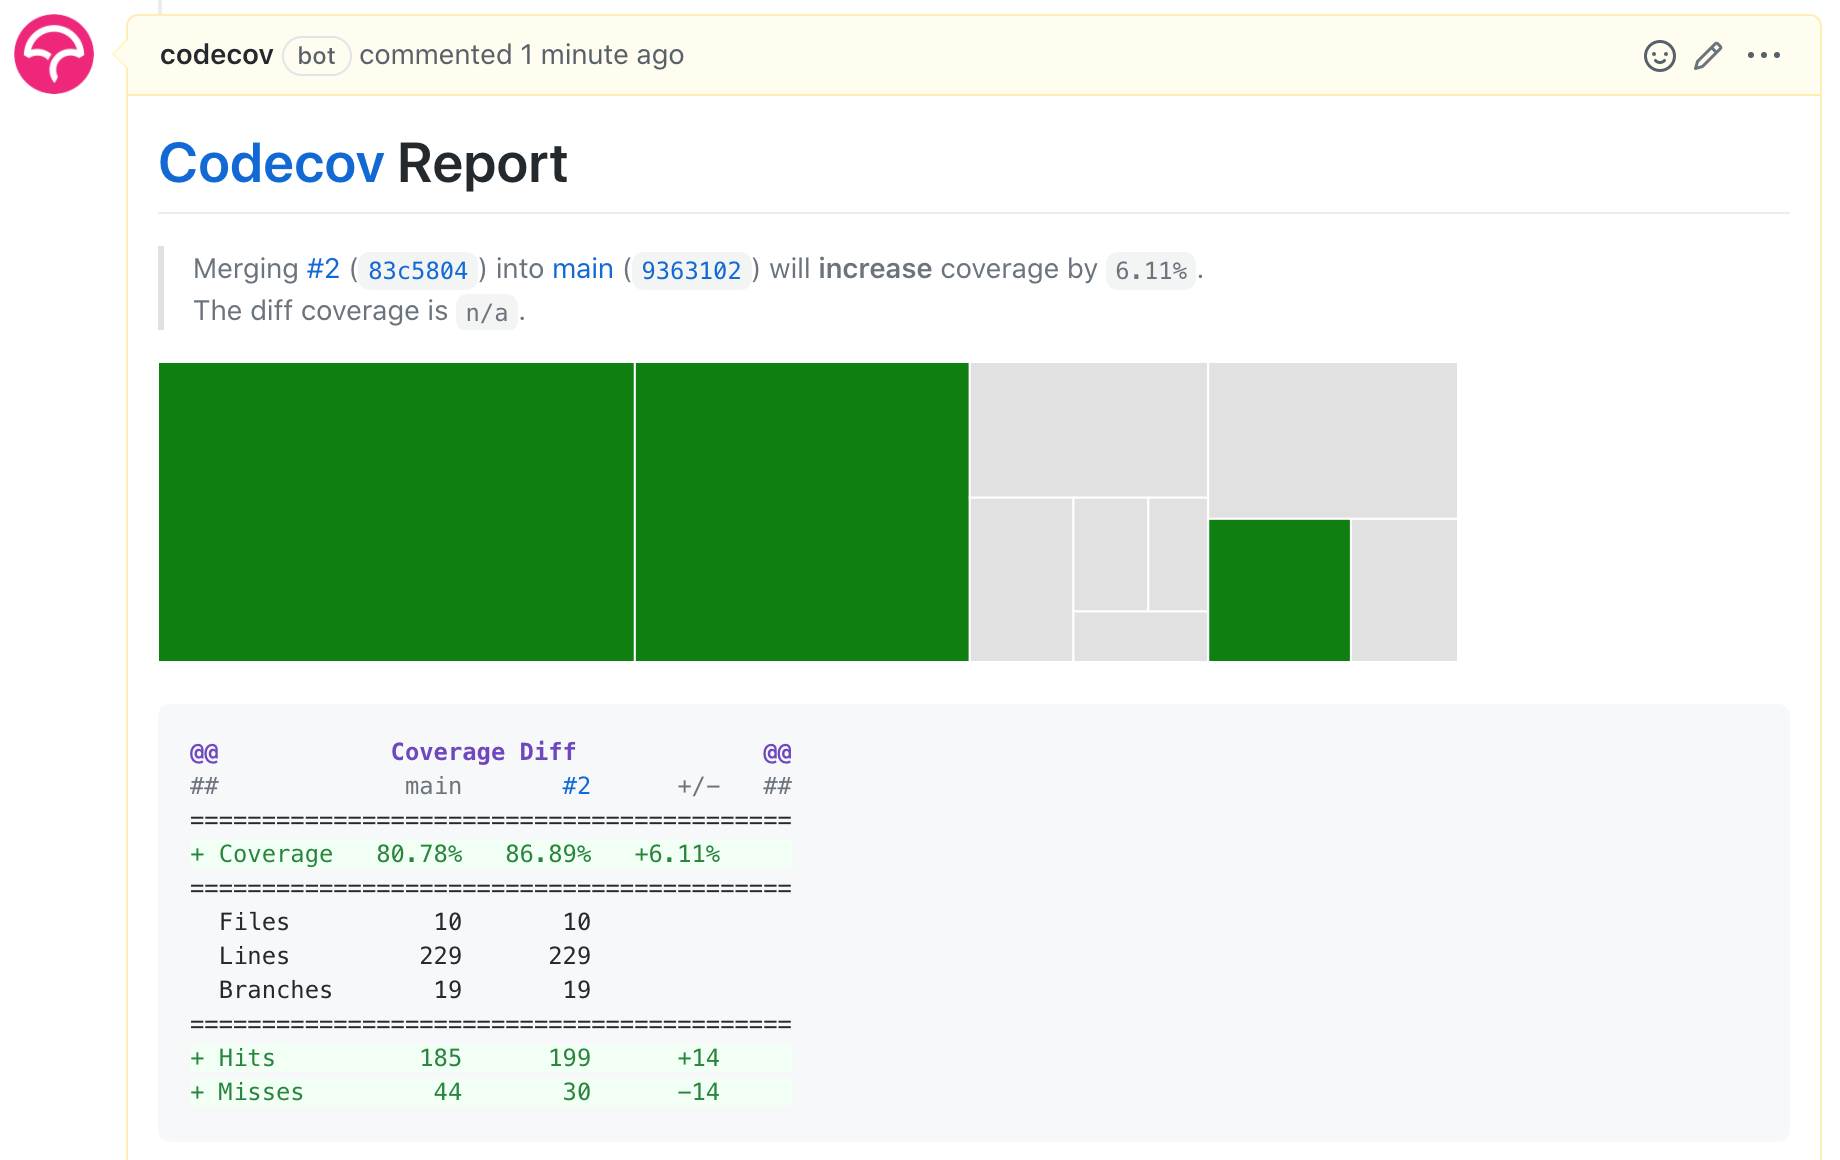
We merge it.
Clear completed todos
Next we can add a test for uncovered lines for clearCompleted function.
1 | it('clears completed todo', () => { |
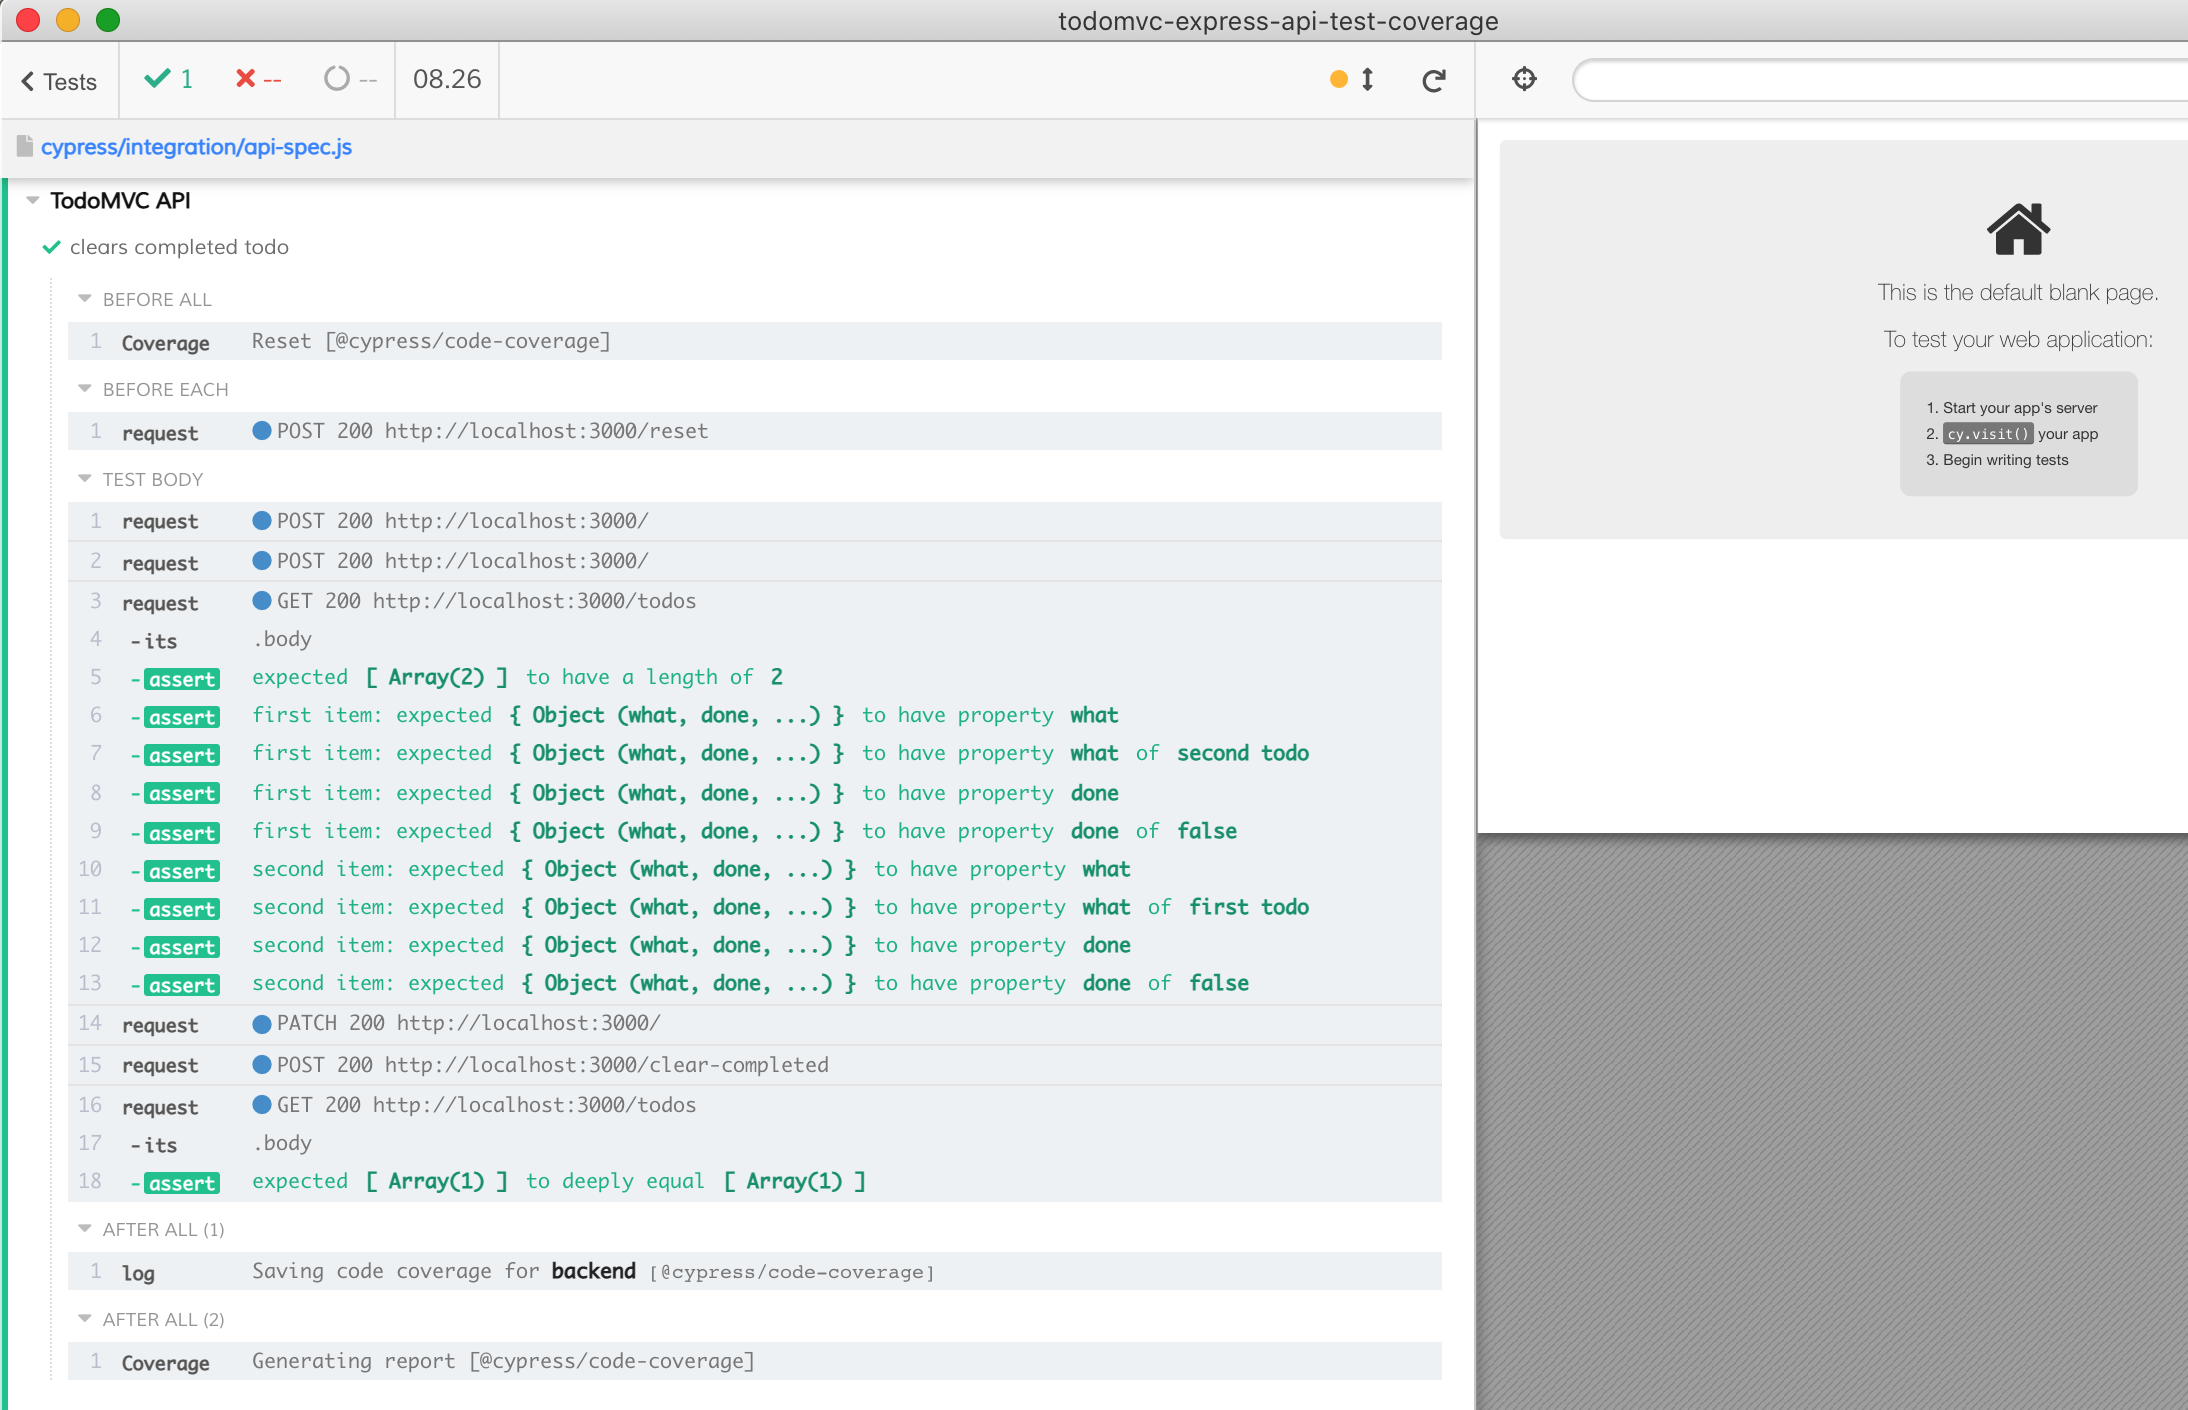
The pull request #3 increases the code coverage by 4%

Individual pages
Inspecting the lines not covered by tests we can find handlers for the individual pages
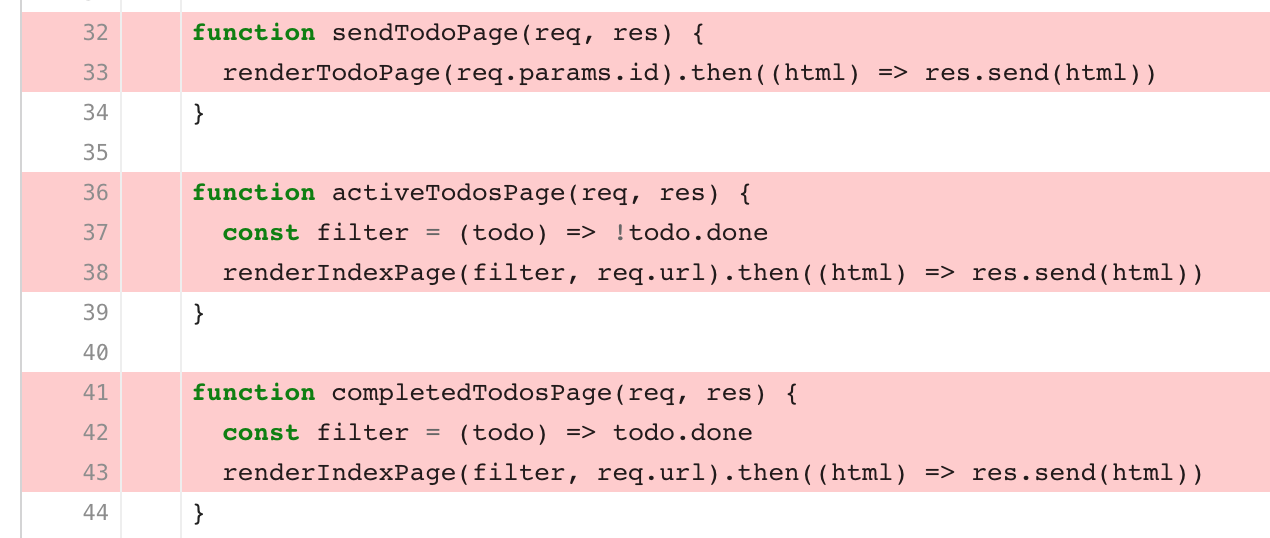
The above functions are called in response to the individual page routes
1 | app.get('/todo/:id', sendTodoPage) |
Let's test these pages. For example to test the individual todo item page, we could do
1 | it('has todo page', () => { |
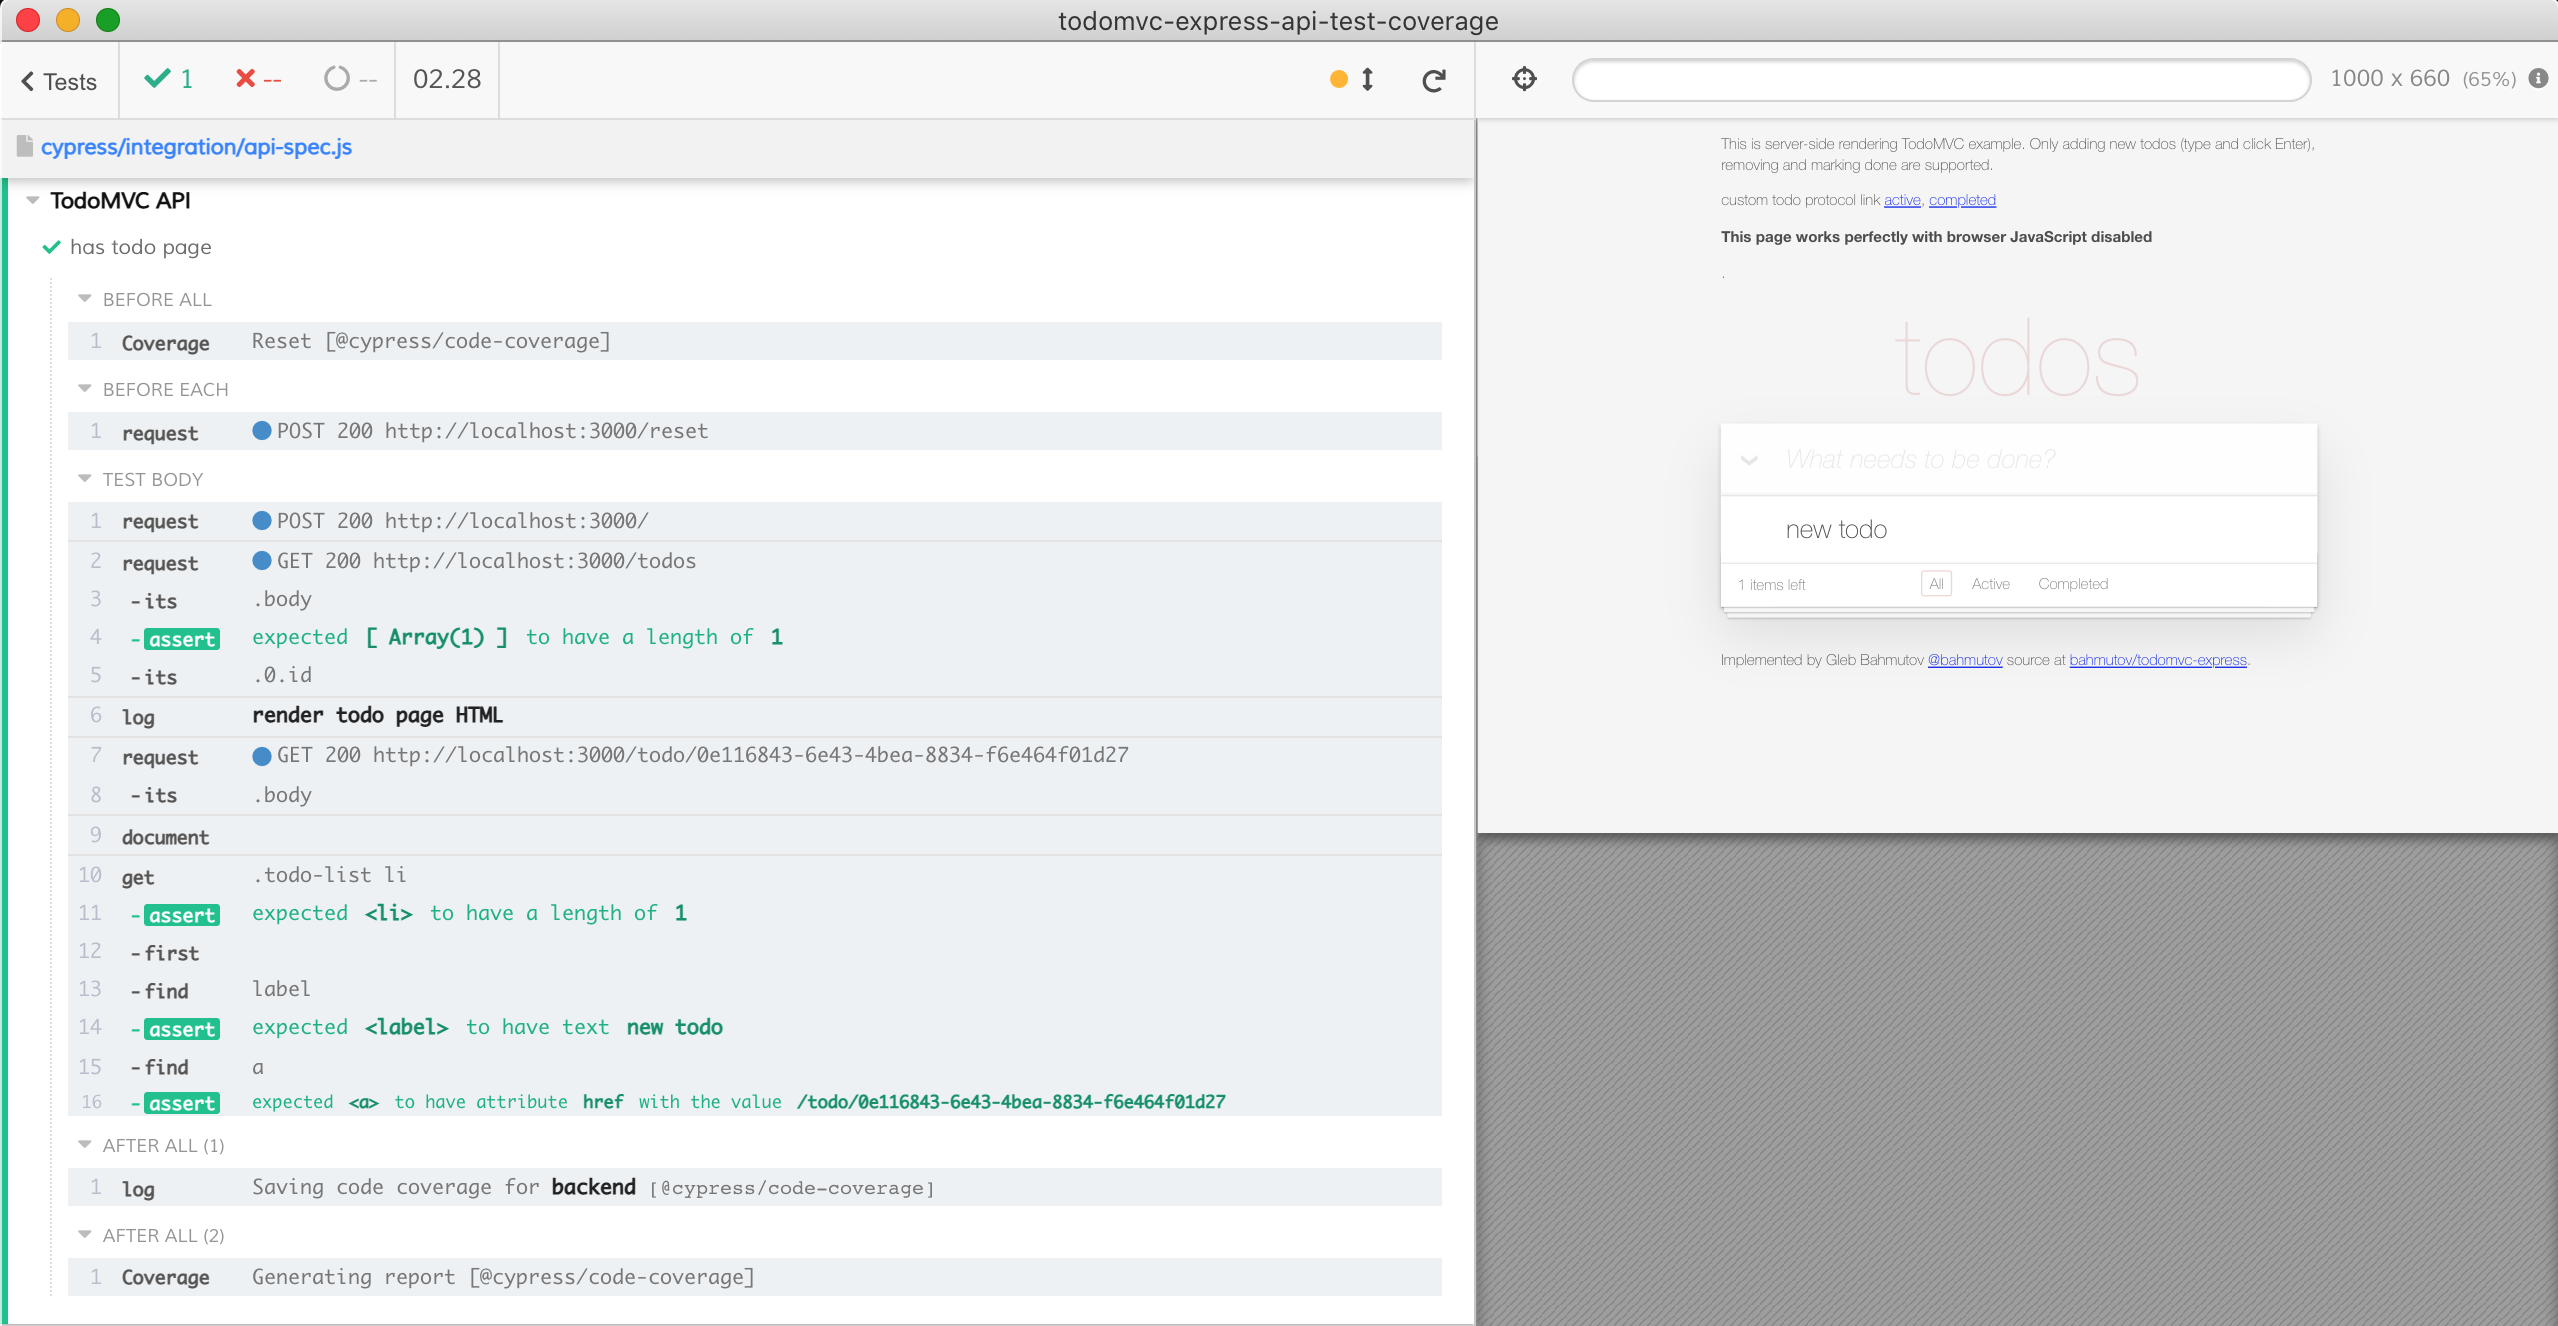
We can create a couple todos, mark one completed, the other should be displayed on the active page
1 | it('has active page', () => { |
Similarly, we can confirm the /completed page shows only the completed items, and every item has class "completed"
1 | it('has completed page', () => { |
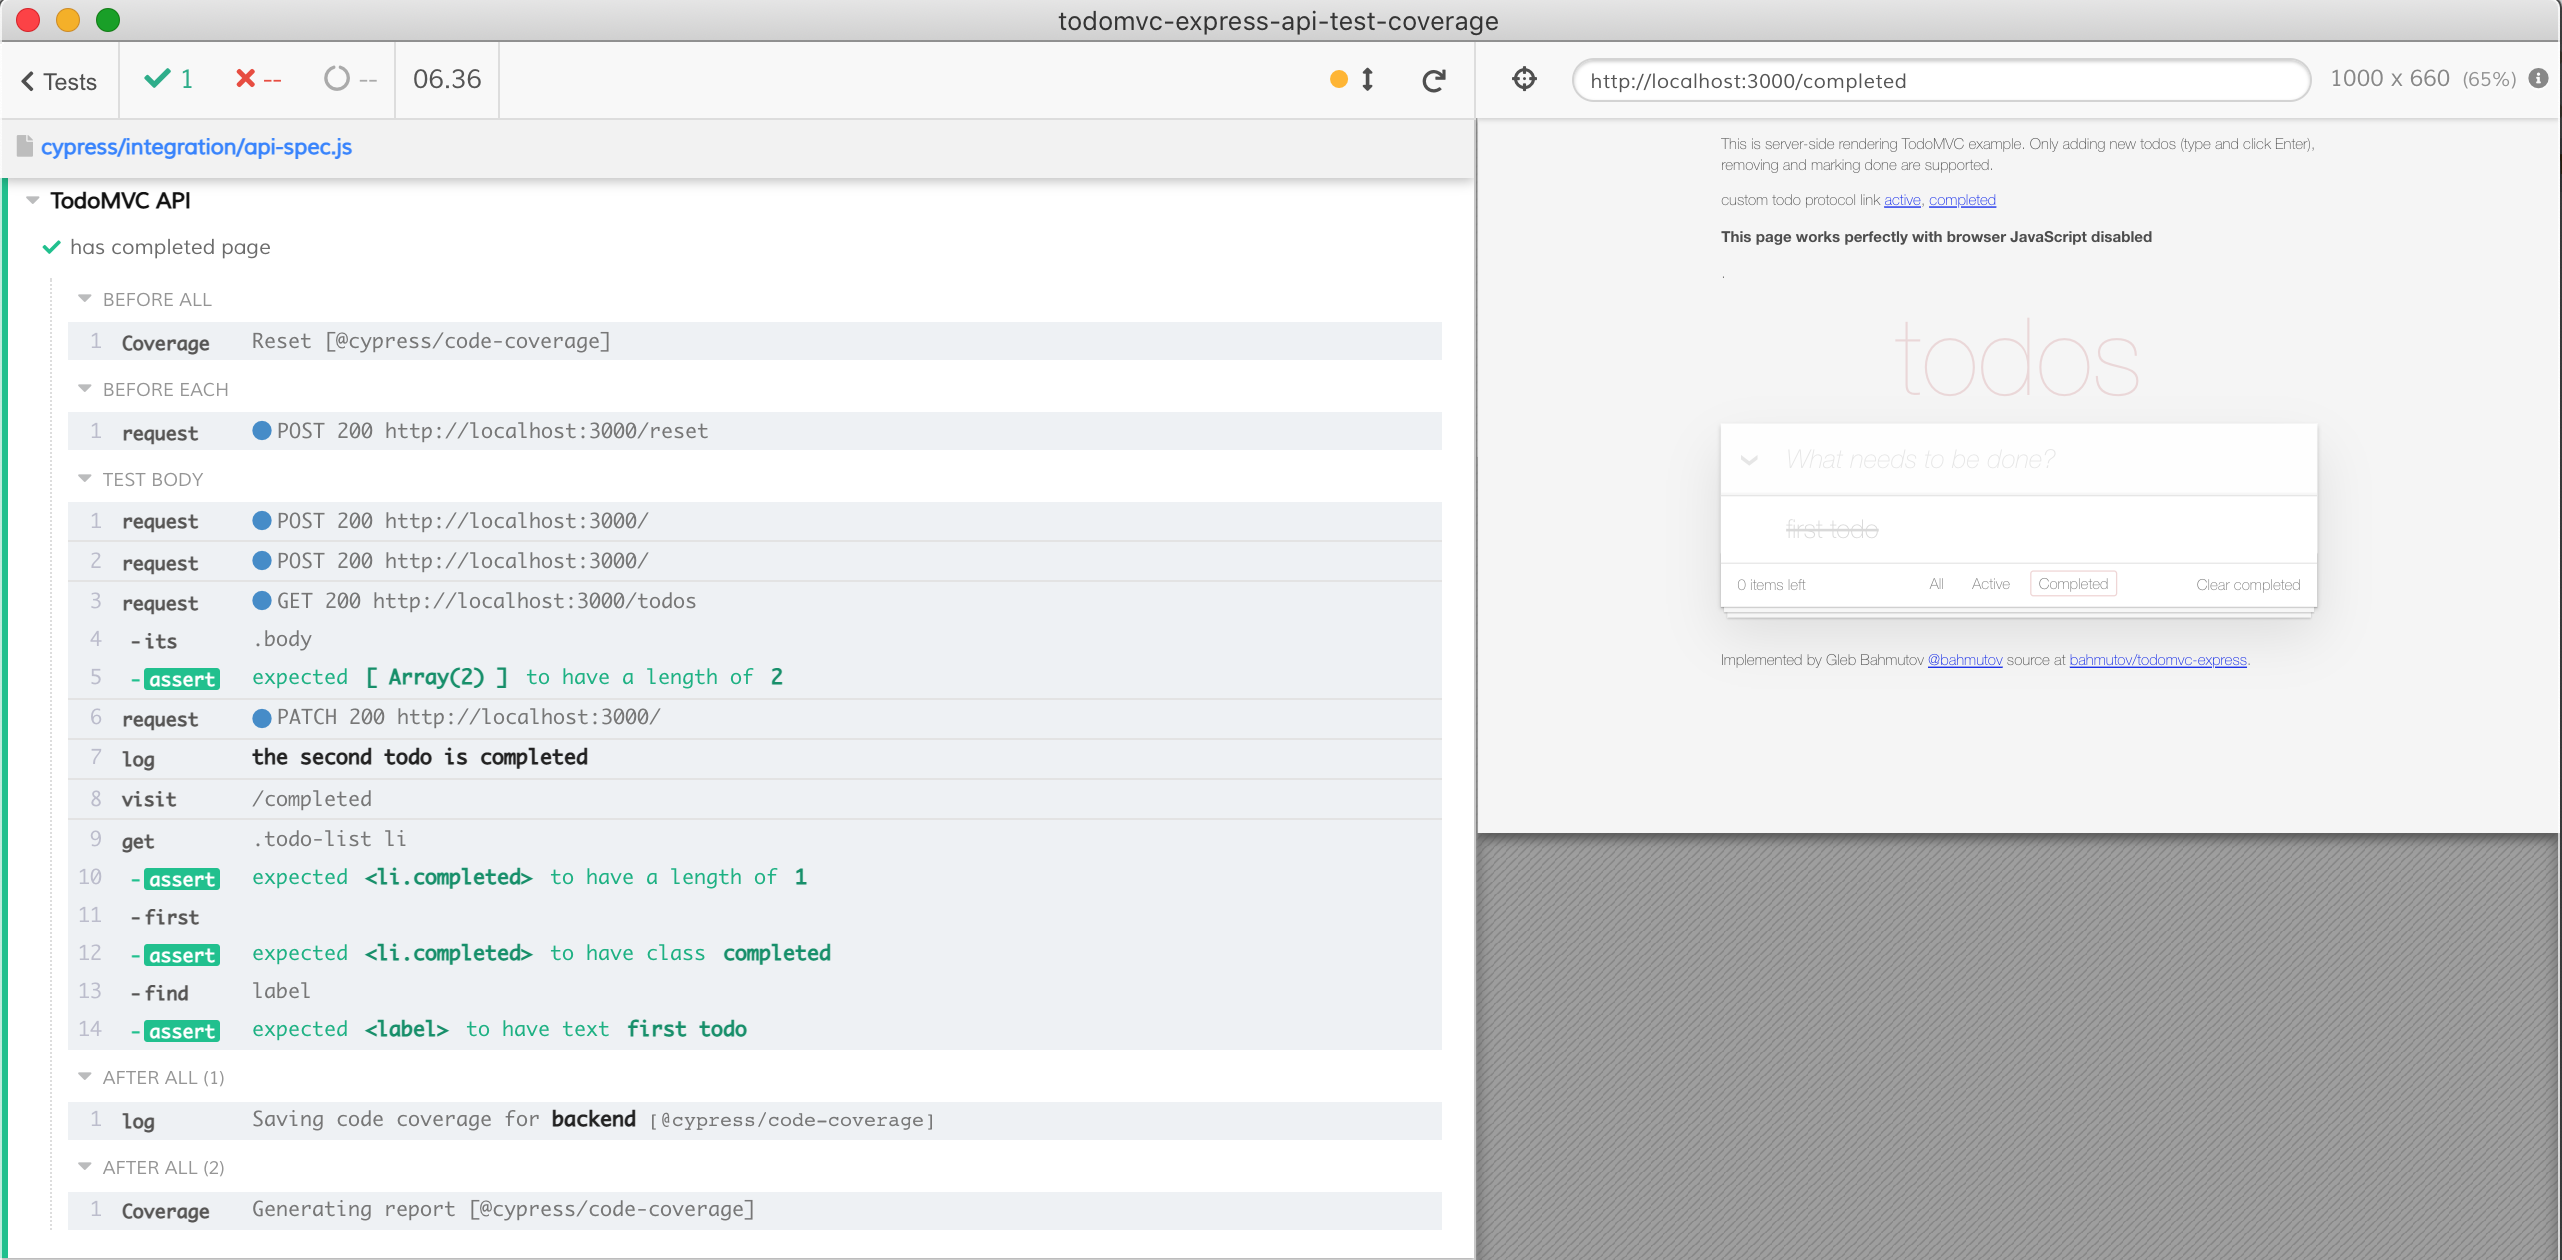
The pull request #4 increases the code coverage by another 5% to 96%
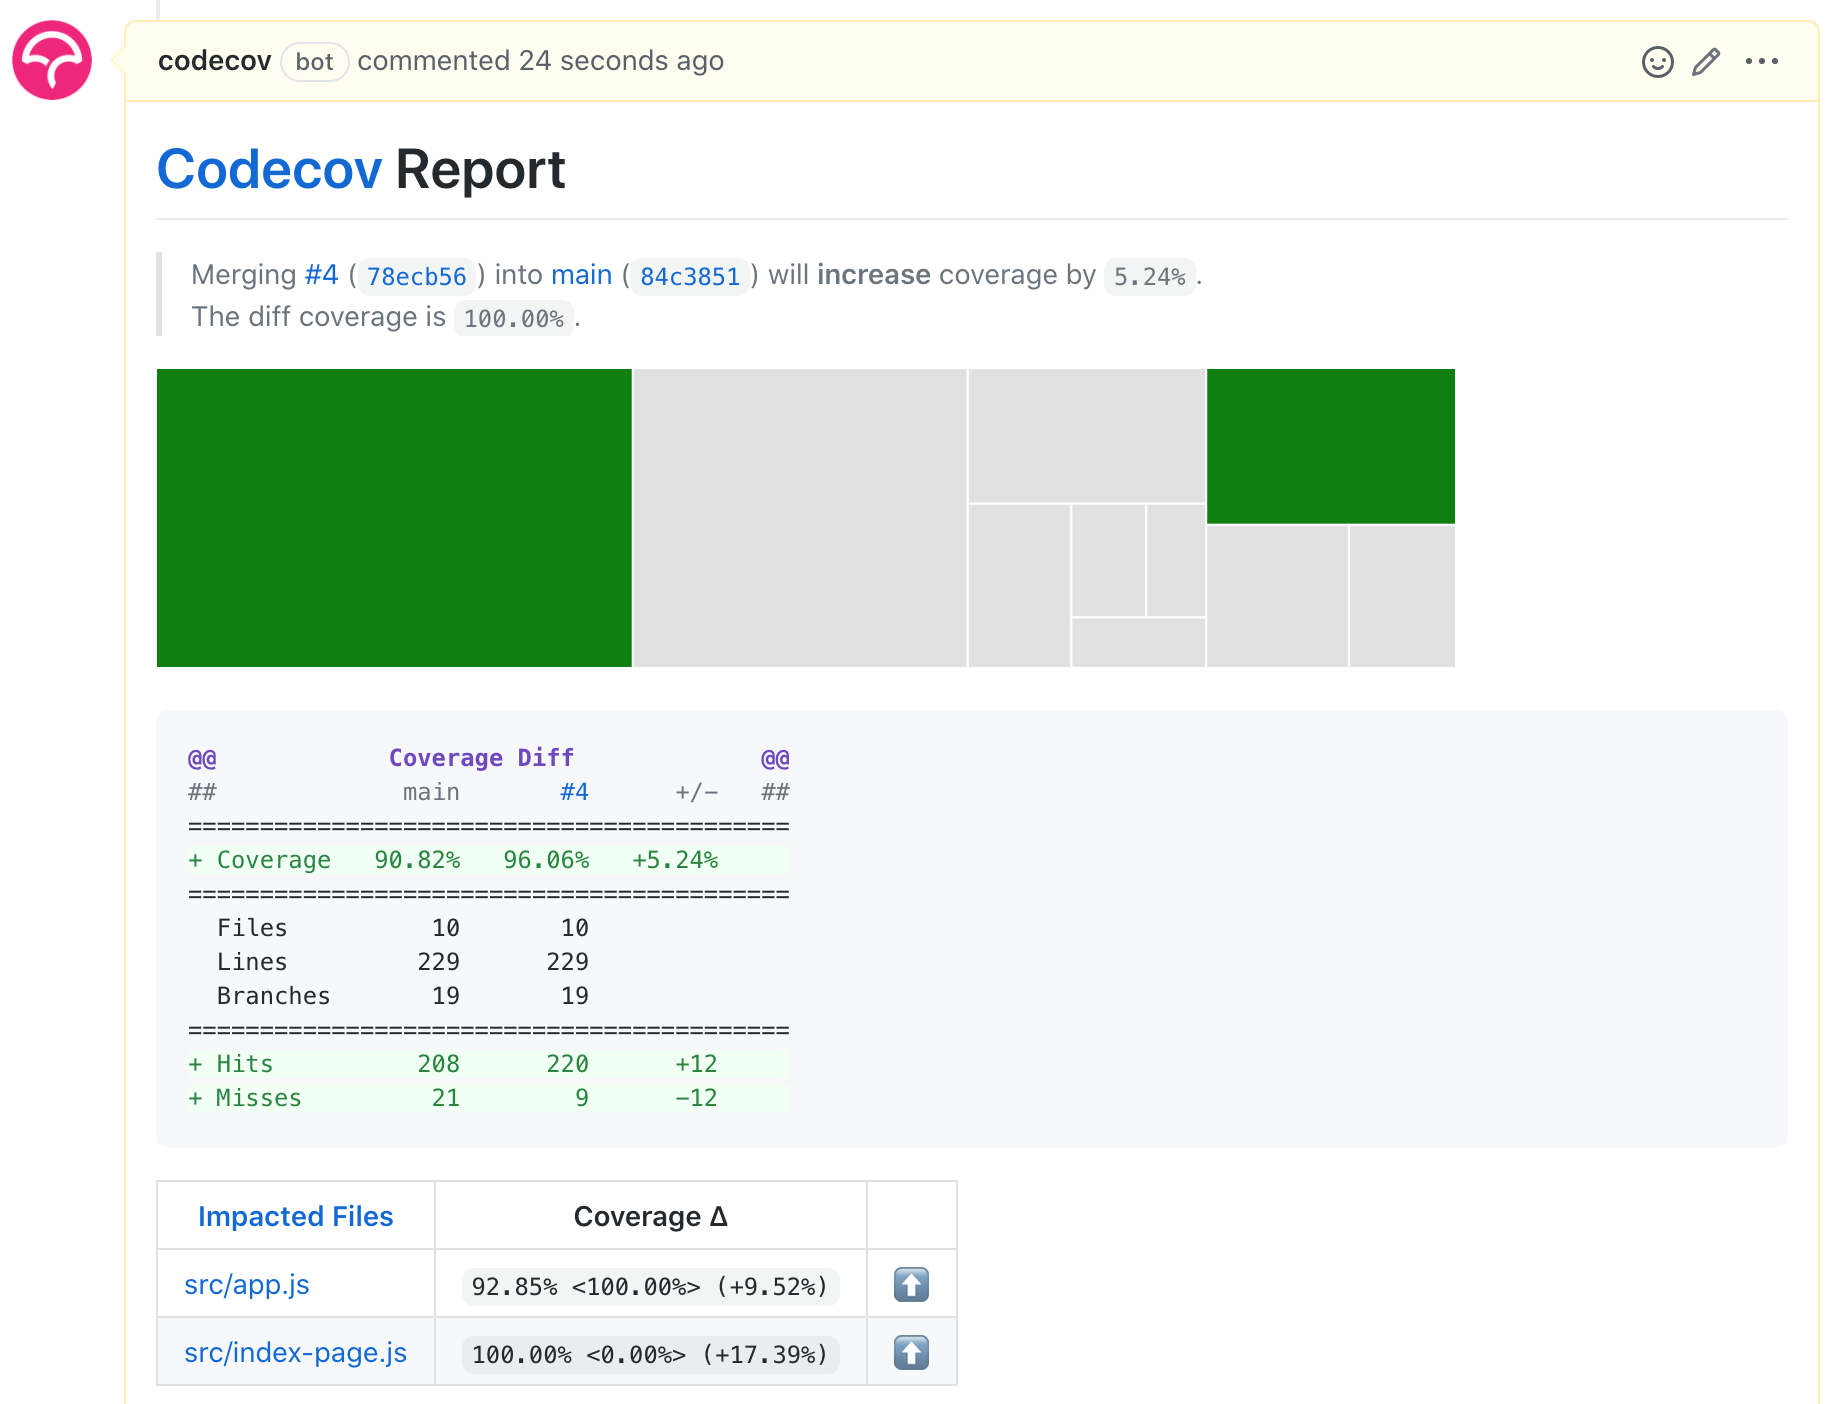
Covering the edge cases
So far we have looked at the code coverage and added the tests for the features, like adding todos, deleting them, marking them completed. We have reached 96% code coverage this way. What remains now are the individual uncovered lines that really are edge cases in our code. For example, trying to delete a non-existent todo item is an edge case:
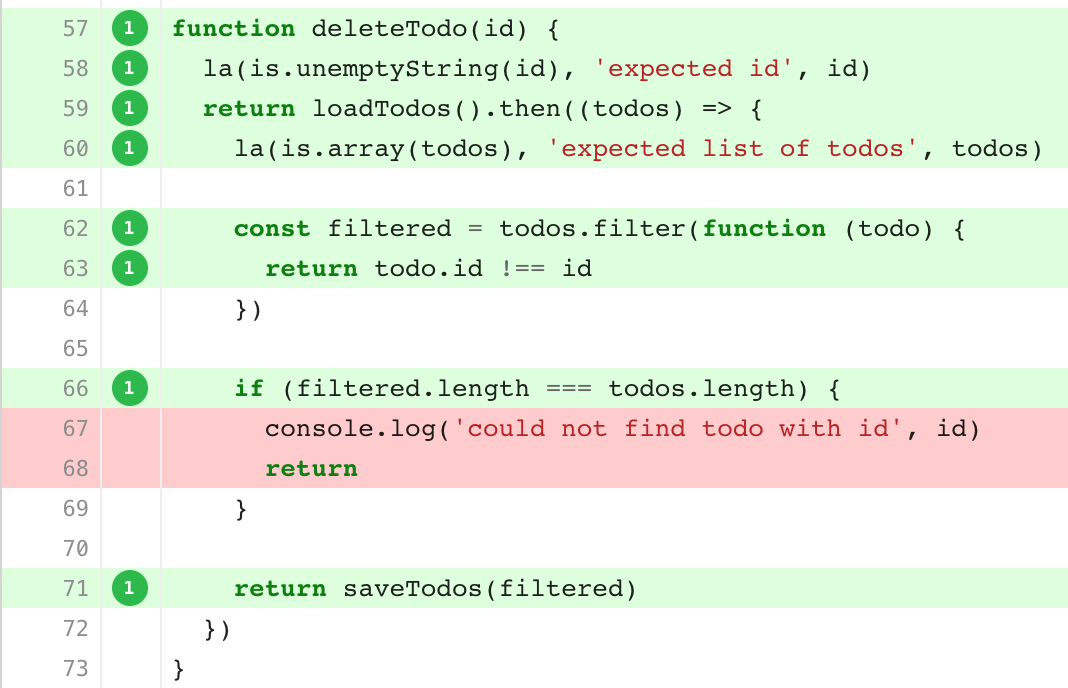
Usually such edge cases are hard to reach through the typical UI - after all, if the application has been wired correctly it should not try deleting a non-existent todo. The API tests on the other hand are ideal - we can just execute a DELETE action passing a random ID to reach these lines.
When adding an edge case test to the "delete" feature, I like to organize such tests under a suite of tests.
1 | // instead of a single "deletes todo" test |
💡 As the suites of tests grow you can move them into own spec file, and even split into a group of specs kept in a subfolder, see Make Cypress Run Faster by Splitting Specs.
The test its the delete endpoint
1 | it('handles non-existent ID', () => { |
It passes
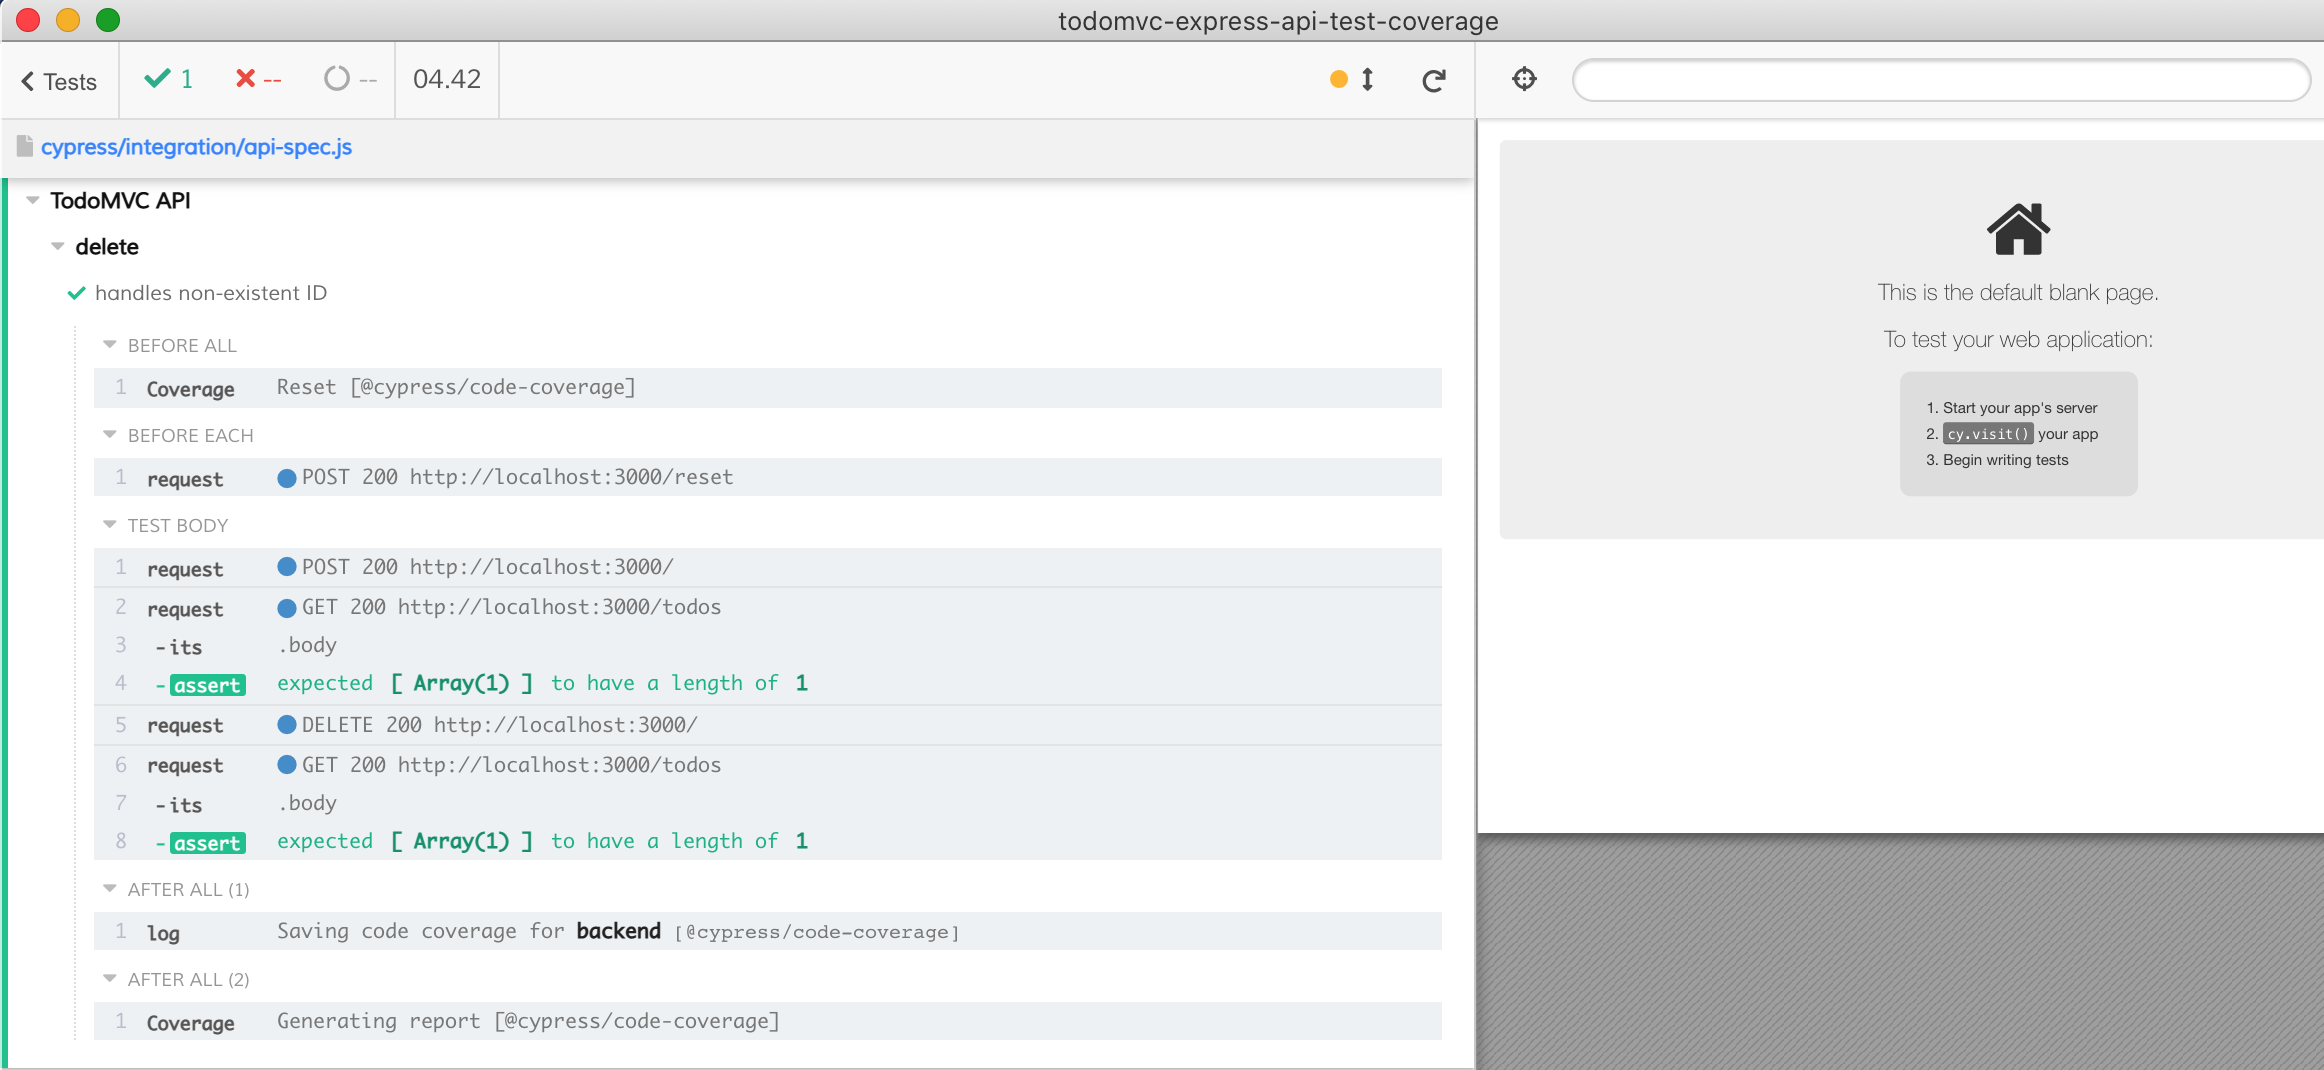
When working on the edge cases, I like running the test by itself and then checking the coverage report saved locally after the test. I see the above test precisely hits the lines we wanted to hit.
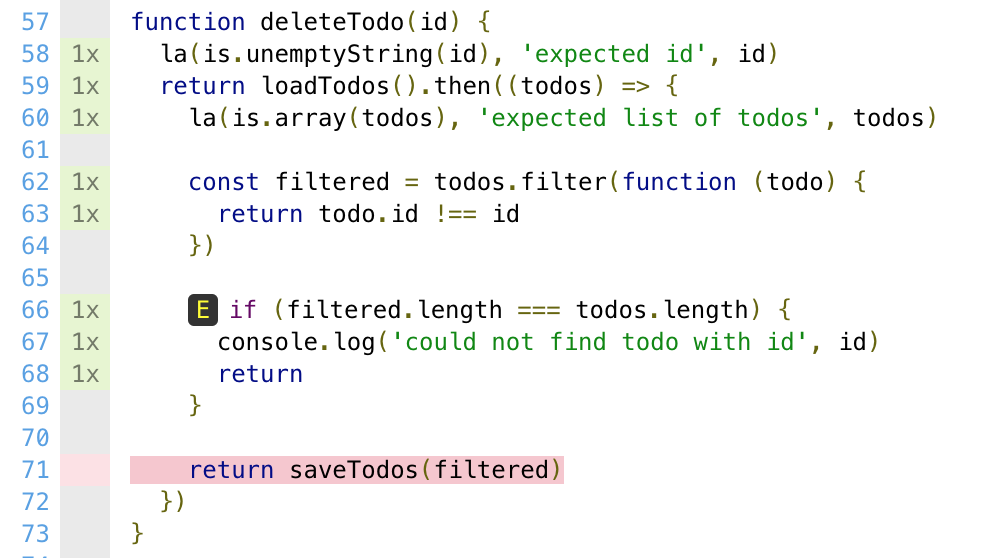
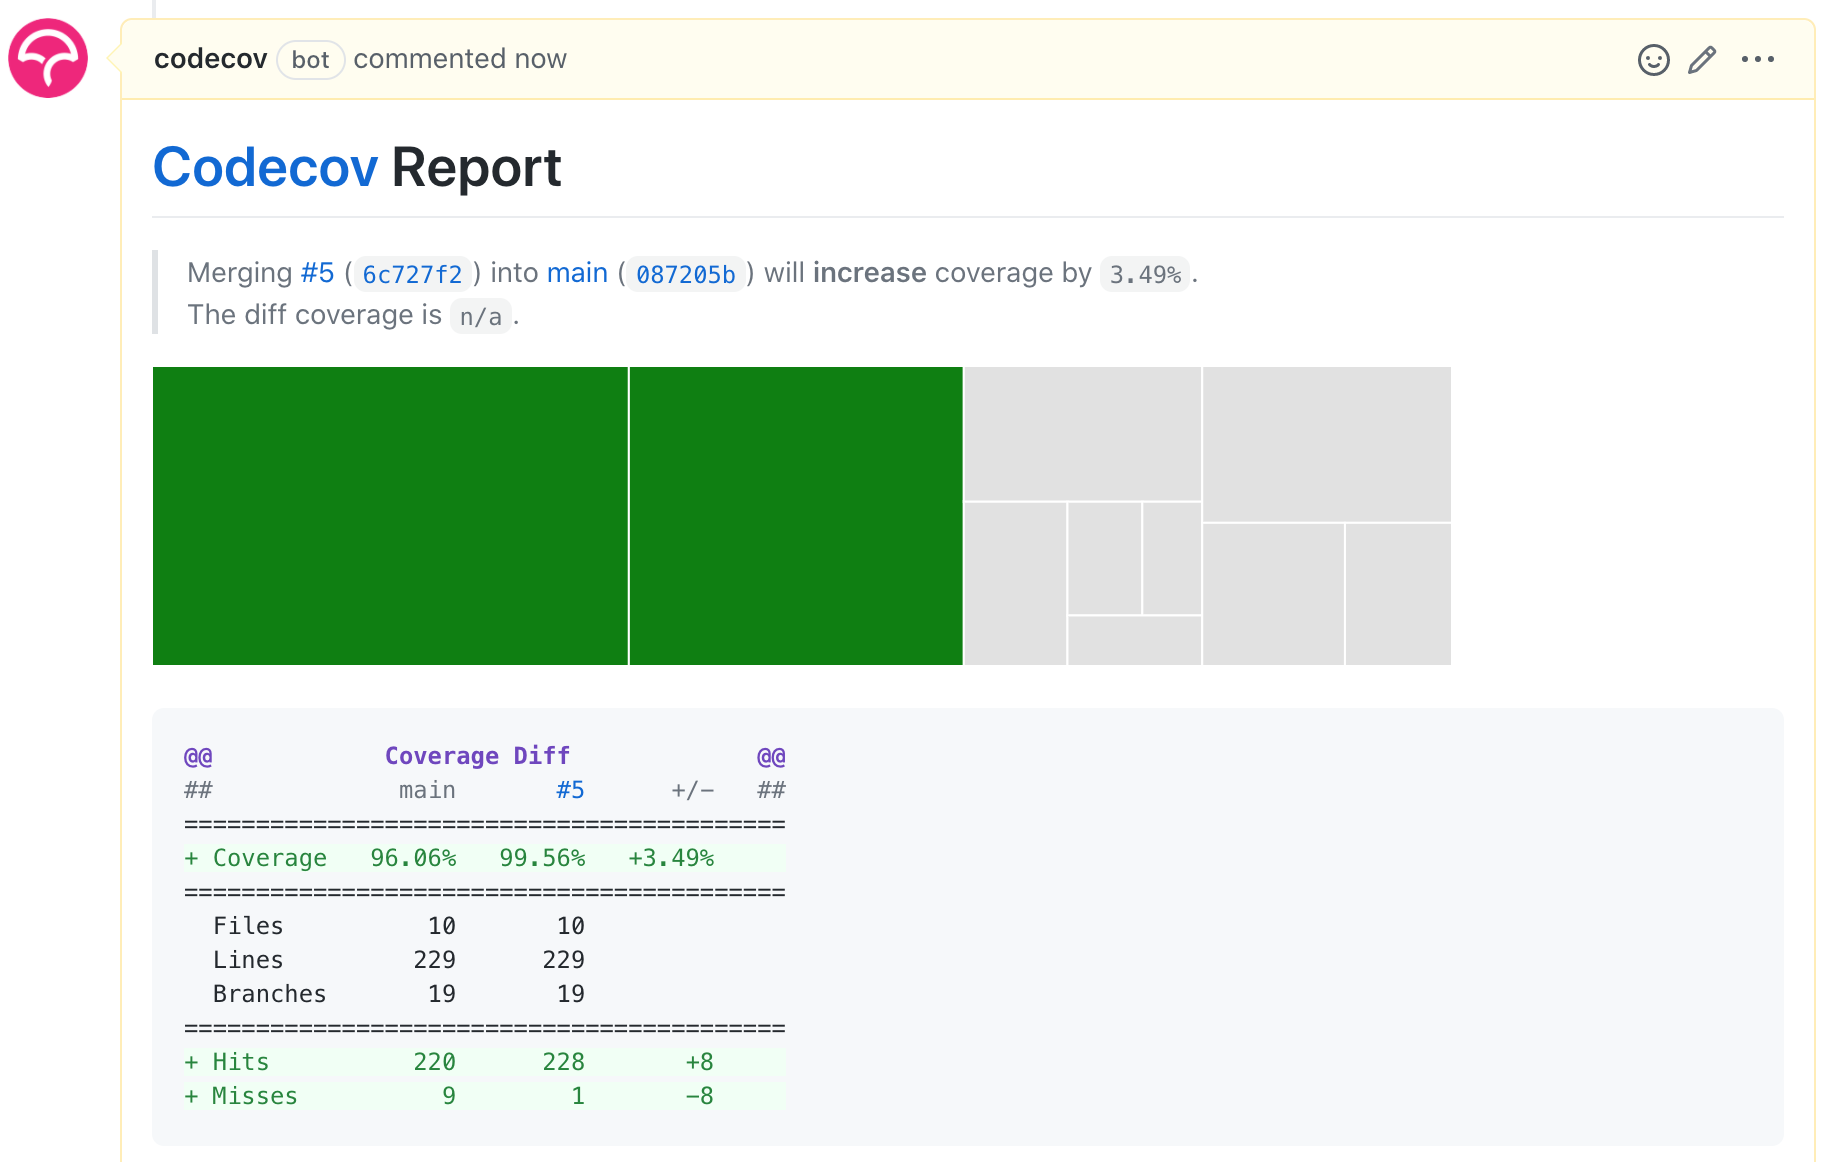
You can find this and other edge case tests in the pull request #5. Covering the edge cases pushes the total code coverage to 99.5%
The last step to reach 100
If we look at the report and drill into the missing coverage, we see that our tests missed just a single source line
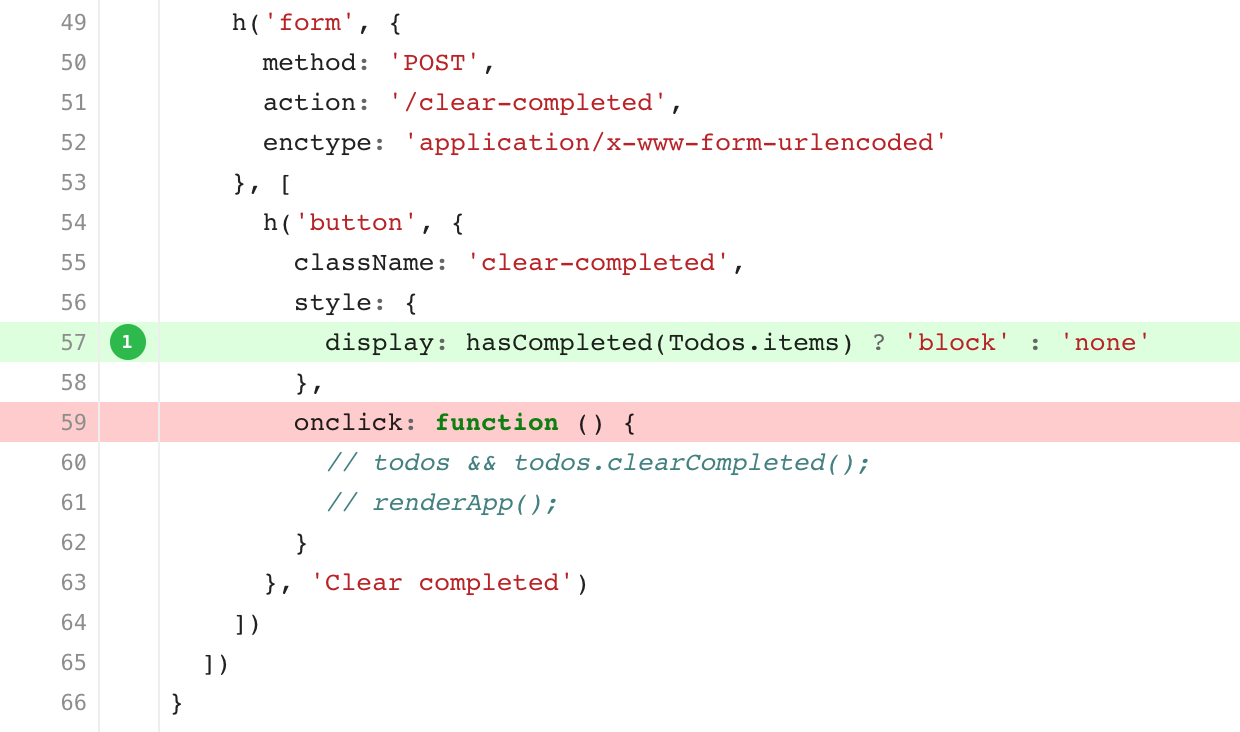
This line is not needed, the "clear completed" button works even without a JavaScript handler, since it is part of the form. In fact, this code line is a leftover and should not remain in our server-rendered app. We can confirm this by removing the source line and adding a test that clicks on the "Clear completed" button. Because our target is the "render" UI code, we want to test this code by visiting the page and interacting with the UI elements, rather than by simply hitting the API endpoints
1 | it('clears completed todos by clicking the button', () => { |
The test passes
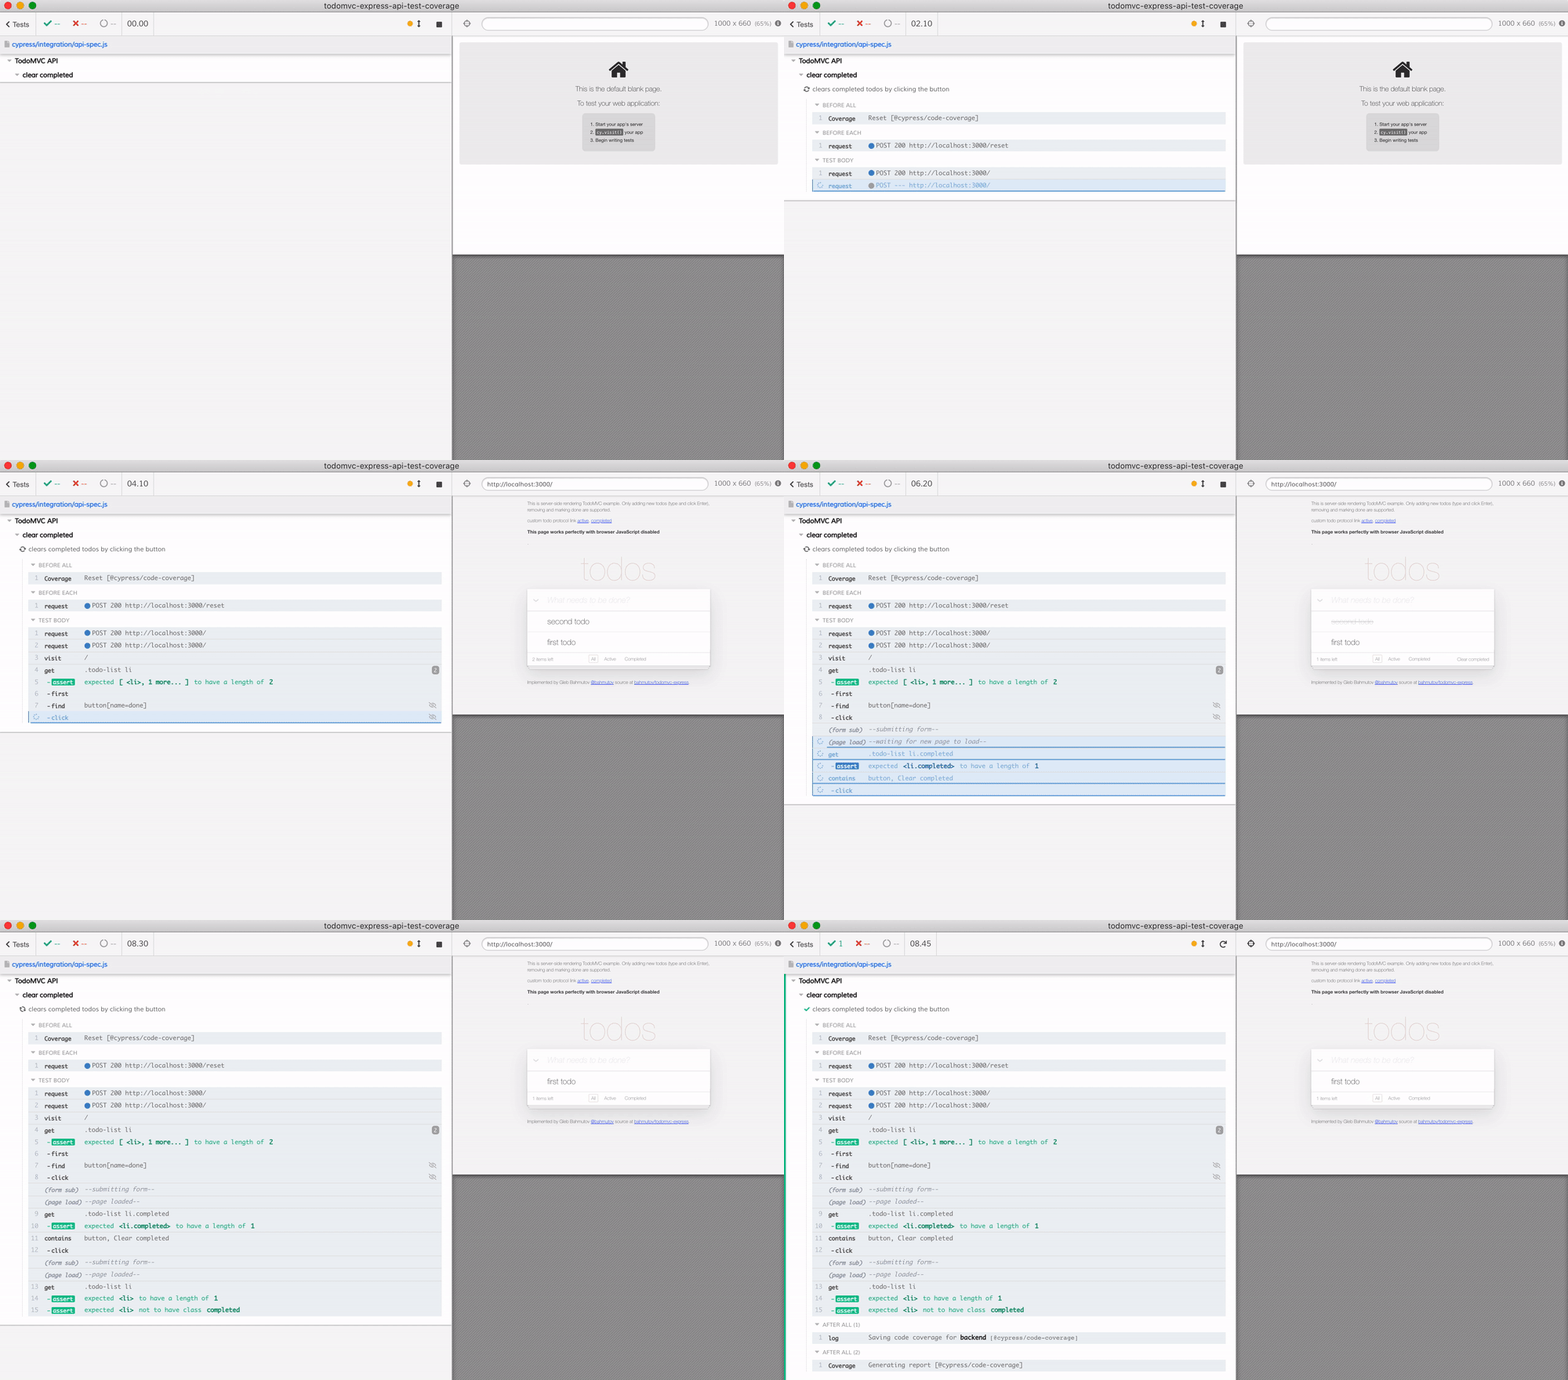
The pull request #6 shows the result
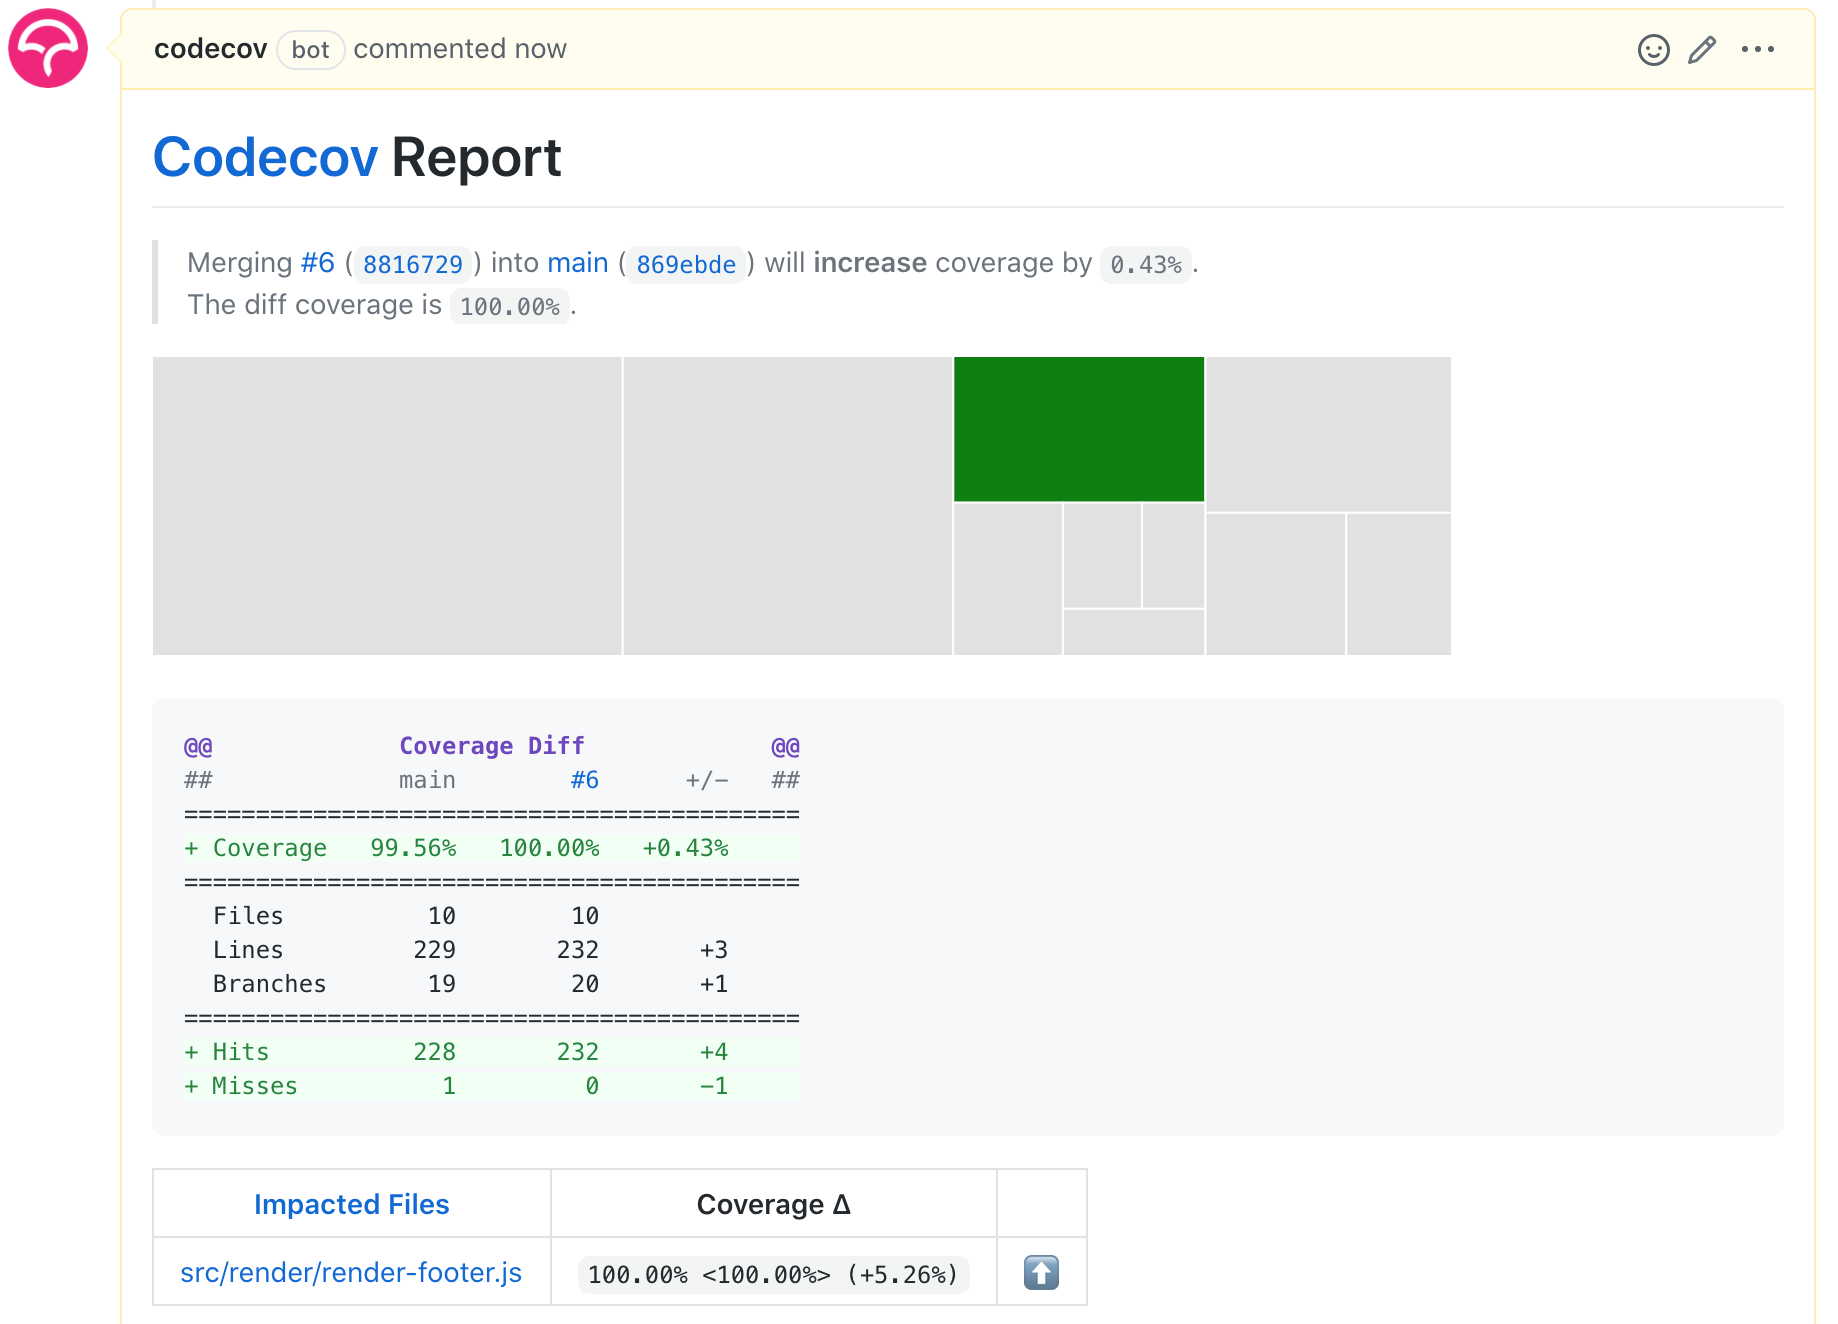
100%
See also
- Code Coverage for End-to-end Tests
- Cypress code coverage plugin
- the first Cypress code coverage webinar
- Cypress code coverage guide
- you can show code coverage badges and compare the code coverage to the main branch using scripts from my bahmutov/check-code-coverage package