In my previous blog post "Add GUI to your E2E API tests" I have used cy.request command to execute HTTP requests against a backend performing a black box API testing. In this blog post I will show a new custom command cy.api that can take such API testing to the next level. In addition to the new user interface for your API requests, if you capture all server logs using @bahmutov/all-logs, then the API tests will capture those messages too, allowing you deep insight into what is happening on each API request.
- The API testing problem
- Example - adding numbers
- cy-api plugin
- Multiple tests
- Multiple API calls in the same test
- Logs
- Using logs in test
- Concat messages
- Conclusions
- See also
The API testing problem
I have written A LOT of API tests, mostly against REST backends. For our Cypress Dashboard REST API we have more than 1000 API tests ... so writing and debugging failing tests is a big part of my job. A typical test:
- sets the state using database model queries
- then uses supertest to call an HTTP endpoint
- and checks the response
Here is a typical simple supertest test case
1 | // server code |
The test runs against the server instance, but might as well test against an URL - to keep a better separation between the test context and the server.
1 | // test server running at localhost:5555 |
I call this type of testing "black box" testing because we treat the API as an unknown entity that only communicates through HTTP requests and responses. When doing realistic tests, we need to make several calls: setting data, updating it, checking it. For example, testing if the user can create a new article using API might take several requests:
1 | it('creates an article for a user', async () => { |
There is a lot of logic that the backend goes through in order to process those test requests. There is just a slight problem - if a test fails, it is hard to debug why. I have to re-start the server with verbose logs (sometimes enabled for a specific namespace to limit the sudden avalanche of messages) and re-run just this particular test, then scroll through a LOT of terminal output to understand the failure.
1 | DEBUG=server:* npm run test |
This is slow and annoying. There must be a better way.
Example - adding numbers
My first example comes from the bahmutov/server-logs-example repo. The server there responds to "GET /" requests with the sum of passed numbers. For example we can ask the server to add 2 and 3 together (I am using httpie instead of curl)
1 | $ http ':7000/?a=2&b=3' |
Let's write an end-to-end test for this server. I will use Cypress Test Runner so I can have a GUI during testing. Here is the first test cypress/integration/simple.js that uses cy.request and verifies the body of the response object.
1 | // https://on.cypress.io/intelligent-code-completion |
The test passes - I can see the green assertion in the Command Log.
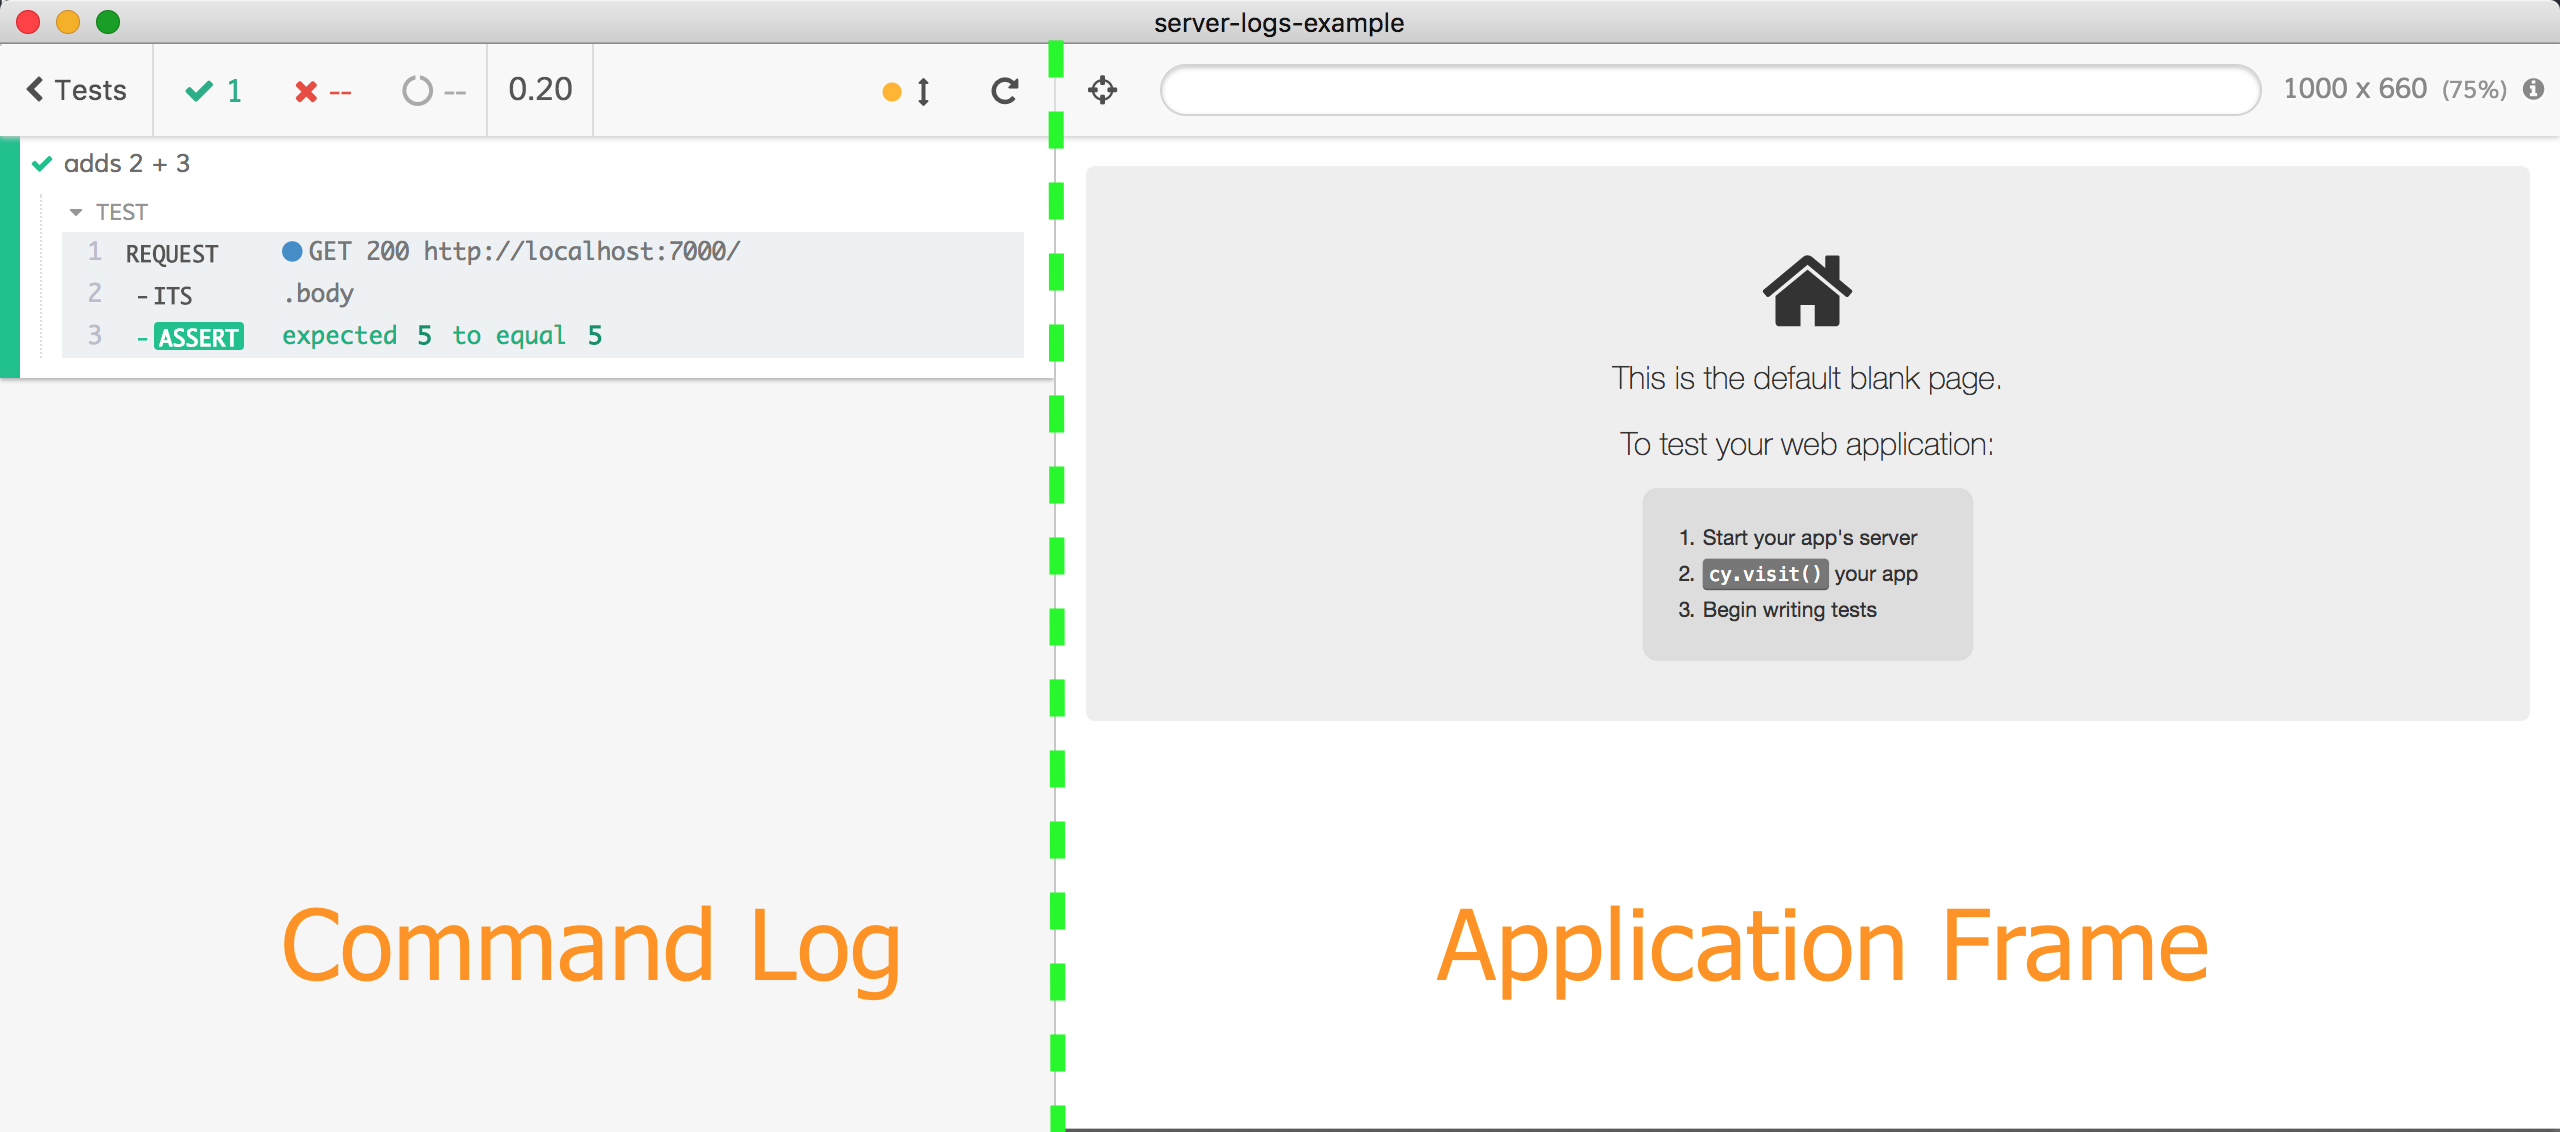
Hmm, but what did we send to the server? The Command Log does not show it - if I want to see the query parameters, I need to open the browser Developer Tools and click on the REQUEST command - then the request object is dumped to the console and I can understand what happens during the test a little bit better.
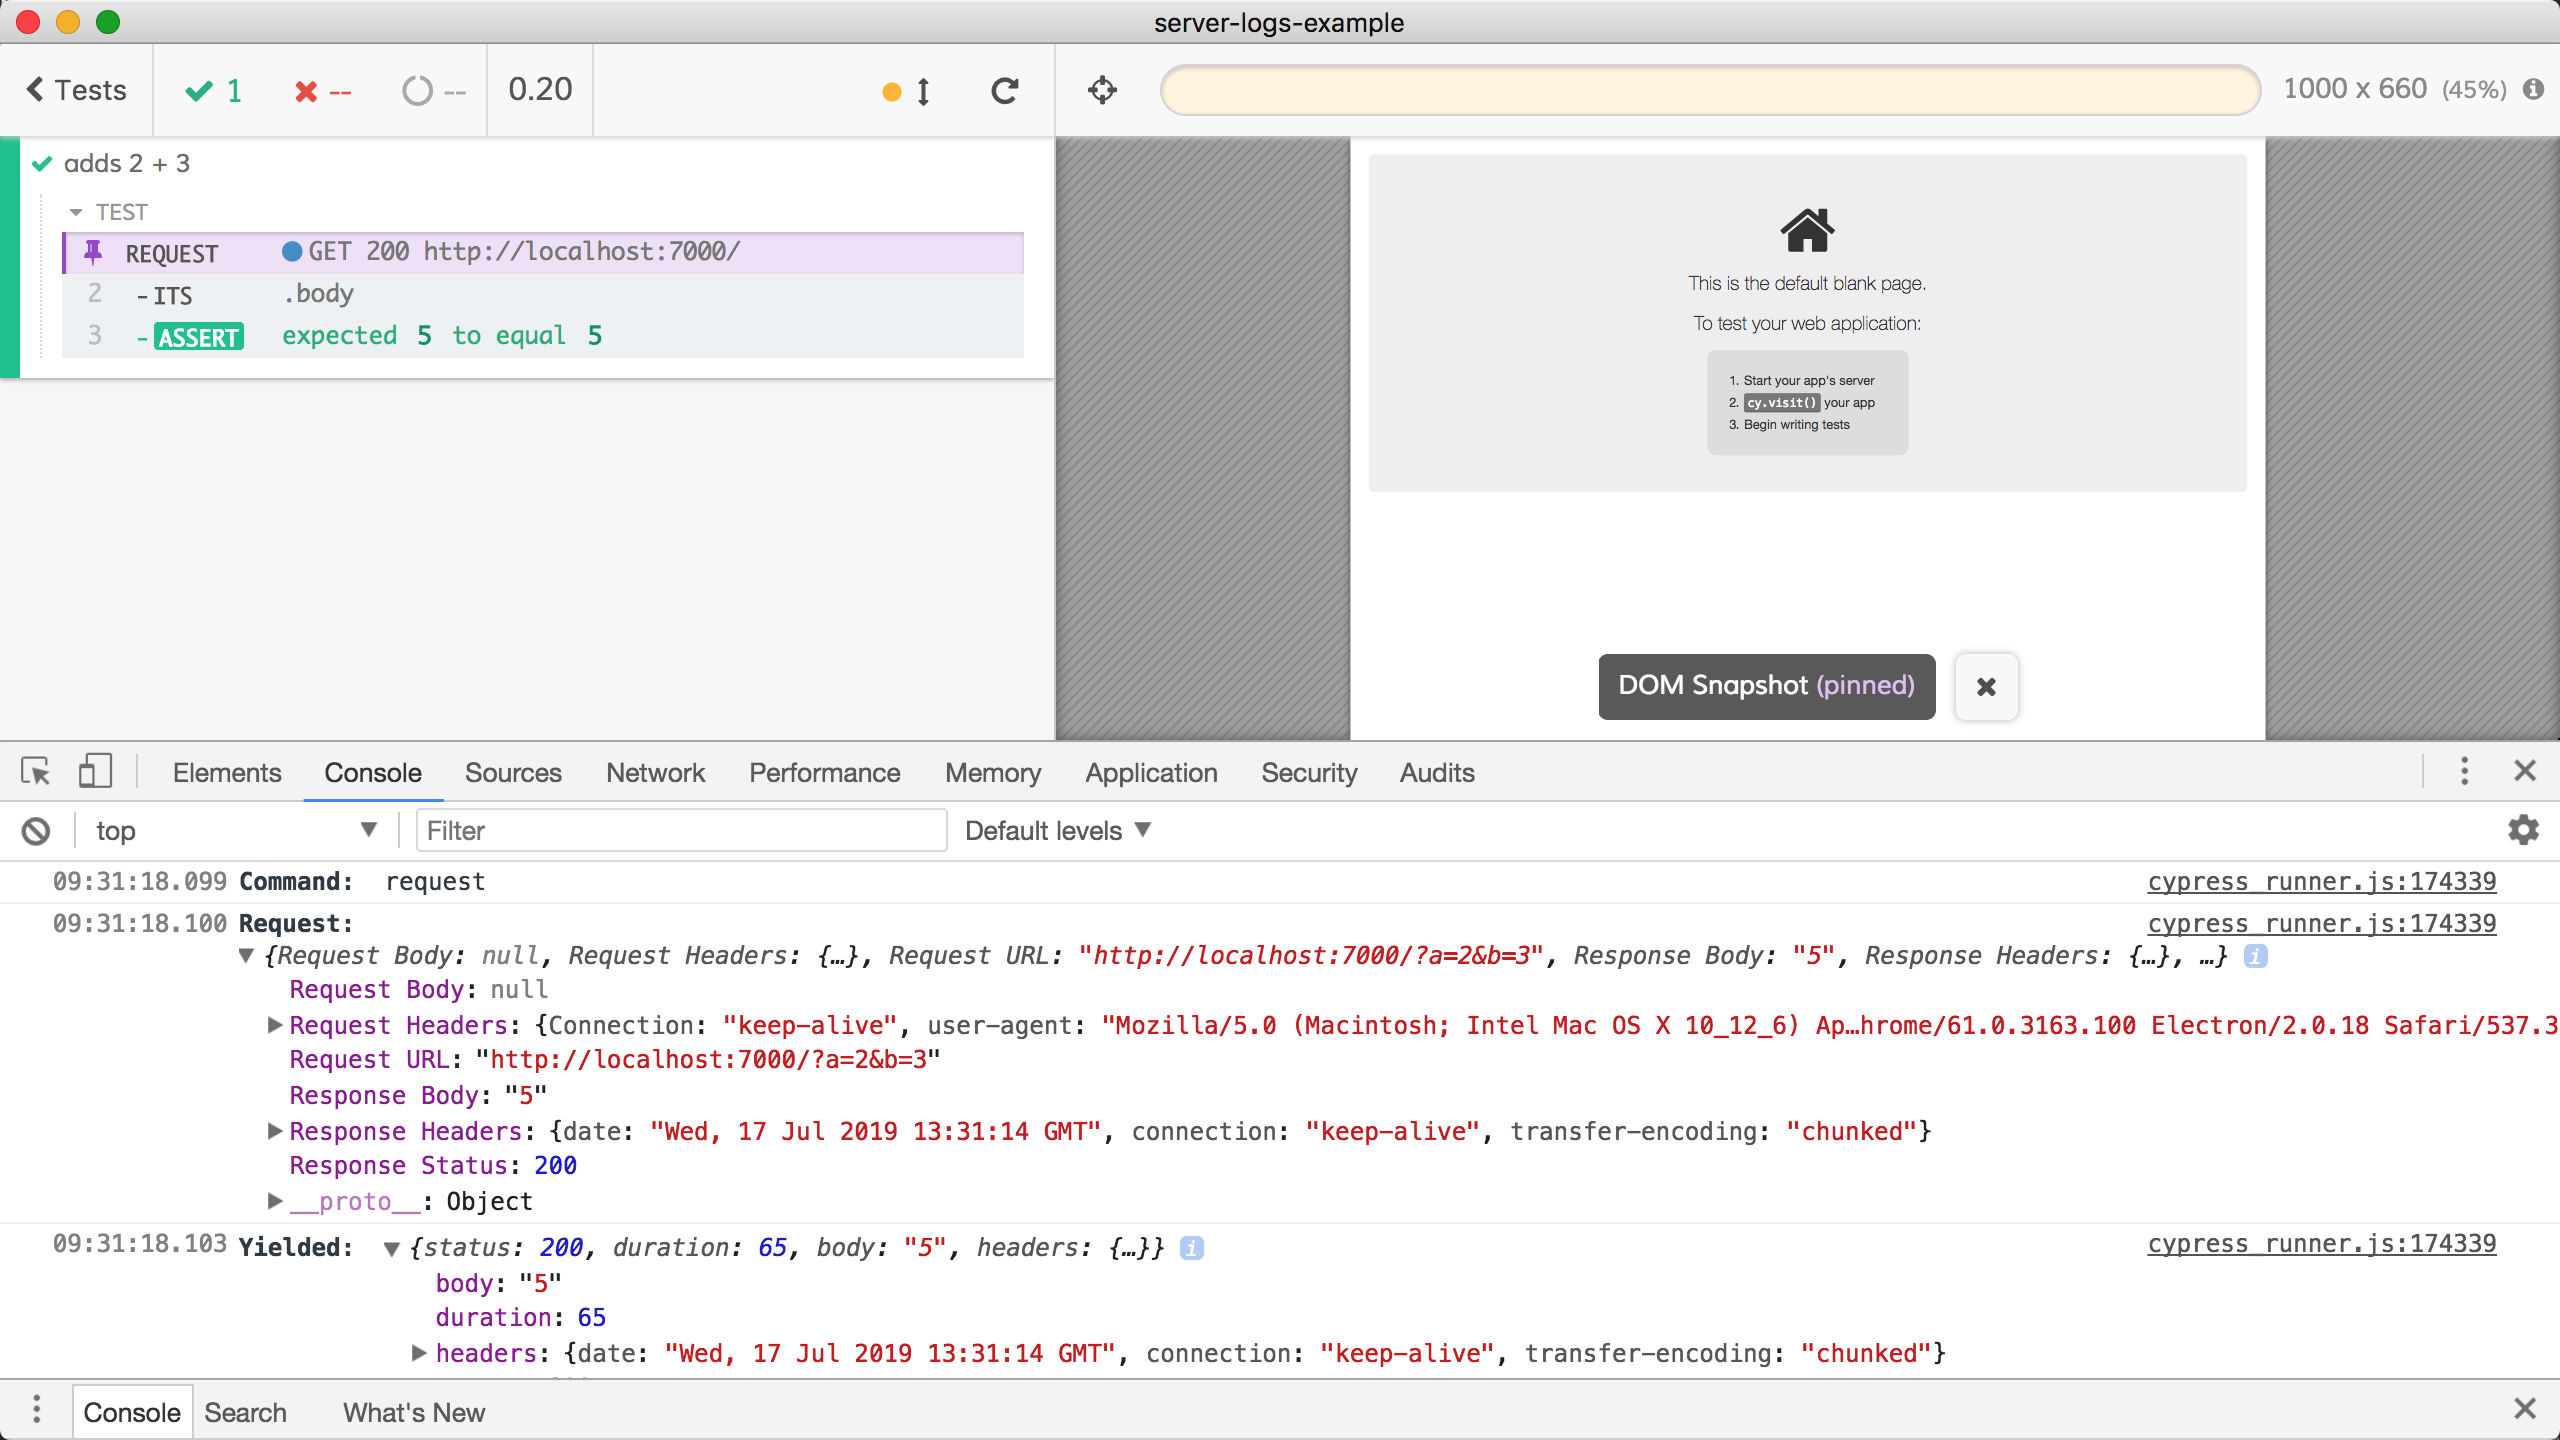
Ok, this is not exactly convenient:
- I need to keep the DevTools open
- I need to click on each command to inspect it
- During the headless
cypress runthe DevTools is not shown in the video, thus I won't be able to understand my tests by watching the video
Meanwhile notice how the application frame stays completely blank - because we are not loading a website using cy.visit during our API test; we are only executing HTTP requests.
cy-api plugin
Let me introduce the cy.api command that comes from @bahmutov/cy-api plugin for Cypress Test Runner. Install it as a dev dependency using your favorite NPM client:
1 | yarn add -D @bahmutov/cy-api |
And load it from cypress/support/index.js file
1 | import '@bahmutov/cy-api/support' |
Now in my Cypress test I can use a new command cy-api that takes exactly the same argument object as cy.request; here is cypress/integration/cy-api-example.js
1 | // loads Cypress types + definition for custom "cy.api" command |
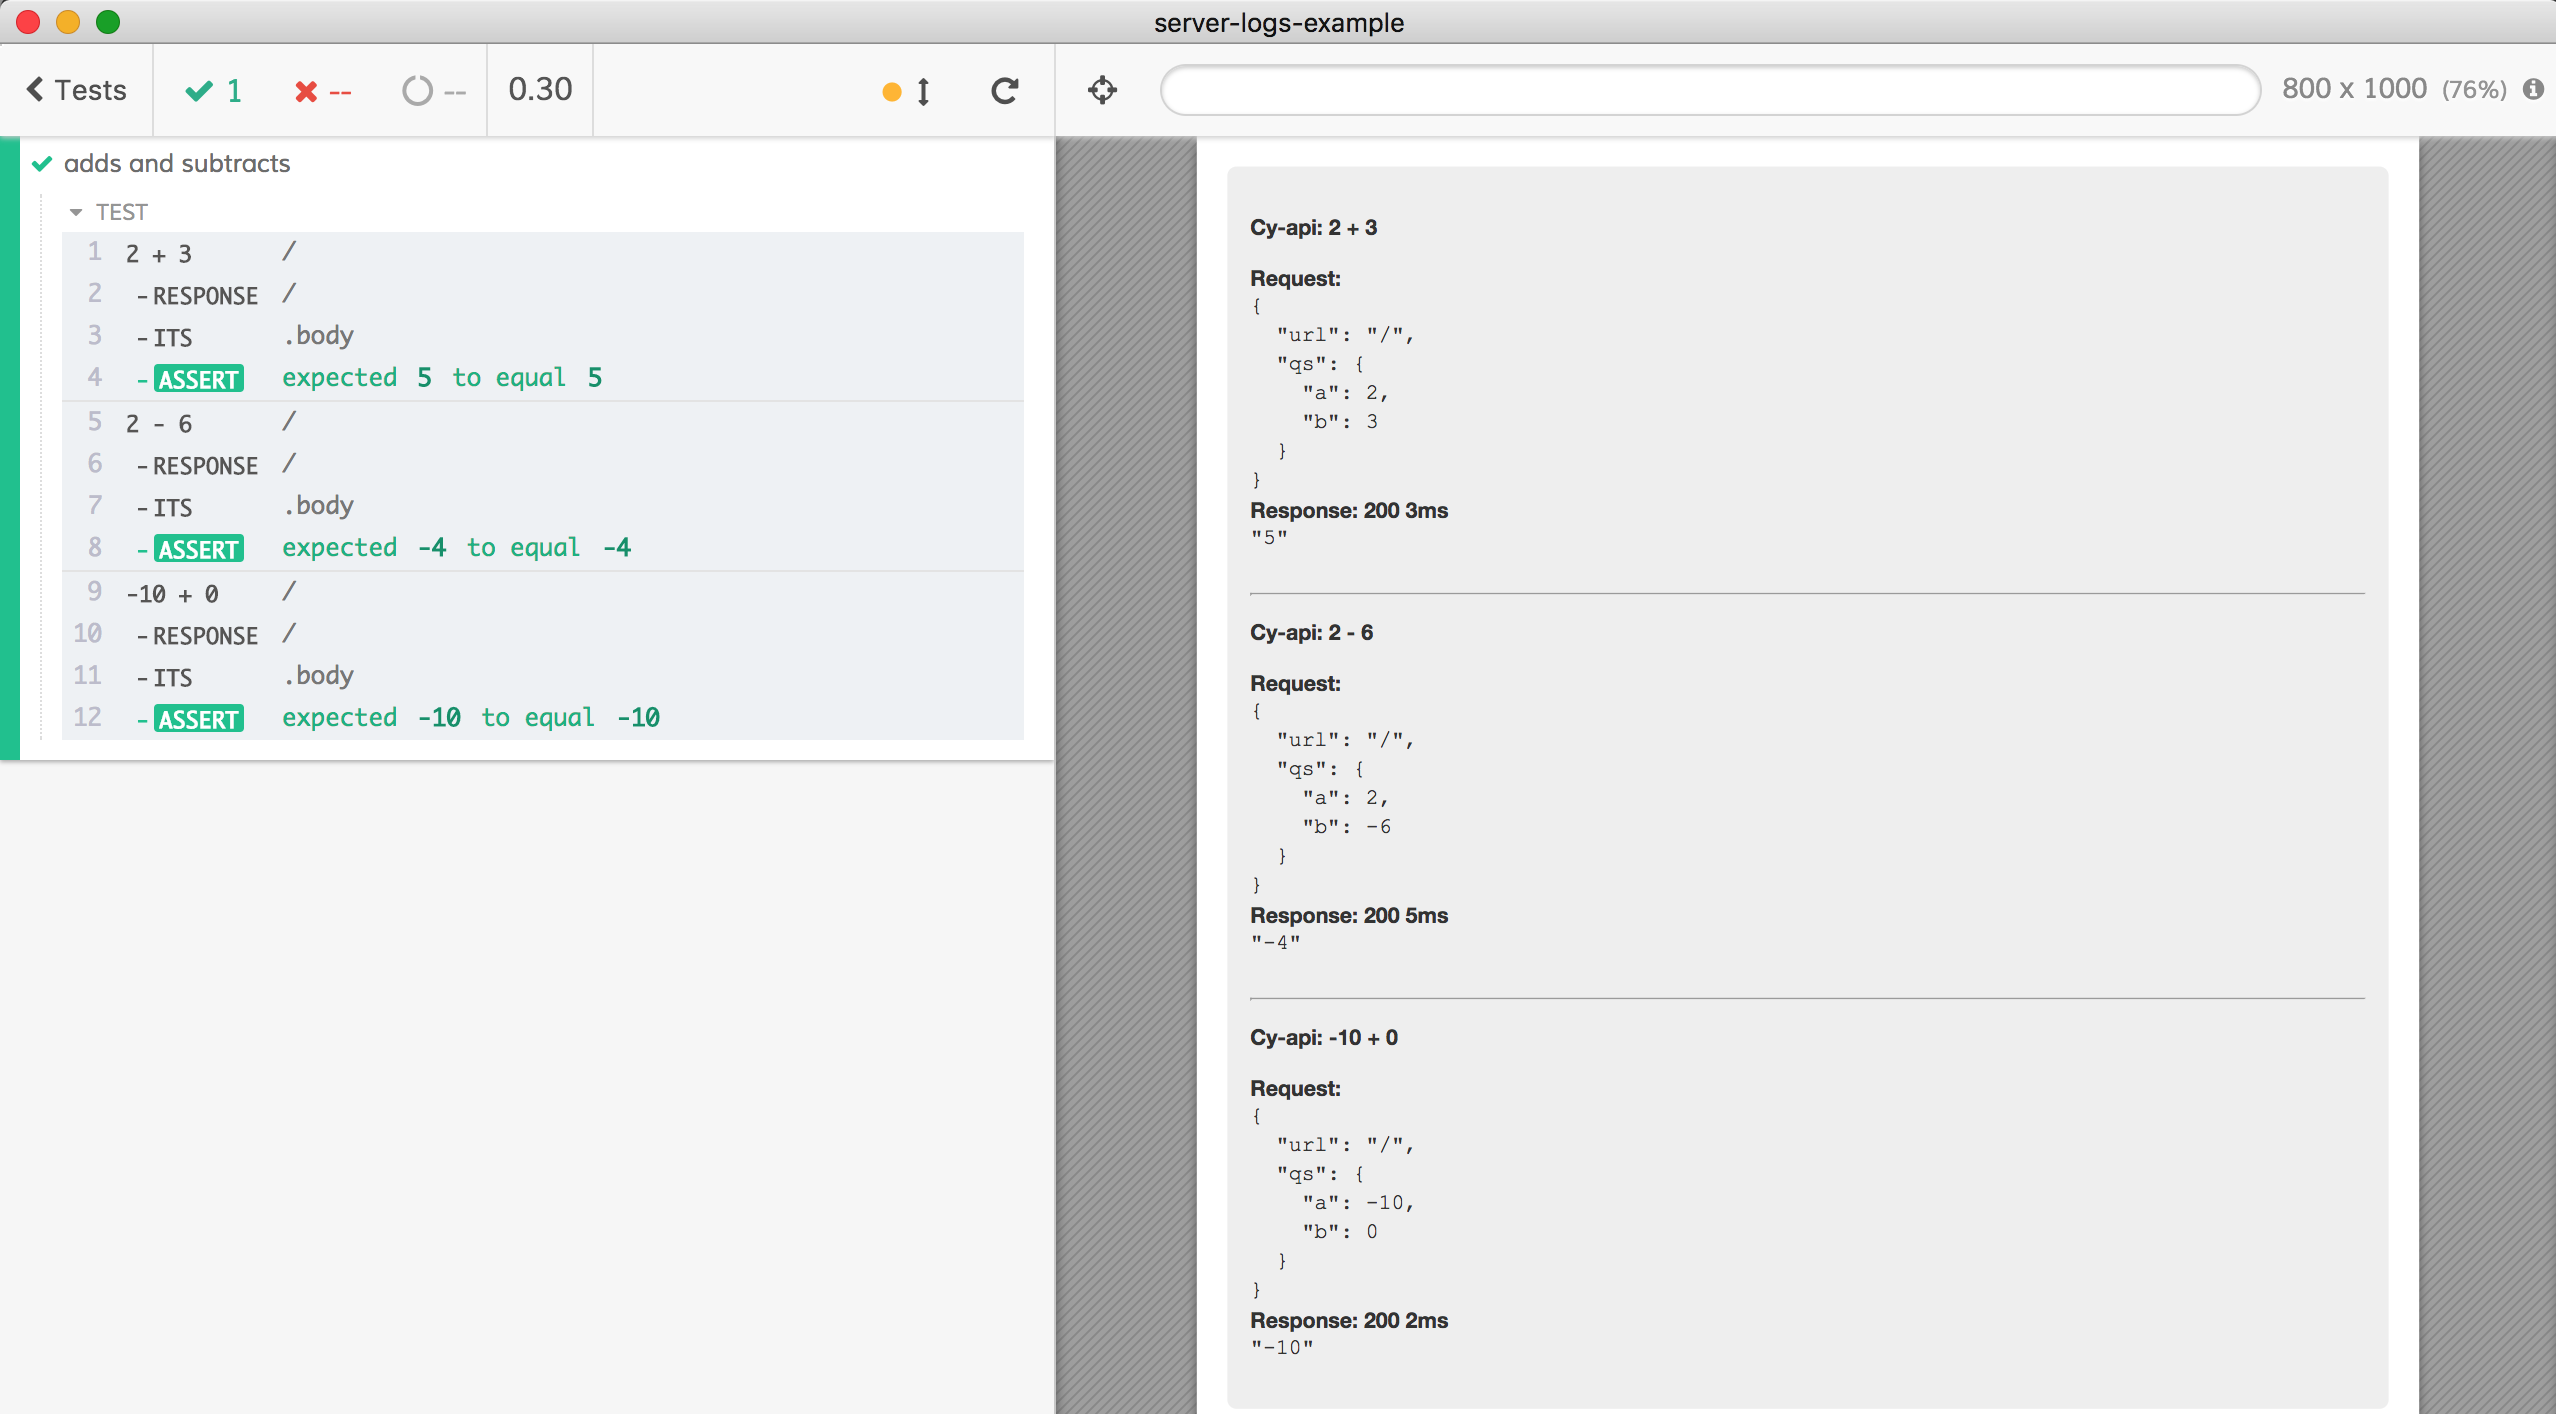
When the cy.api command runs, it automatically renders the request and server response to the empty application frame.

No longer you need to click on the request in the Command Log and have DevTools ready - the relevant information is right there on the screen at all times.
Multiple tests
You can also use multiple cy.api commands in the same test, giving each one a name. All requests and responses will be displayed in the frame, and the frame will automatically scroll to show the last command.
1 | it('adds and subtracts', function () { |
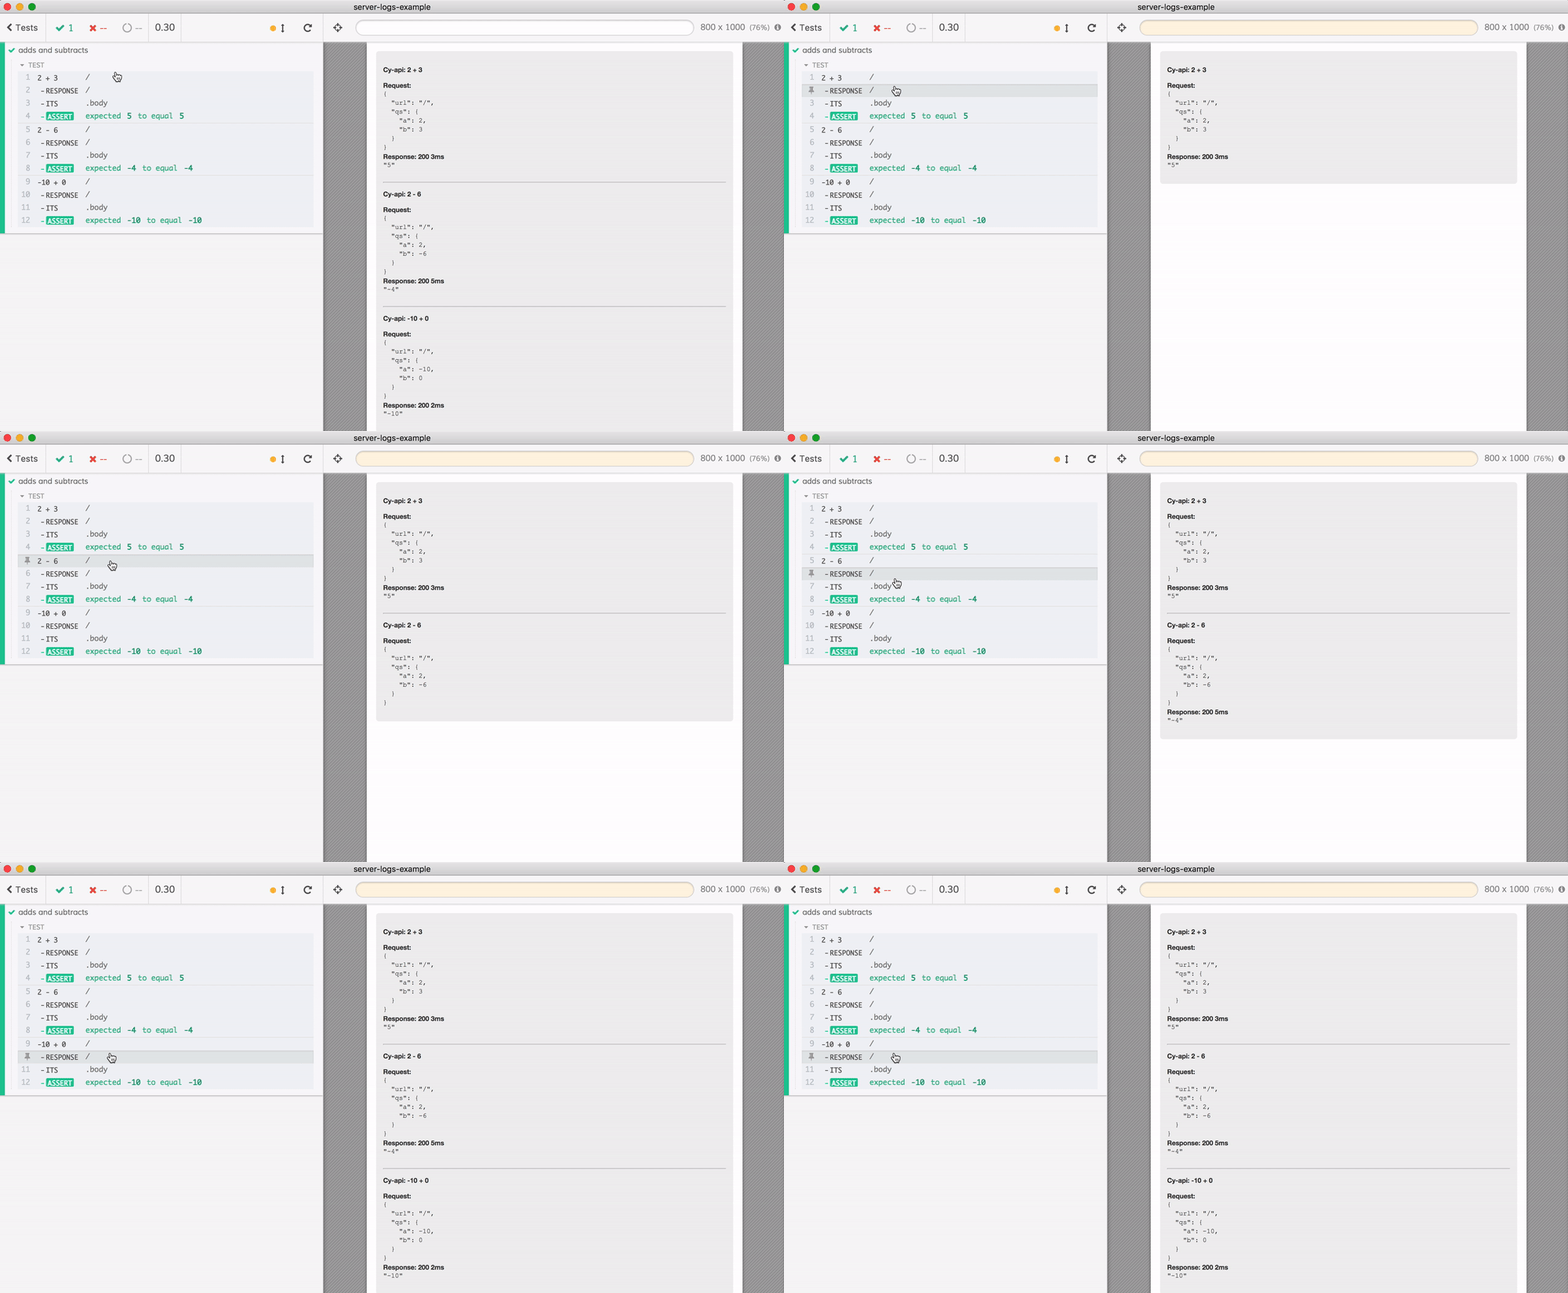
Because the writing to the DOM happens in stages, hover over Command Log shows each part as it is added to the frame; time traveling debugger for your API requests!
Multiple API calls in the same test
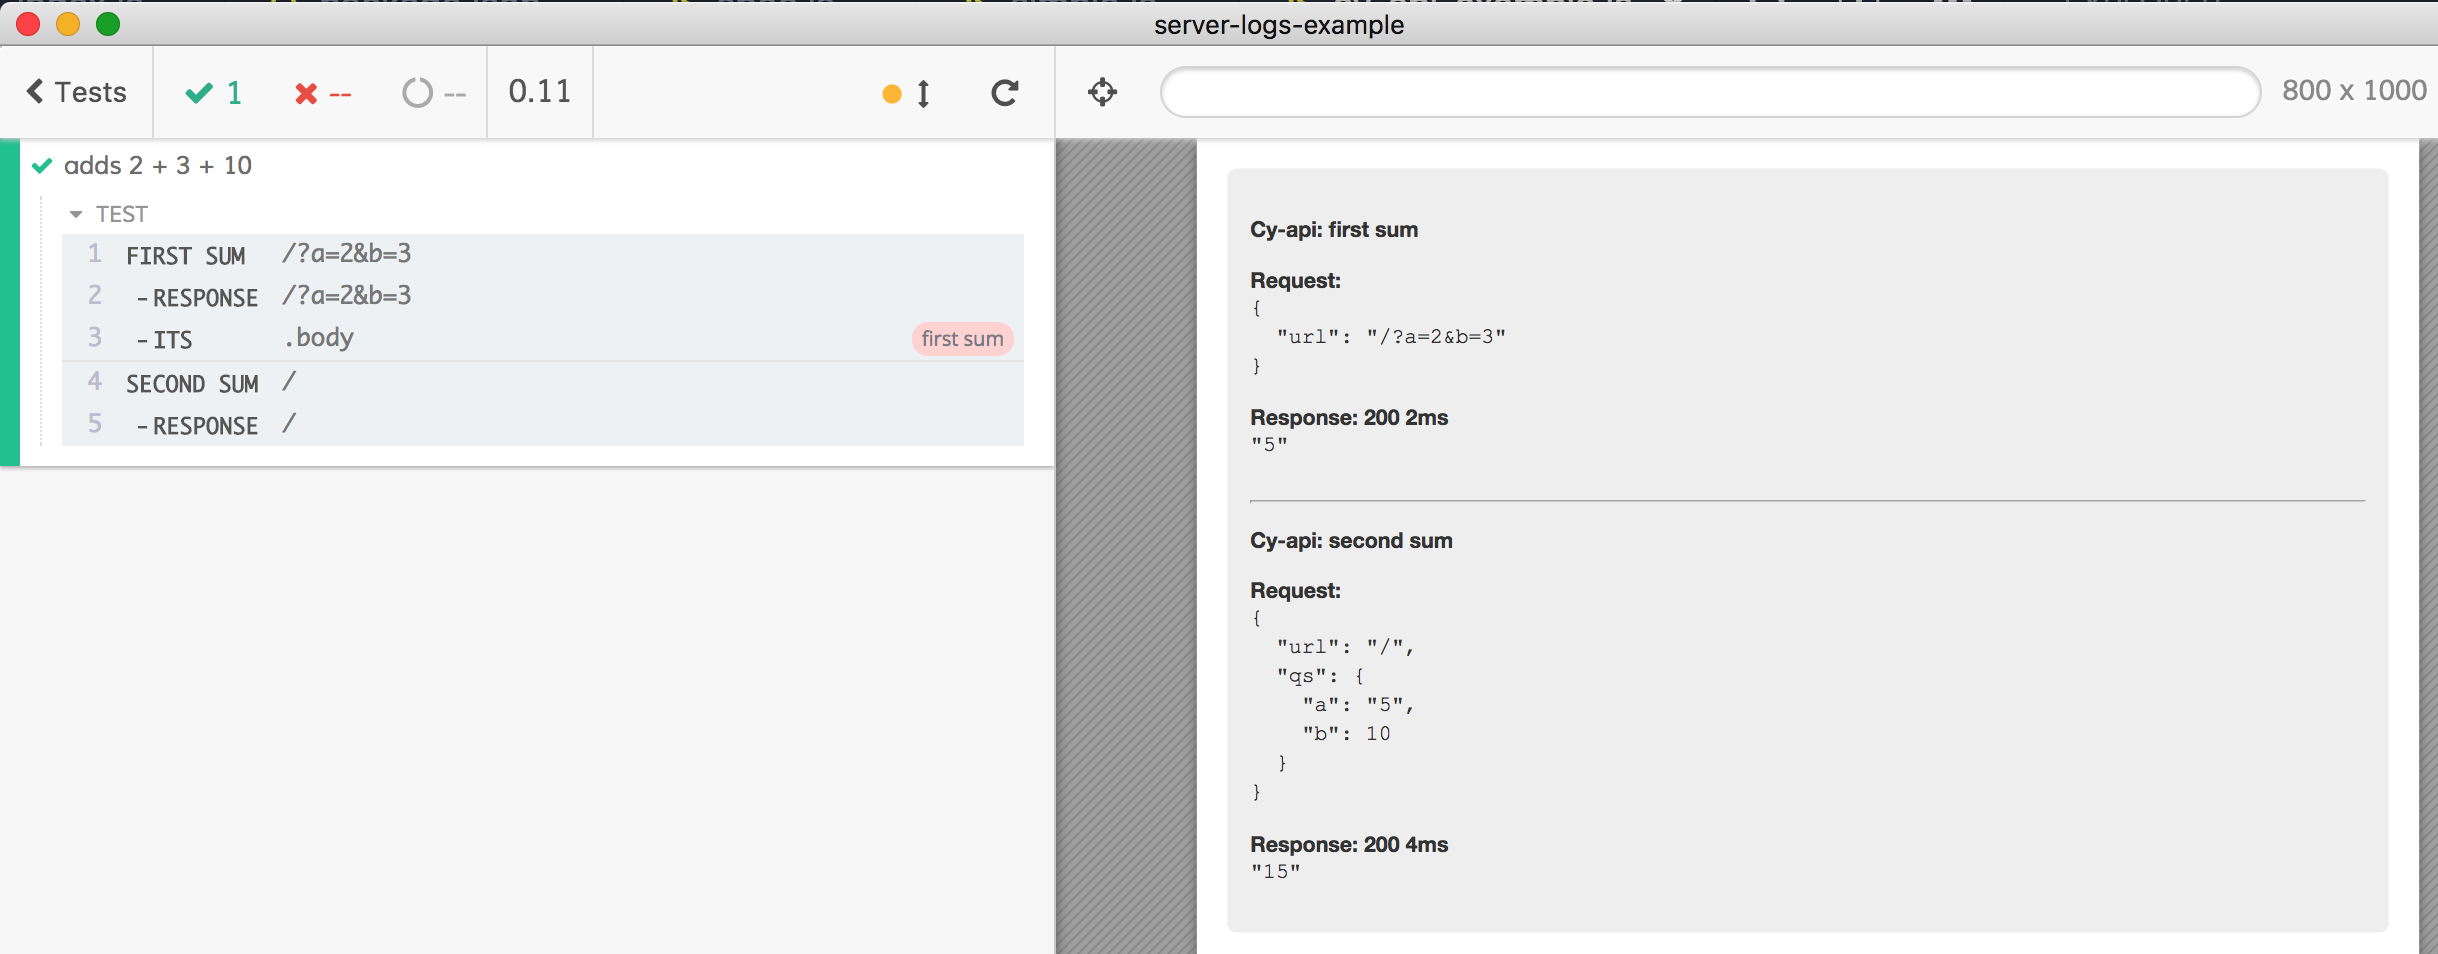
From the test we can use results of the previous API call - either using .then closures (pyramid of doom, anyone?) or by storing results in the shared test context.
1 | it('adds 2 + 3 + 10', () => { |
Logs
Great, this makes the tests useful - yet there is nothing yet to simplify the debugging experience when a test fails. Let's look at that. If a test suddenly fails, it means something went wrong on the server. Our application server server/index.js logs the following messages while processing the requests:
1 | // we will use console.log, util.debuglog and debug modules to log stuff |
By default, we are only logging the basic information; here I will be calling the server with http ':7000/?a=2&b=3'
1 | $ node ./server |
If I want more information, for example to check how the query was parsed, I can enable the built-in util.debuglog logs.
1 | $ NODE_DEBUG=verbose node ./server |
Warning: the exact log messages from the util.debuglog module strongly depend on the Node version.
We can now see our query object (and process id 35756). Or we can see other debug messages by turning on the debug module
1 | $ DEBUG=compute node ./server |
Beautiful - what does this have to do with our API testing and cy-api? Well, using another module @bahmutov/all-logs you can silently capture ALL logs from your server (even without turning them on) and then cy.api command will grab them during each request. Here is how to turn it on in your server.
- Instead of starting the server with
node ./server, start it withnode -r @bahmutov/all-logs ./server. This sets up the log interception. - Add HTTP middleware to your server that
cy.apican call to retrieve and reset collected messages. For example, our server is a plainhttpserver and we can do the following:
1 | const logs = require('@bahmutov/all-logs/middleware/http') |
That is it. Let's look at our previous test with the @bahmutov/all-logs included. Wow, our Test Runner suddenly shows a lot more information!
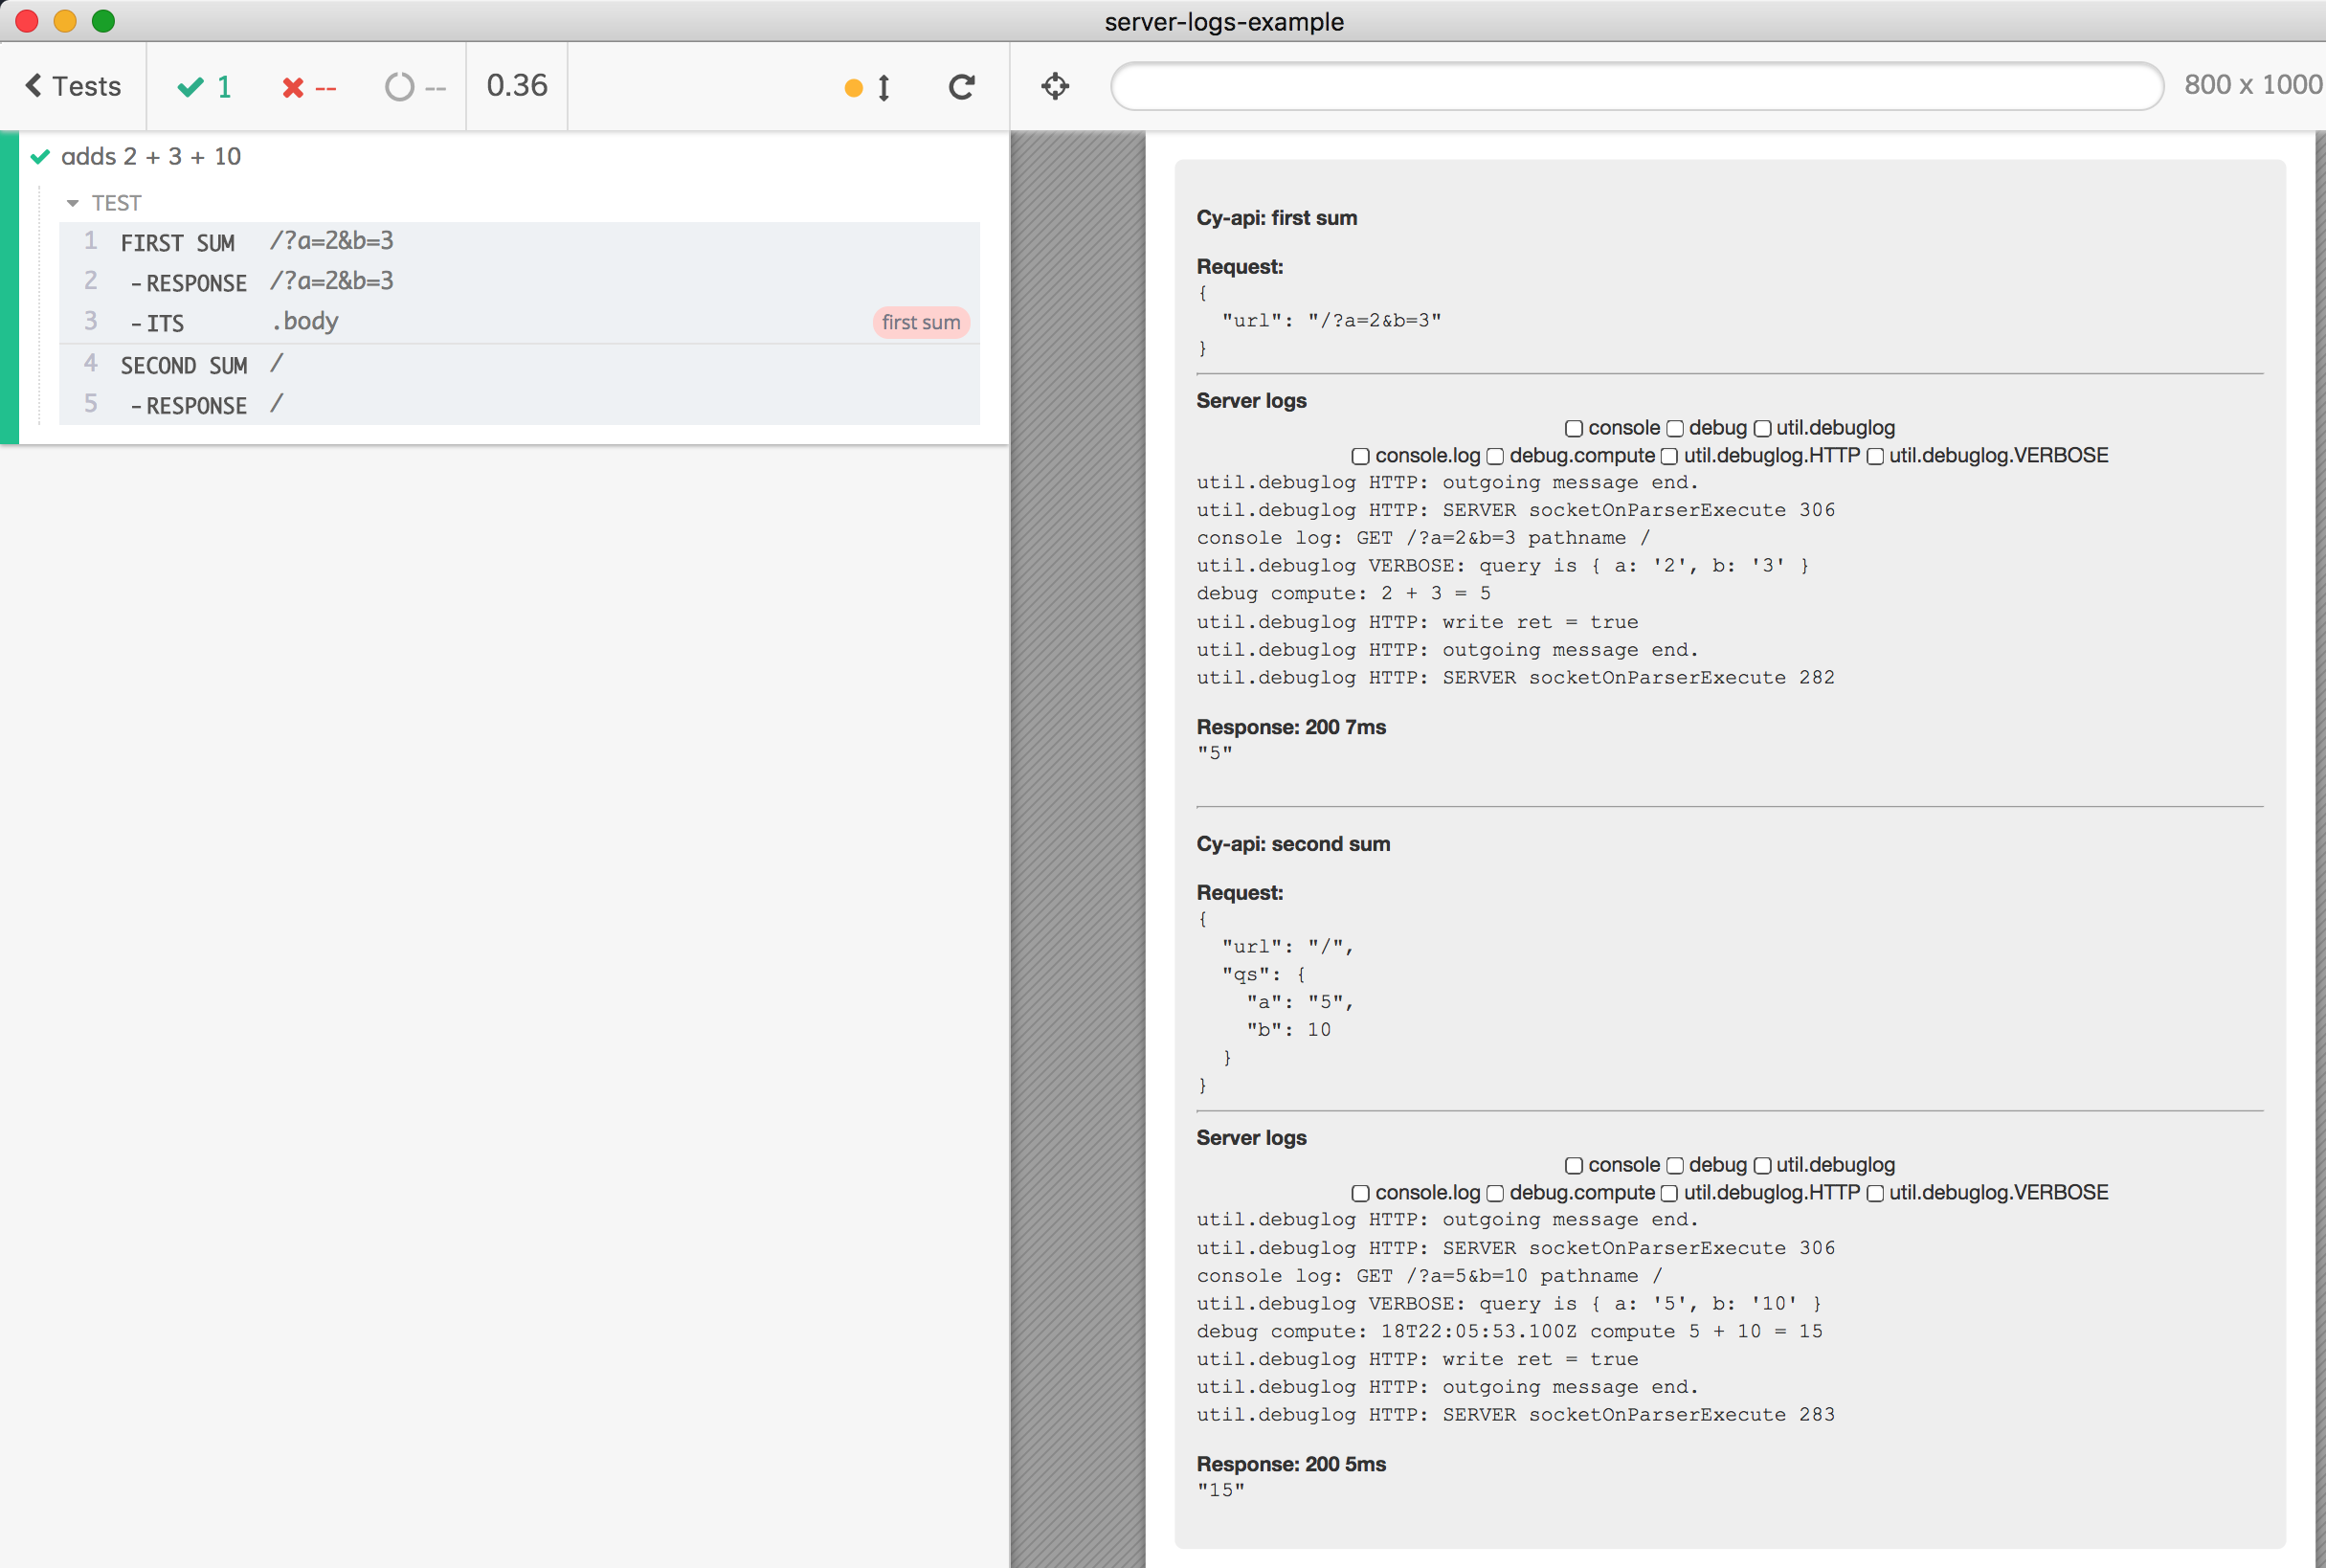
The cy.api command fetches the intercepted logs from the server and shows them between the Request and Response sections. There are a lot of low level messages from Node itself, and in the future we plan to allow easy filtering by the log type (console, util, debug) and the namespace (in this case the namespaces were HTTP, log and compute). That is what those (currently non-functioning) checkboxes are for.
Using logs in test
The cy.api command yields the same object as cy.request does, plus the messages list with all server-side logs. Here is the same test as above, but with printing the body and messages properties from the yielded object:
1 | // there was first cy.api |
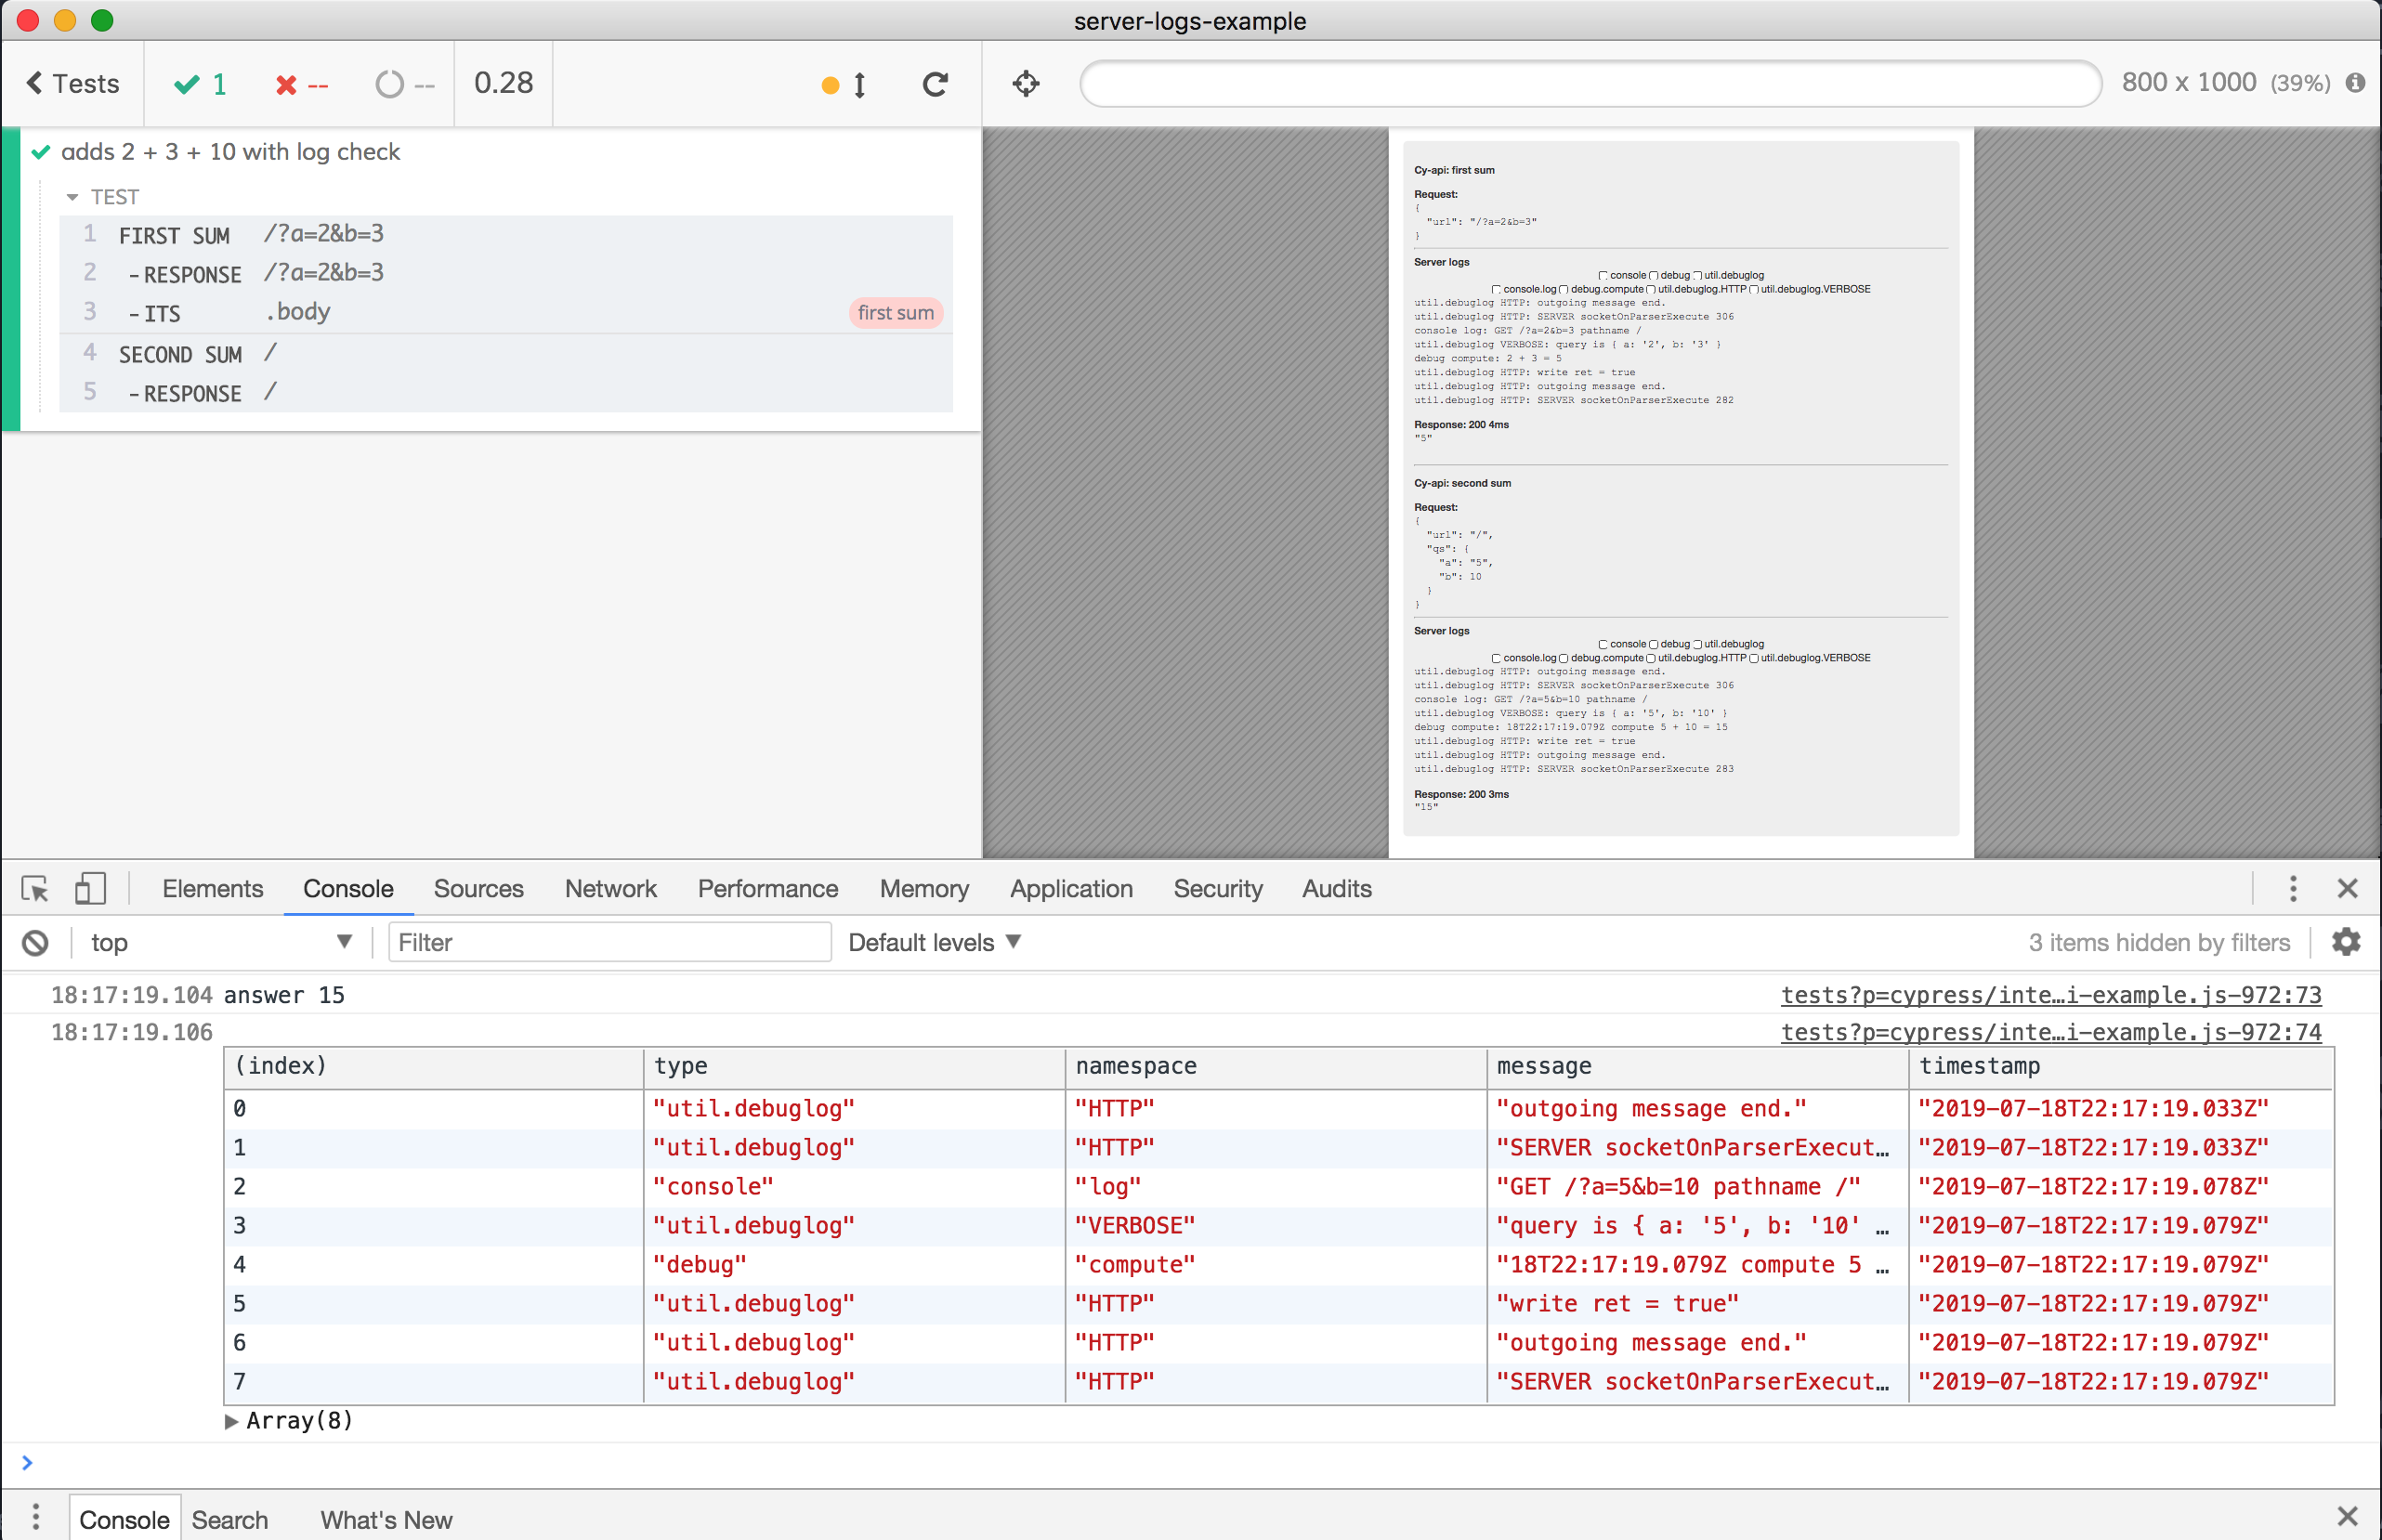
We can assert the result is what we are expecting, and that debug compute message records the correct parsed numbers. The .then() callback is below. I love writing BDD assertions that are readable!
1 | .then(({ body, messages }) => { |
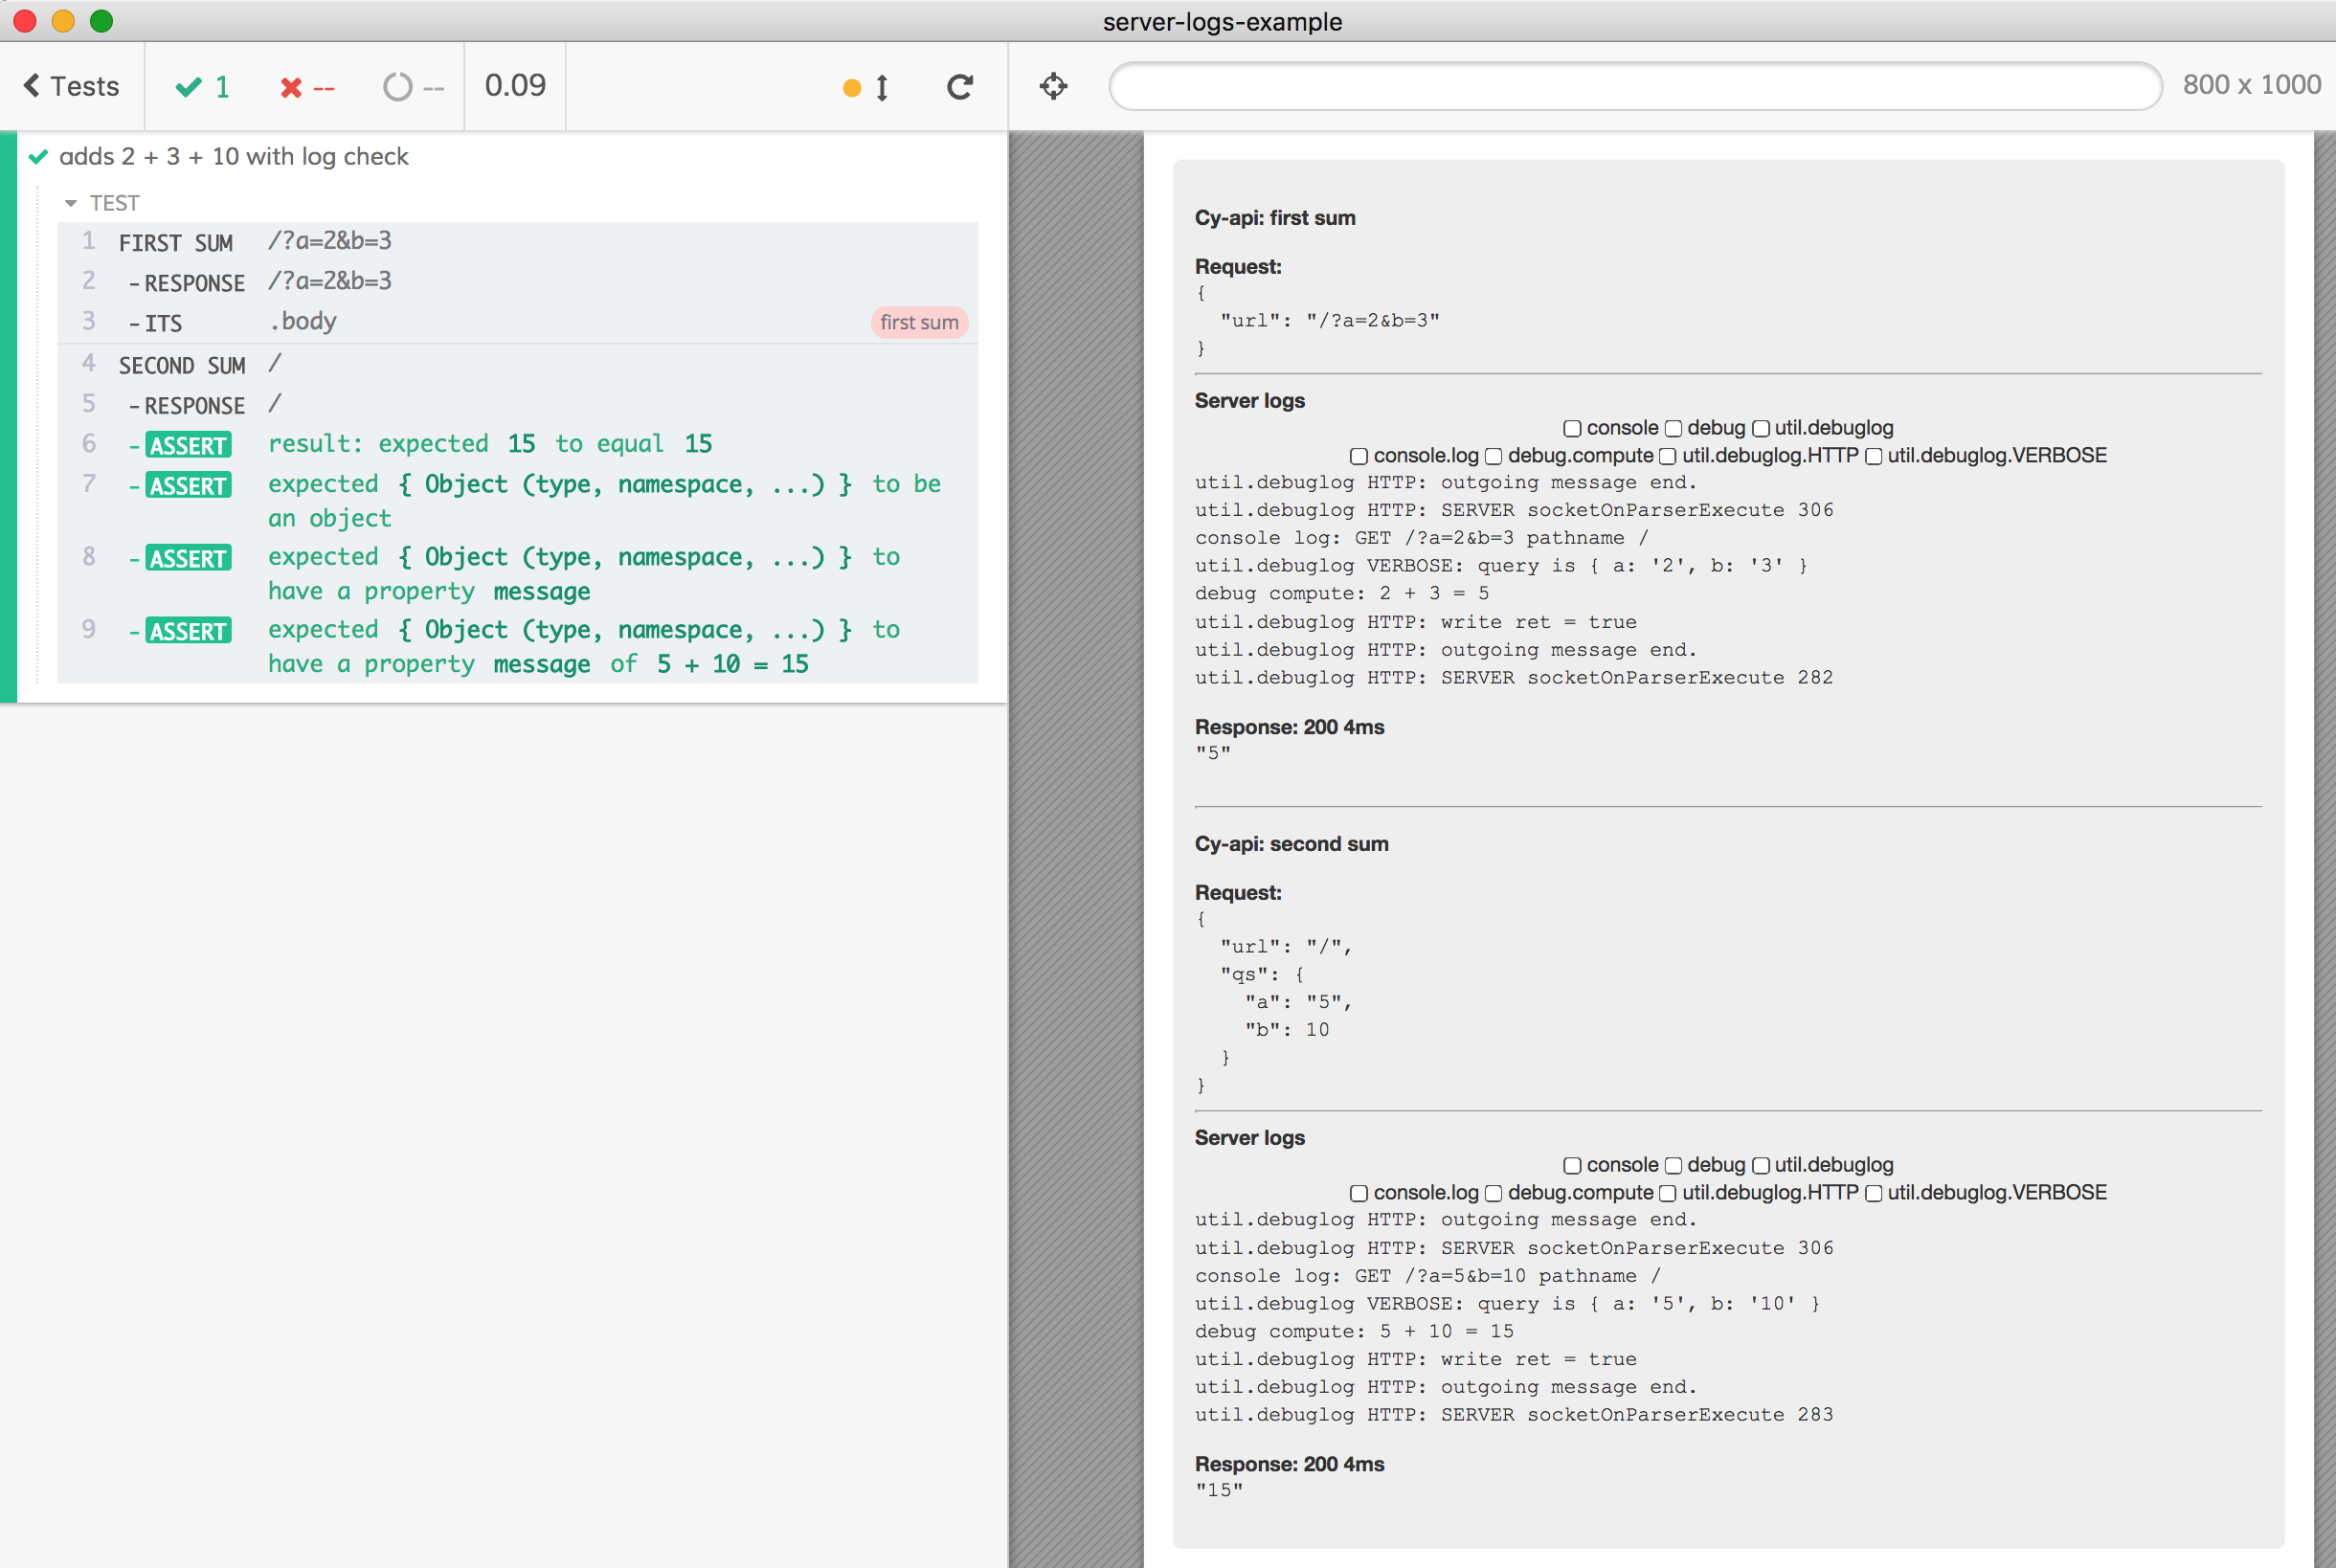
You might ask yourself - isn't this testing the implementation details? It is up to you to write tests that reach deeper into the server logic in order to test it from the from front-end. If you decide this approach ties the E2E tests too tightly to the implementation - don't check the logs from the tests, just have them in case the response value 15 is different from the expected one. But I would advise to set a policy on server-side logs that allows using the messages in tests. For example, you might have a debug namespace just for E2E tests that one CAN test against.
1 | const debugE2E = require('debug')('compute') |
If you decide to allow some messages to be used from tests, we can easily verify the major "checkpoints" along the way using snapshots. For example, I will add the meinaart/cypress-plugin-snapshots plugin by following the instructions in that repo's README file. Now we can write a test and do snapshots with just API response and filtered backend messages. The full source code is in cypress/integration/with-snapshots.js and below:
1 | const pickImportantMessages = ({ body, messages }) => { |
The snapshots are saved on the first run, and I can inspect the saved values by clicking on the "Snapshot" command.
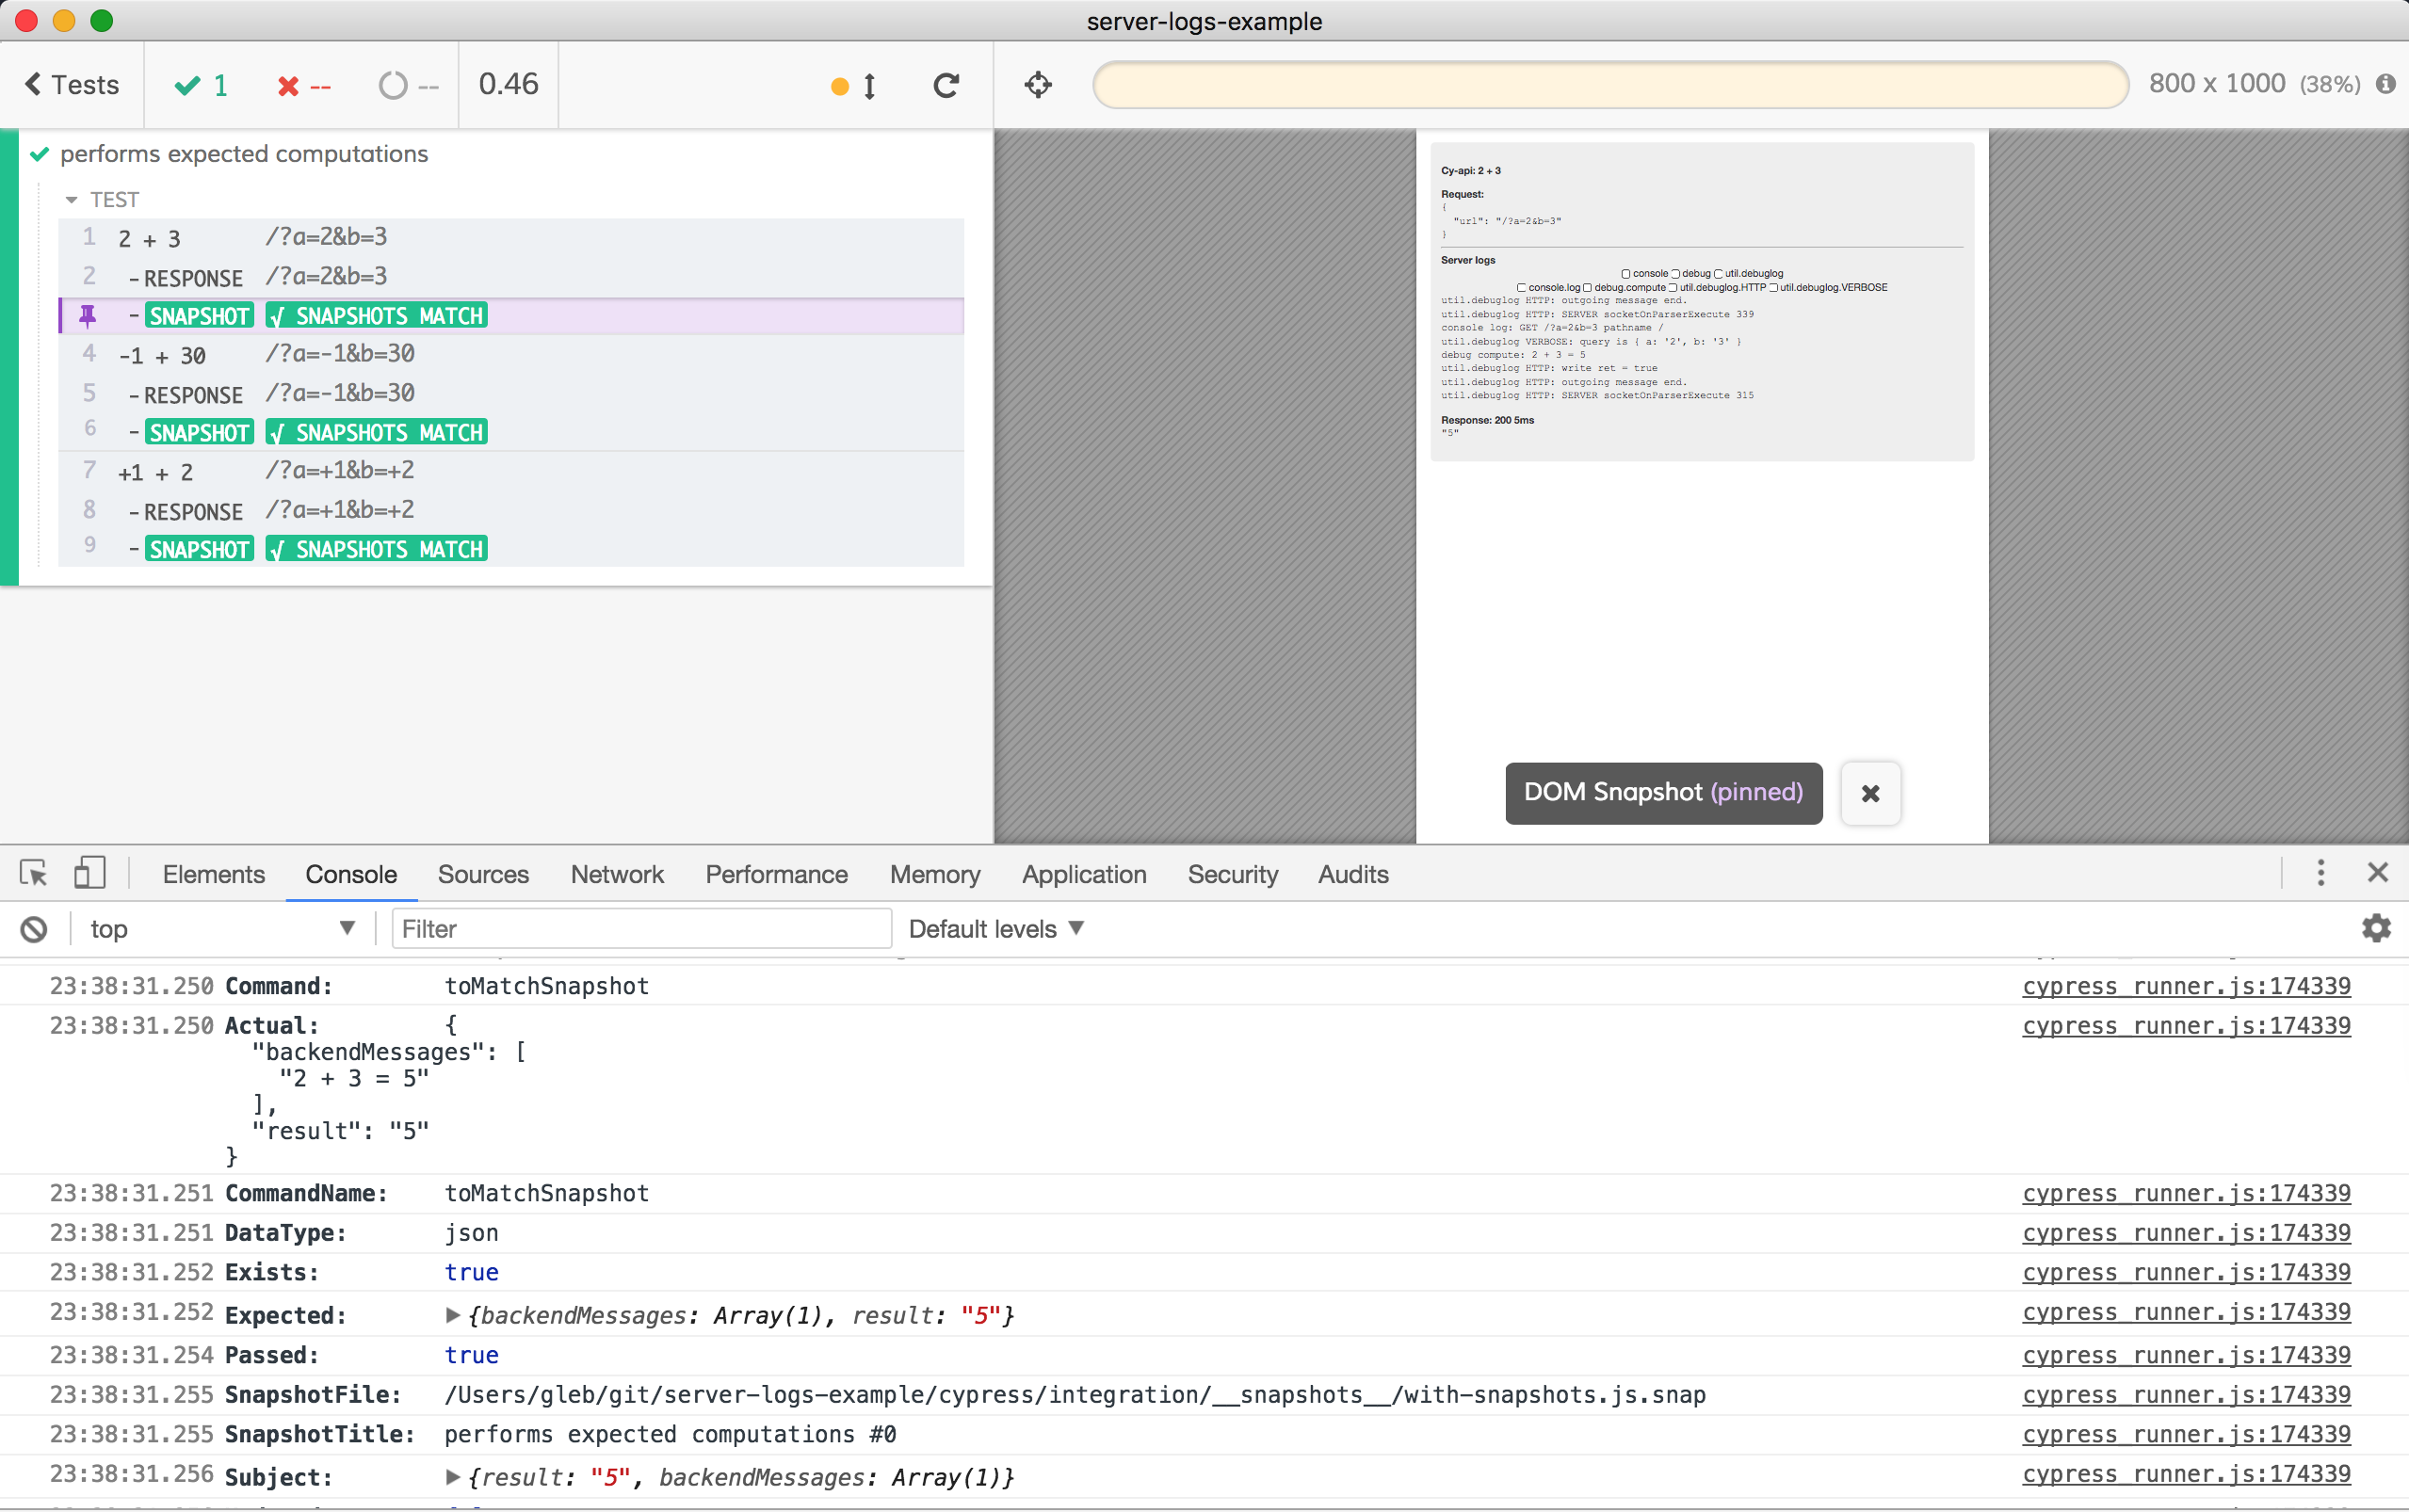
Imagine something has changed. For example, I have changed the input parameters for the second cy.api call. Instead of -1 + 30 the test passes 30 - 1 now. Let's see how the snapshot shows the difference.
1 | cy.api( |
Immediately the snapshot value is different from the value saved in the file cypress/integration/snapshots/with-snapshots.js.snap. The test fails.
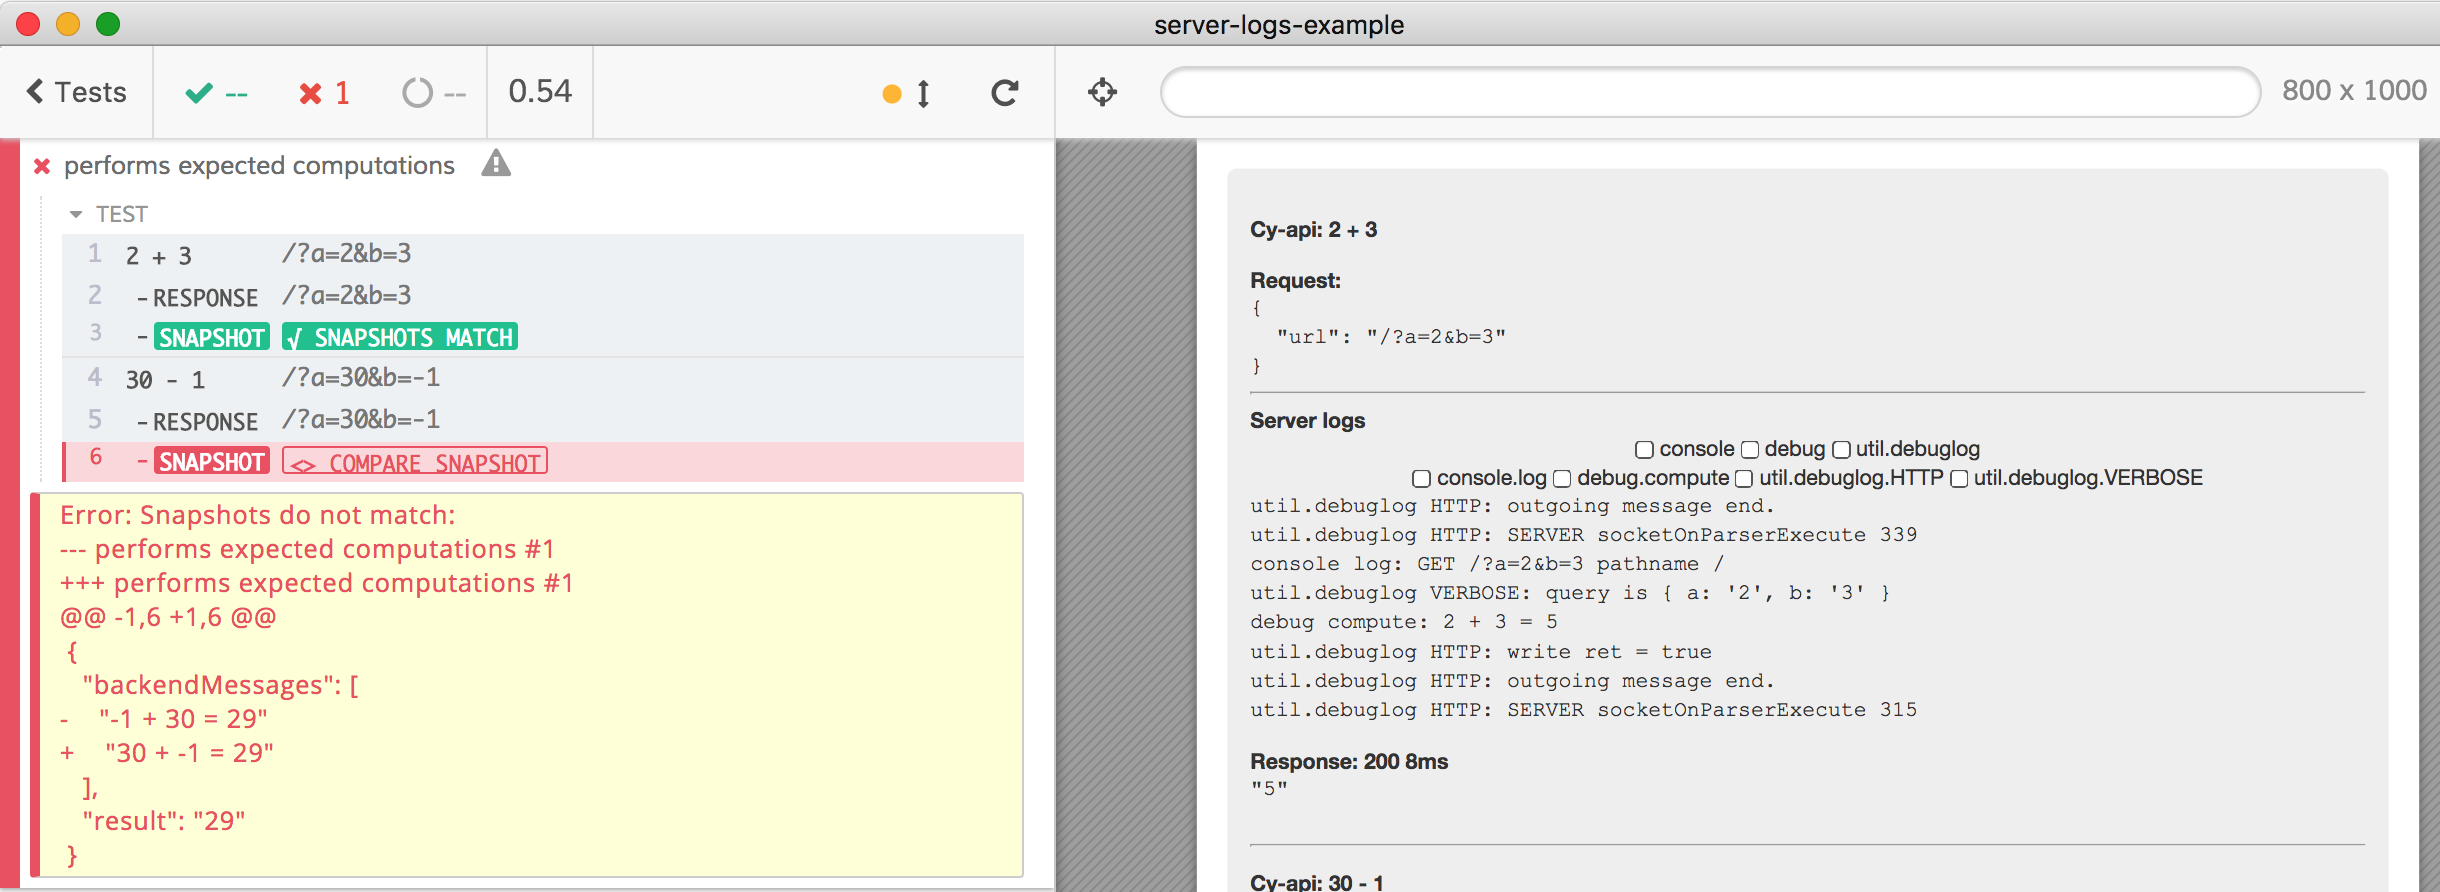
Clicking on the "Compare snapshot" button brings up the difference viewer.
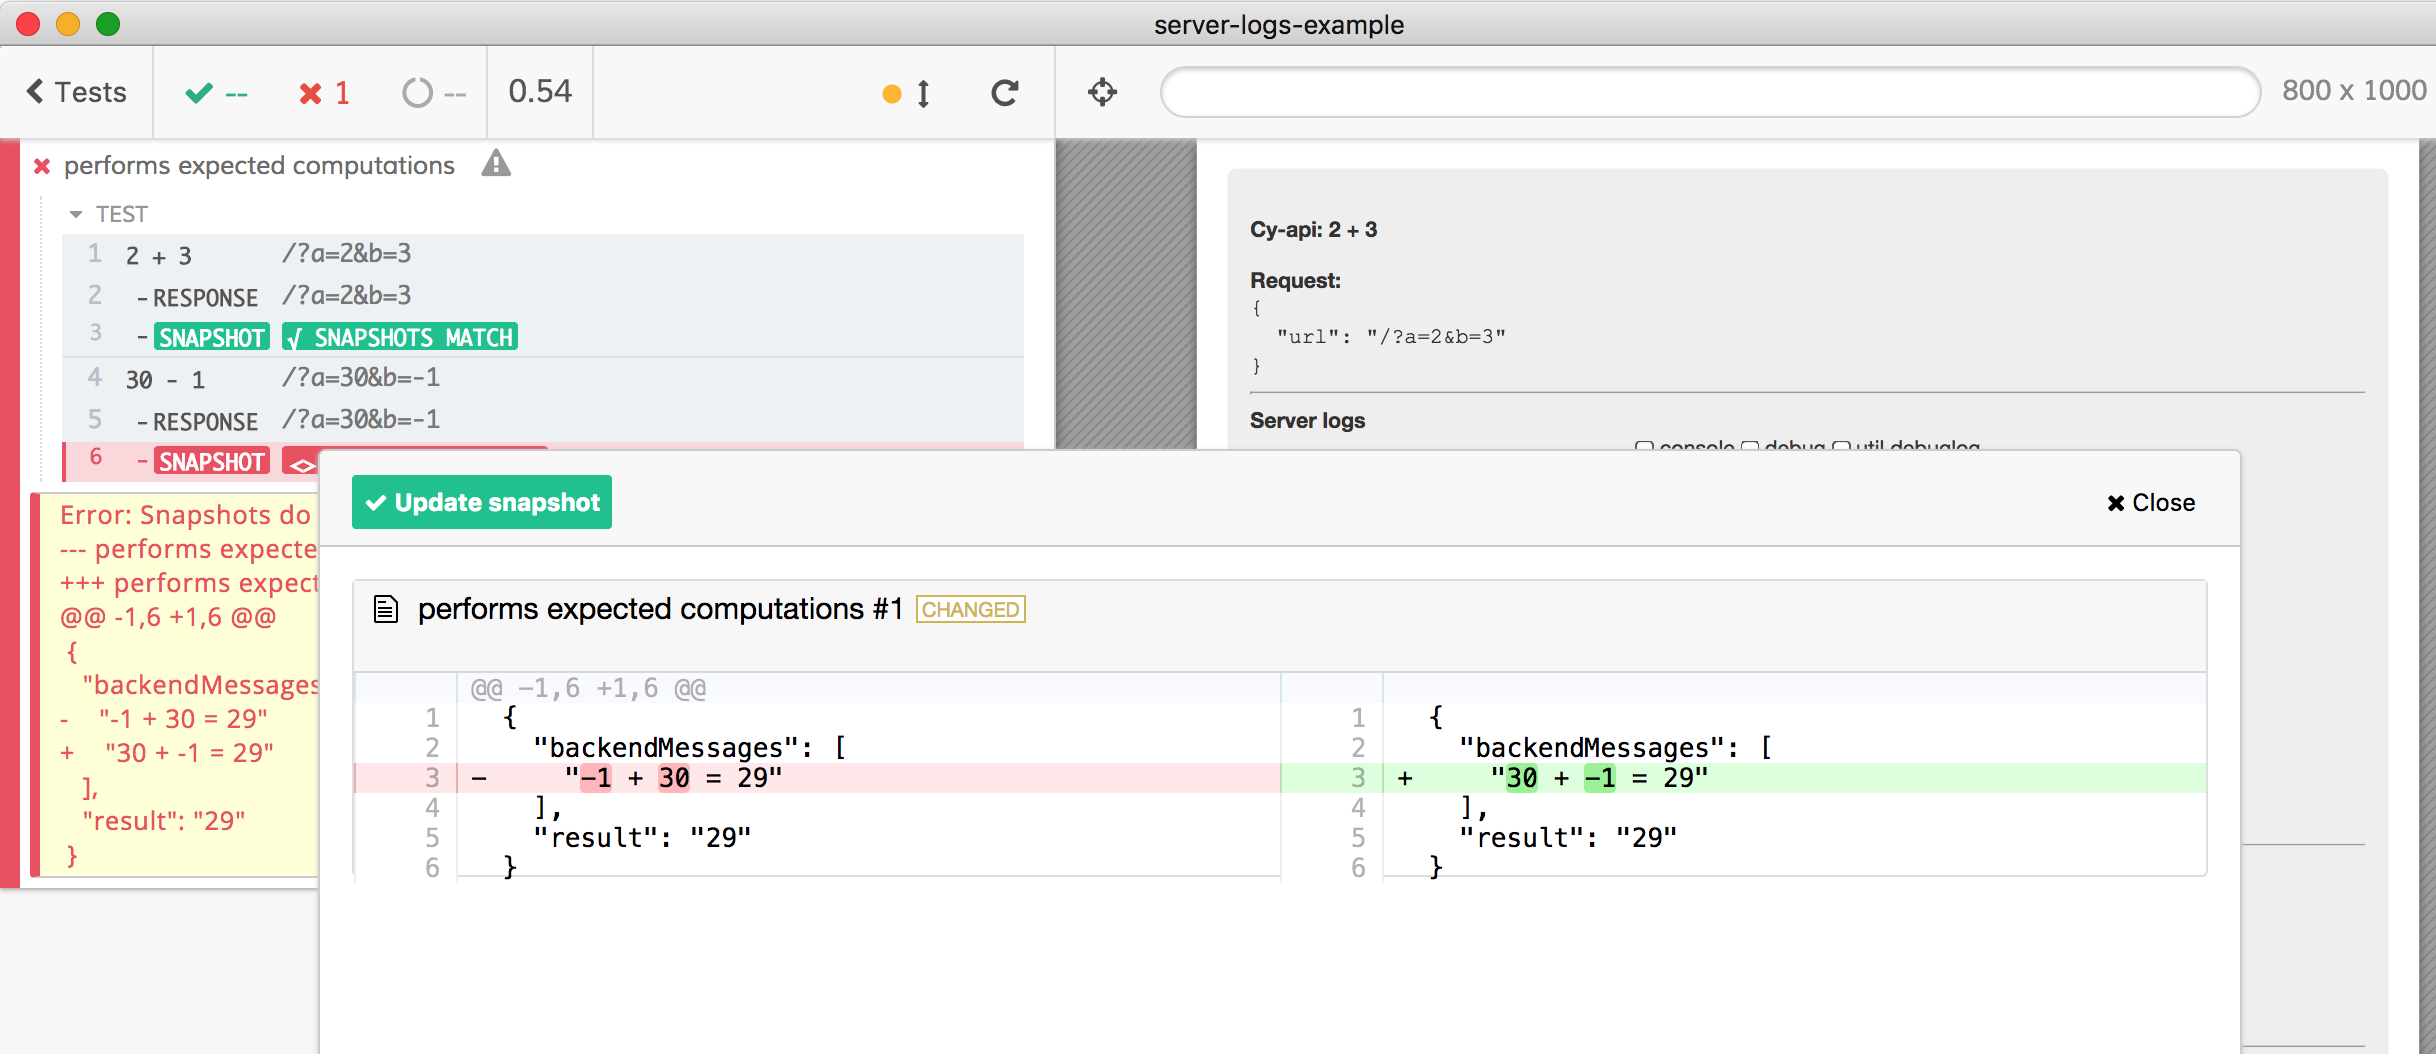
The beautiful thing - if the new value is expected, you can simply click "Update snapshot" button and the new "snap" will be saved.
Concat messages
The above test can be rewritten in shorter form, because all calls are independent of each other; we still need to execute them one by one to guarantee the same order.
1 | it('computes all given examples', () => { |
Notice how we compare the entire list at once at the very end.
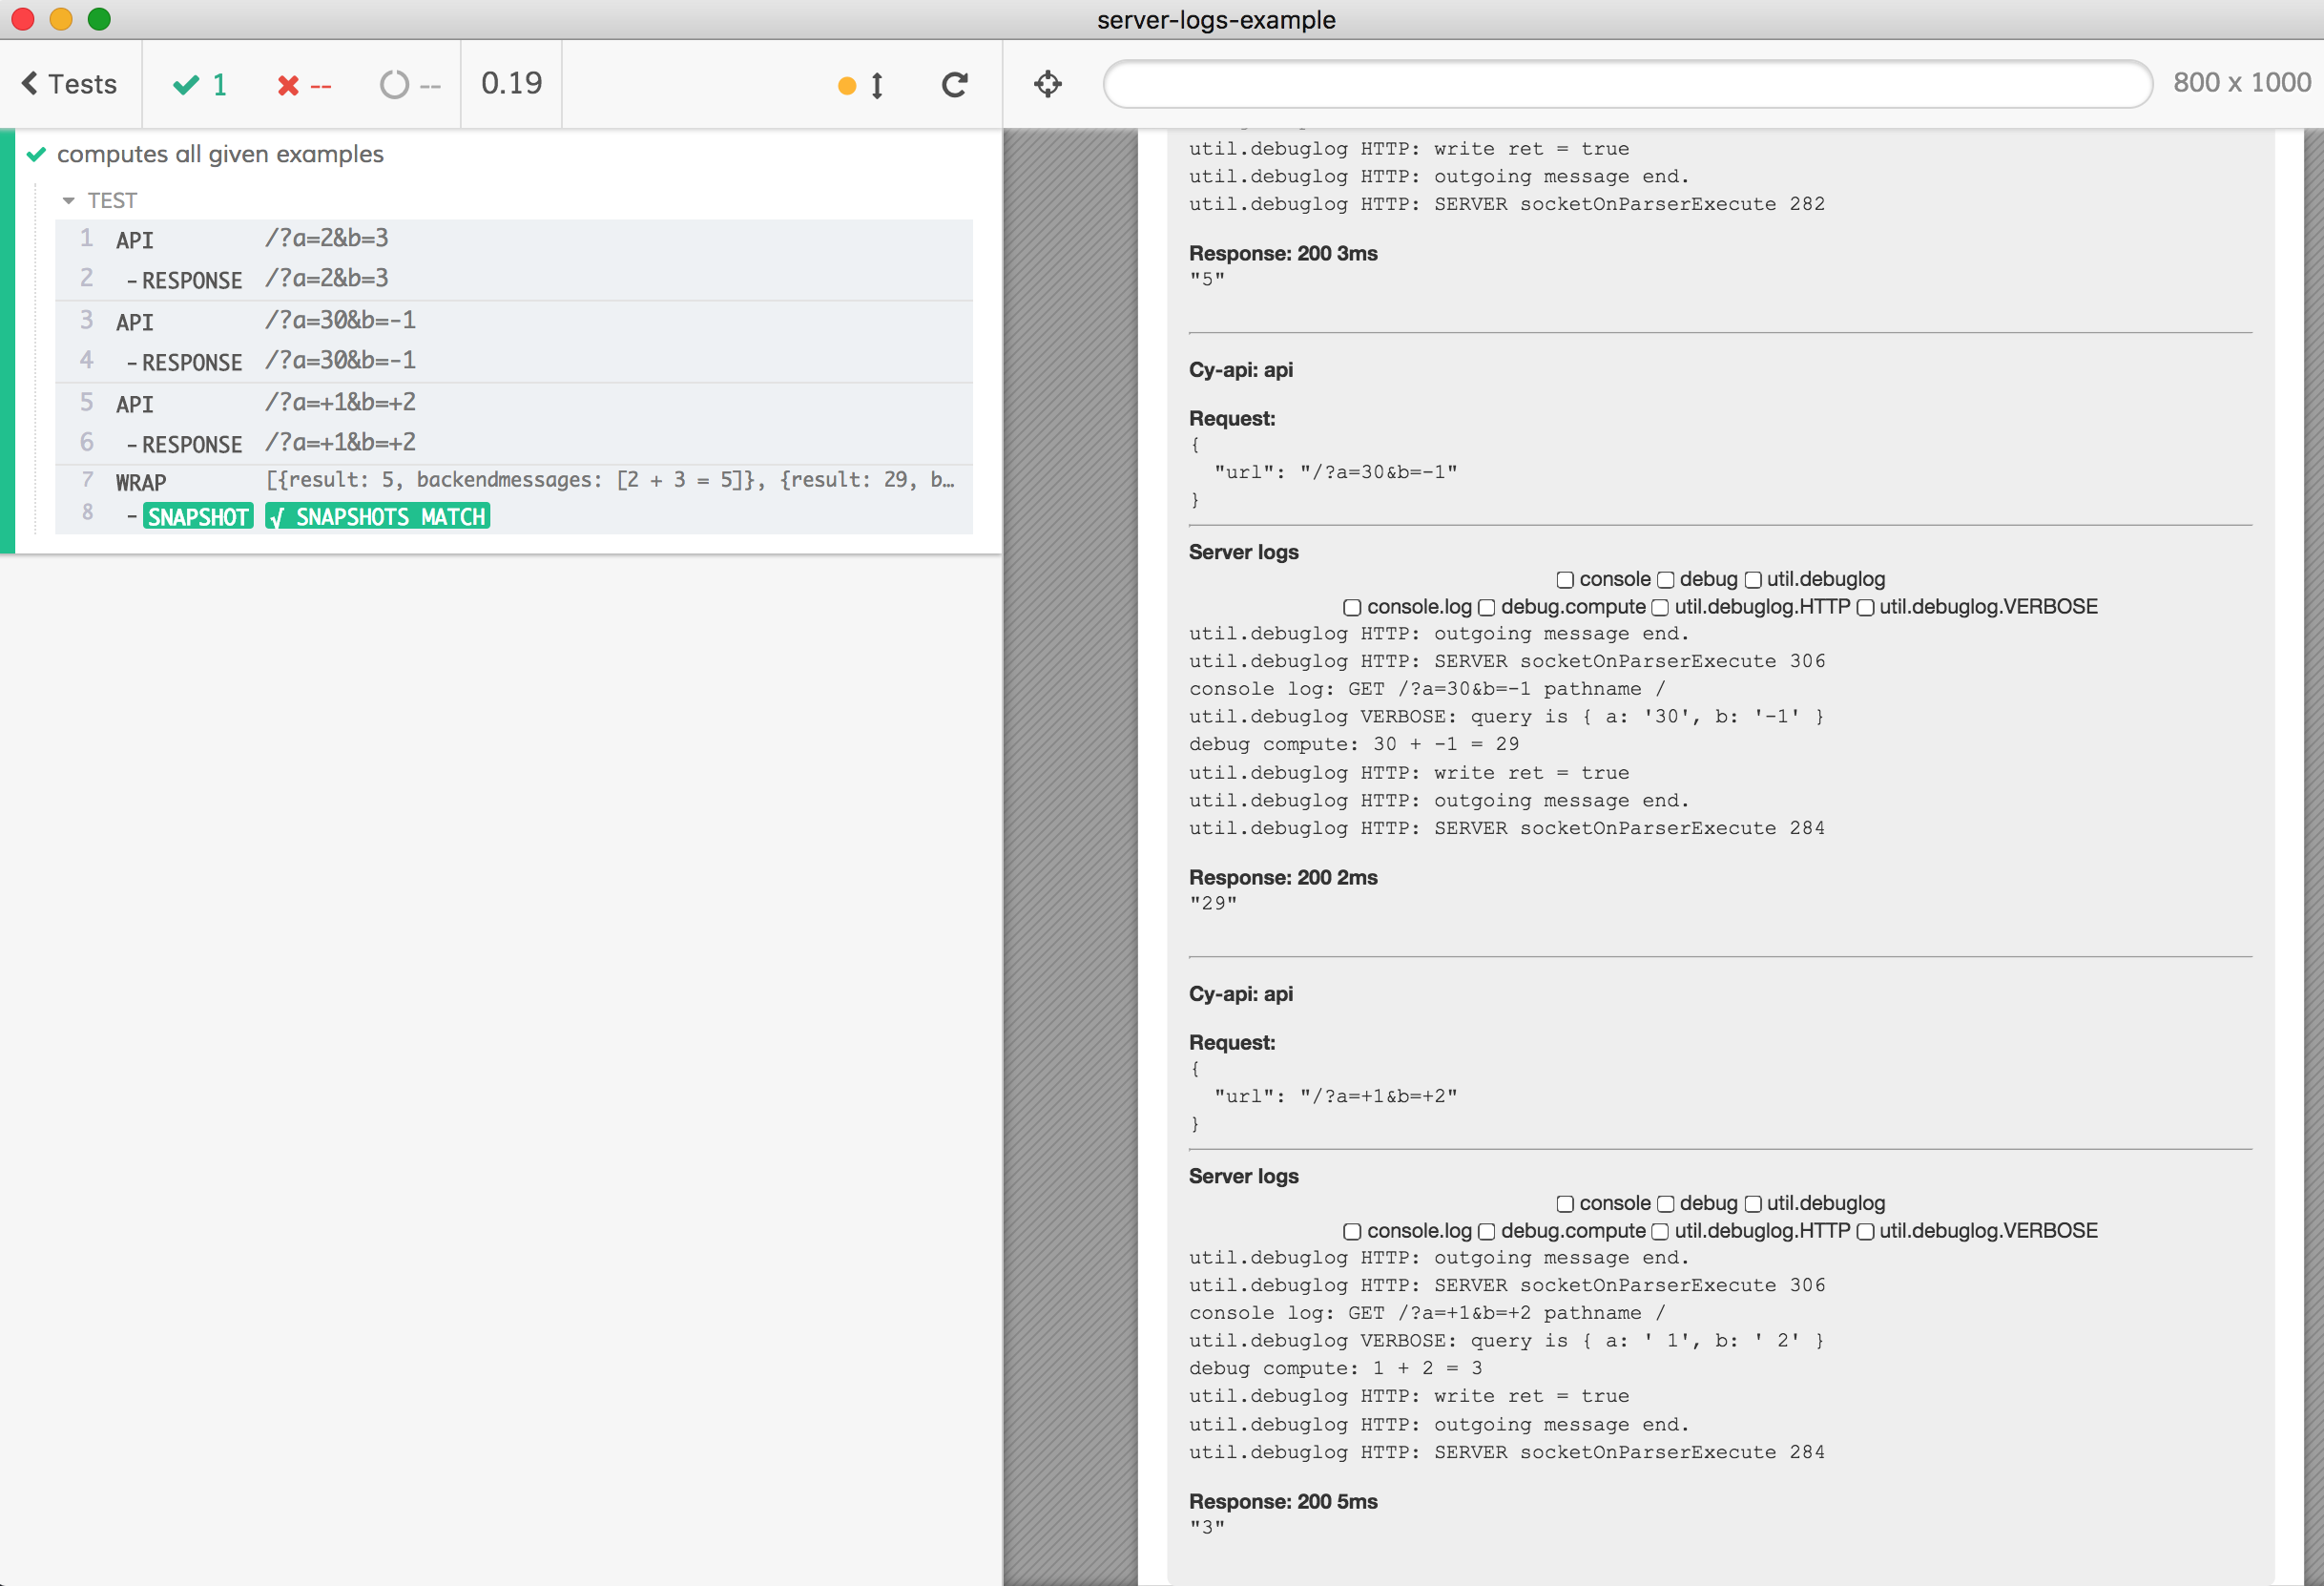
The beauty of this combined snapshot is: if we change the backend logic - for example by taking an absolute value of the arguments before adding them - the snapshot shows precisely where the good log and the current one started diverging!
1 | // added Math.abs on purpose to break the tests |
The test fails - the snapshot does not match, and the difference in the message and in the result is obvious.
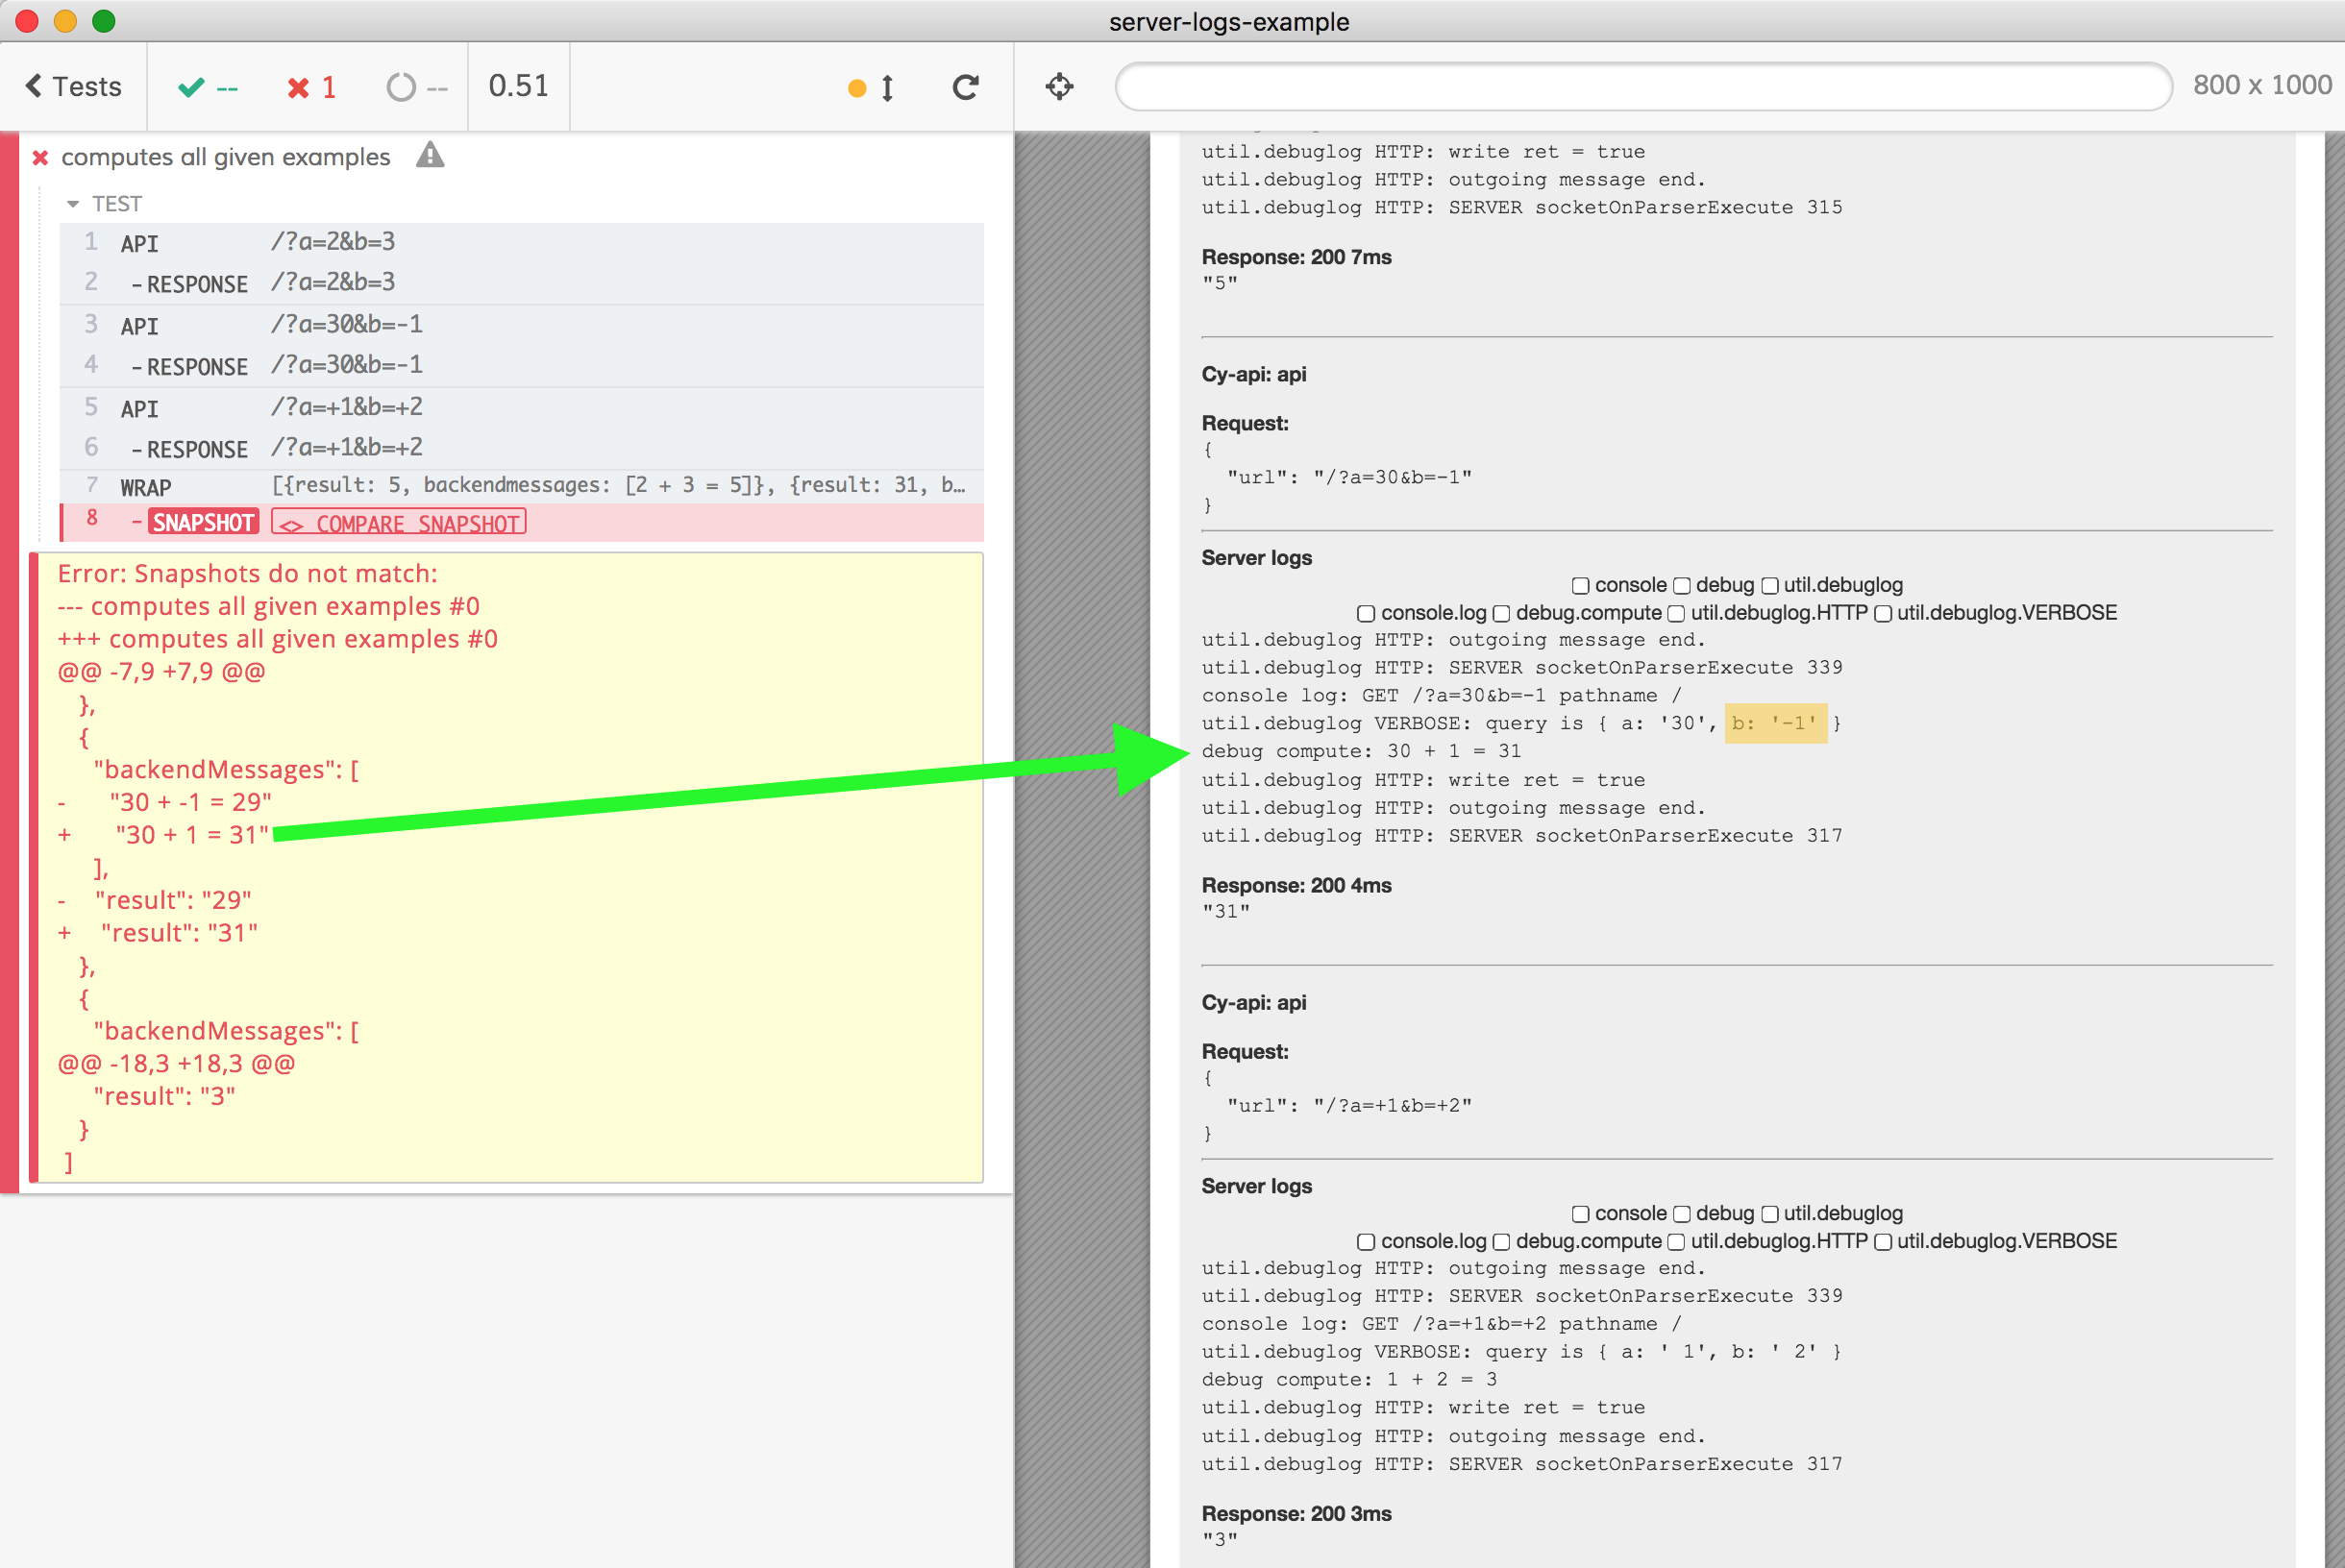
But even better is finding the log message for that cy.api call, shown with green arrow - and immediately seeing the previous log message. The query argument b is -1, yet the parsed value is 1 - that points the finger at the argument conversion step. Perfect - the debugging cycle is short, just like I wanted.
Conclusions
Testing the web application means testing the code at different levels: you still need unit tests and end-to-end web application tests. But the middle of the stack - the HTTP API deserves to be tested as well, since it is the foundation for the web application. The plugin @bahmutov/cy-api should help with API testing, and I hope the approach of capturing the detailed server-side logs helps when debugging a failing test.
Give cy.api a spin and open a GitHub issue if something does not work, or if you have an idea to make this type of testing better.
See also
- @bahmutov/cy-api plugin provides
cy.apicommand - @bahmutov/all-logs captures all server-side logs
- "Add GUI to your E2E API tests"
- "End-to-End Snapshot Testing" describes snapshot testing for web application testing
- "Picking snapshot library"
- meinaart/cypress-plugin-snapshots is the snapshot plugin I love using in Cypress