If you are using Karma and the test fails, and you might want to debug the unit test step by step. This is pretty easy to do. I will show how to do this using my library of lazy assertions called lazy-ass.
All tests pass when running them once
$ karma start karma.conf.js --browsers=Chrome
INFO [karma]: Karma v0.12.16 server started at http://localhost:9876/
INFO [launcher]: Starting browser Chrome
INFO [Chrome 37.0.2062 (Mac OS X 10.9.4)]: Connected on socket JdLYUgns9xLhl-F9xOjl with id 15416094
.......................
Chrome 37.0.2062 (Mac OS X 10.9.4): Executed 23 of 23 SUCCESS (0.052 secs / 0.041 secs)
When I run the tests a Chrome browser icon flashes briefly and then disappears. In order to debug, we need to disable single run mode and keep Karma running
$ karma start karma.conf.js --browsers=Chrome --single-run=false
Click on the launched Chrome instance (which now stays on) and click "Debug" button

The browser opens second tab with url http://localhost:9876/debug.html. You can open Chrome DevTools in this
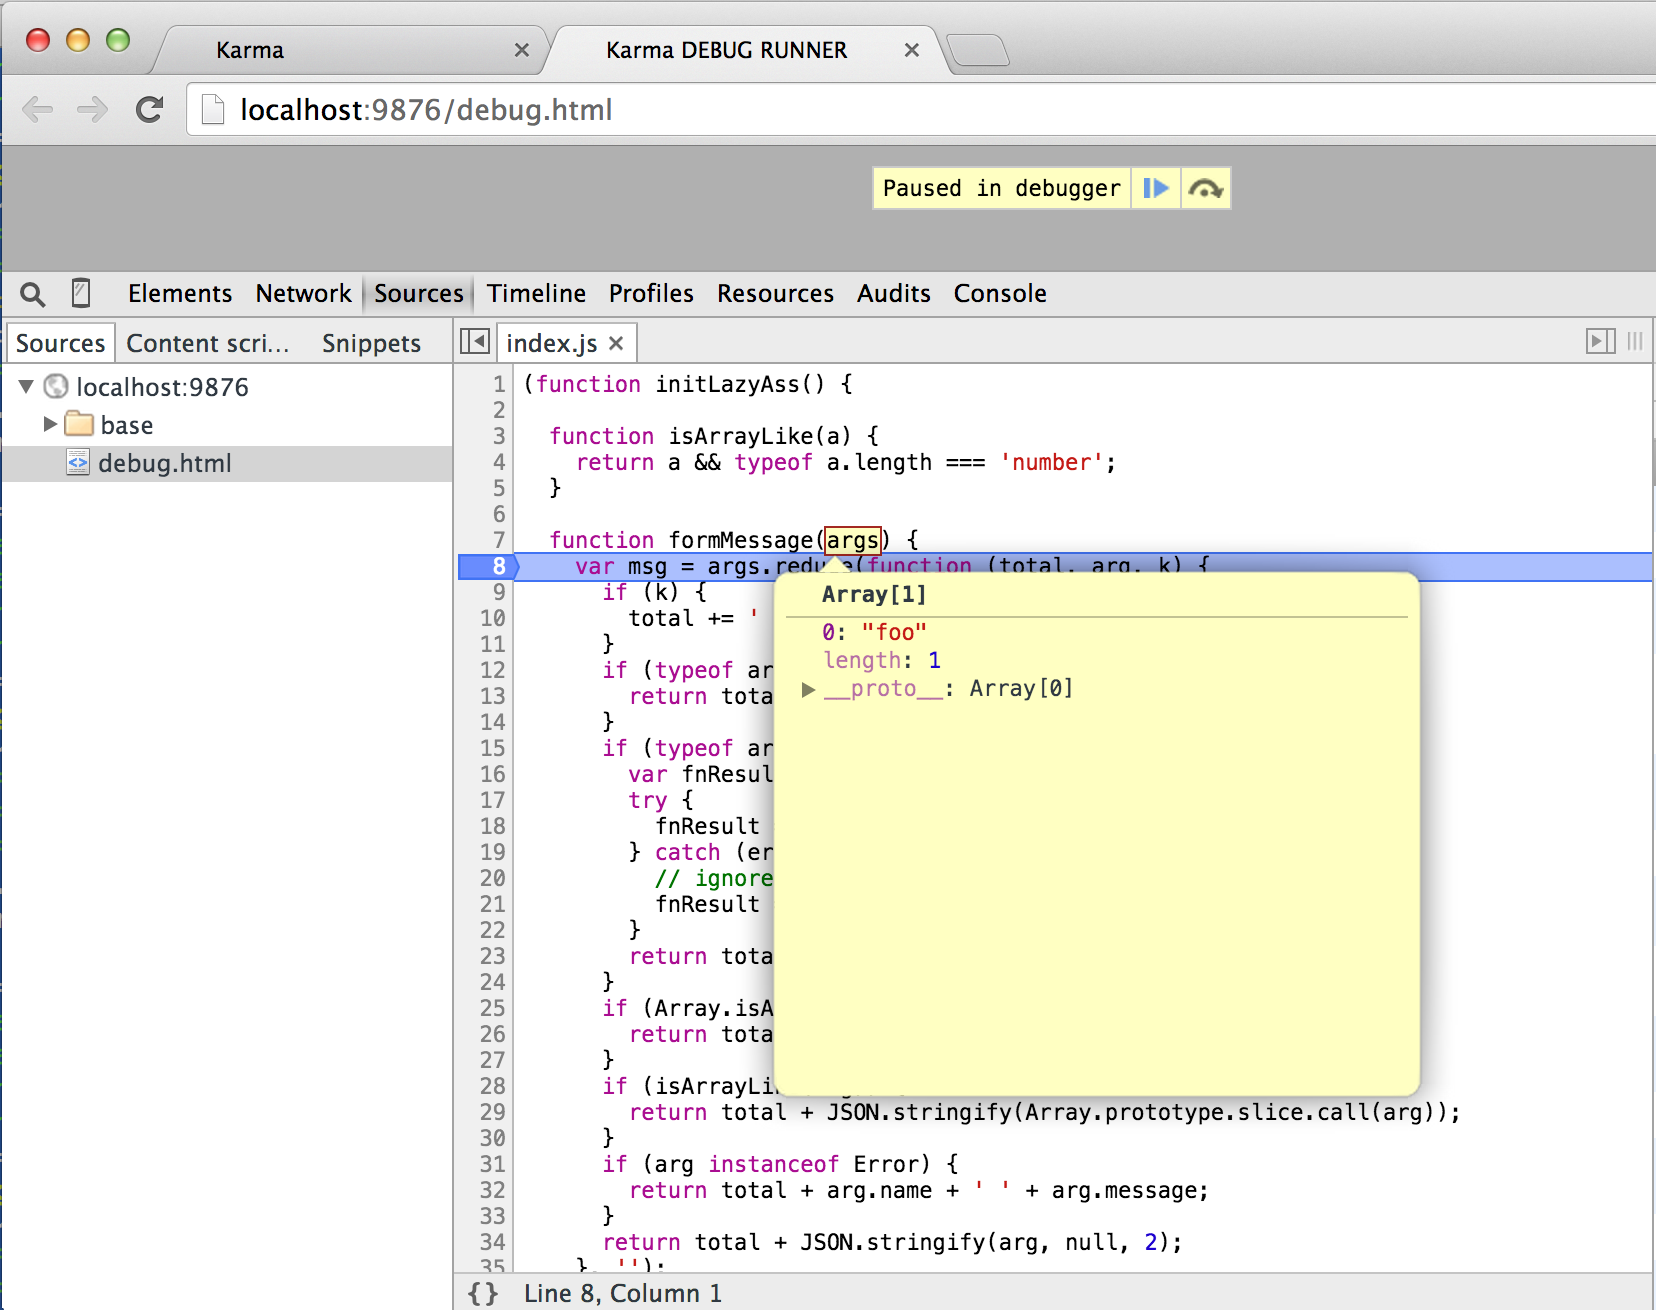
tab and look at the loaded sources tab. Here I am looking at the library source file index.js

Notice that the code is minified and has code coverage utilities sprinkled throughout. This is because we instrument the library code with extra commands to compute coverage data
// karma.conf.js
preprocessors: {
  'index.js': 'coverage',
},
The coverage commands get in the way of debugging, so let us disable coverage preprocessor if the user wants to debug.
1 | var sourcePreprocessors = 'coverage'; |
We are looking for --debug command line argument (using process.argv array), and if found, set the list of
preprocessorts to empty. If we rerun the karma again with new argument, and open the debug tab, we get our original
source code
$ karma start karma.conf.js --browsers=Chrome --single-run=false --debug

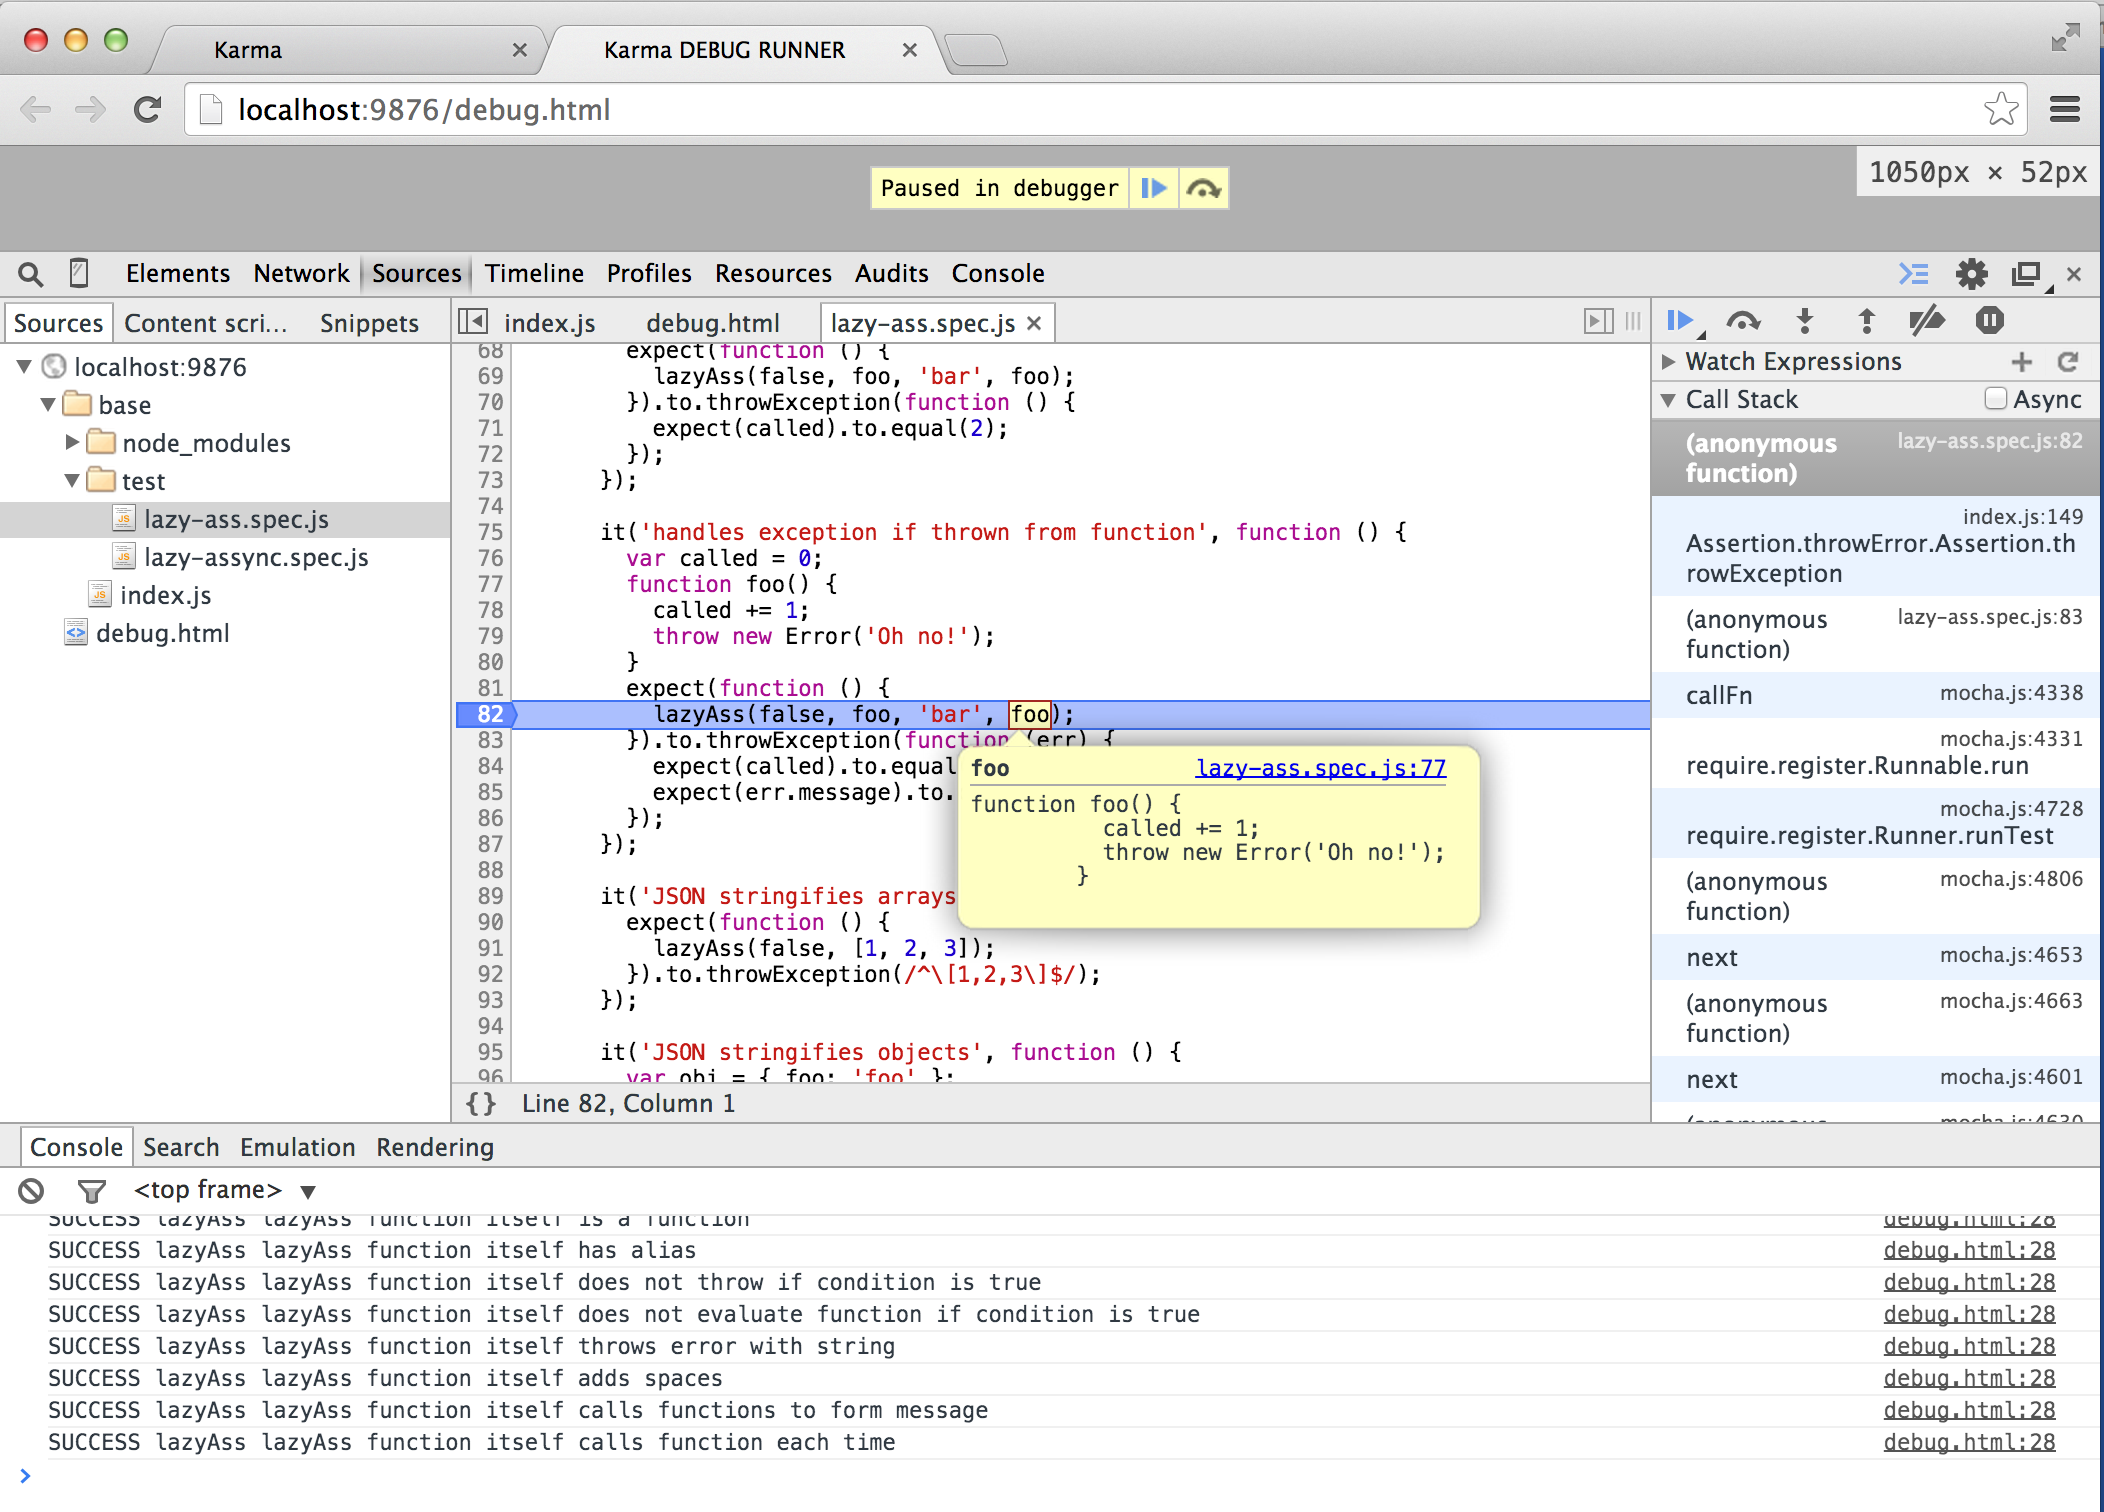
You can also put breakpoints in the spec files and step through the individual tests
