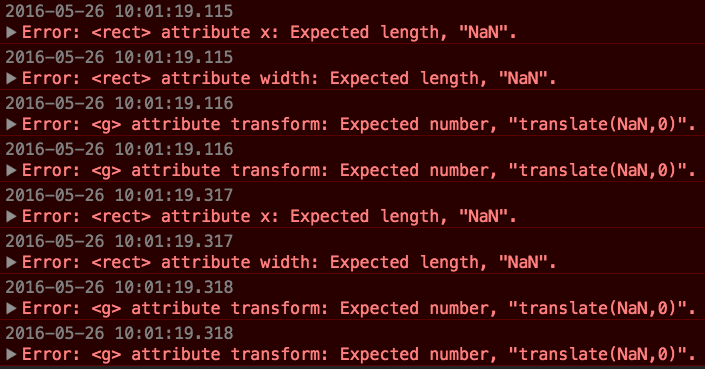
Recently, a weird front end error got us stuck. The browser console was showing lots of red error messages on window resize, yet no actual exceptions were thrown.

Seems this error message was displayed by the browser when setting an invalid attribute on an SVG node deep inside a chart. From the message stack I could place the blame on a specific JavaScript line in D3 library that was setting the attribute.

Problem was, this low level function is called A LOT, and in most cases with valid arguments. Only very infrequently the value of the second argument "e" is something that gets cast as "NaN". How do we set a breakpoint that stops on this line, but only for specific value of "e"?
Use conditional breakpoints!
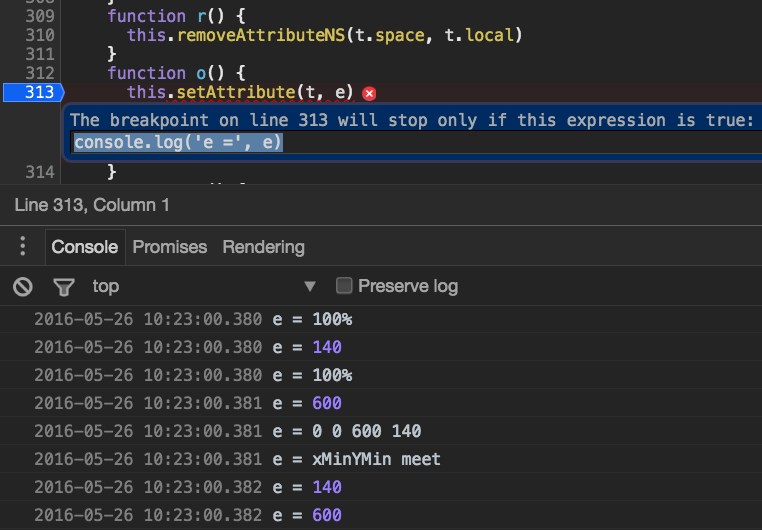
First, set a regular breakpoint at this line. Then, right click the breakpoint and select "Edit breakpoint". This will open an input box, where you can enter a JavaScript expression. The debugger will only stop at this line if the entered expression returns truthy result.

Run the code, and it does stop only if the second argument is "NaN".

Now I could go up the stack to find the source of invalid argument.
Bonus
We don't have to stop at the conditional break point. Sometimes we just want to log argument
values, for example. In this case, we can set the conditional breakpoint with simple
console.log('arg is', arg) expression. Every time the function runs, the value is
logged.

I do not think you can modify the variables from the conditional expression though. The breakpoint expression seems to be evaluated in an isolated context, thus changing "e" for example does not work. For example, trying to set "e" to 0 leaves it unchanged.
1 | String(e) === 'NaN' && e = 0 && e |
To learn more Chrome DevTools tips and tricks, read the long and excellent Tips And Tricks.