- Instrumenting the code as a pre-processor step
- During the tests
- The coverage report
- Code coverage from multiple spec files
- Code coverage on CI
- 100% code coverage
- See also
In my previous blog post "Stub navigator API in end-to-end tests" I have shown a small web application that shows the current battery charge information. Then I have shown several Cypress end-to-end tests and found an edge case that caused the application to crash.
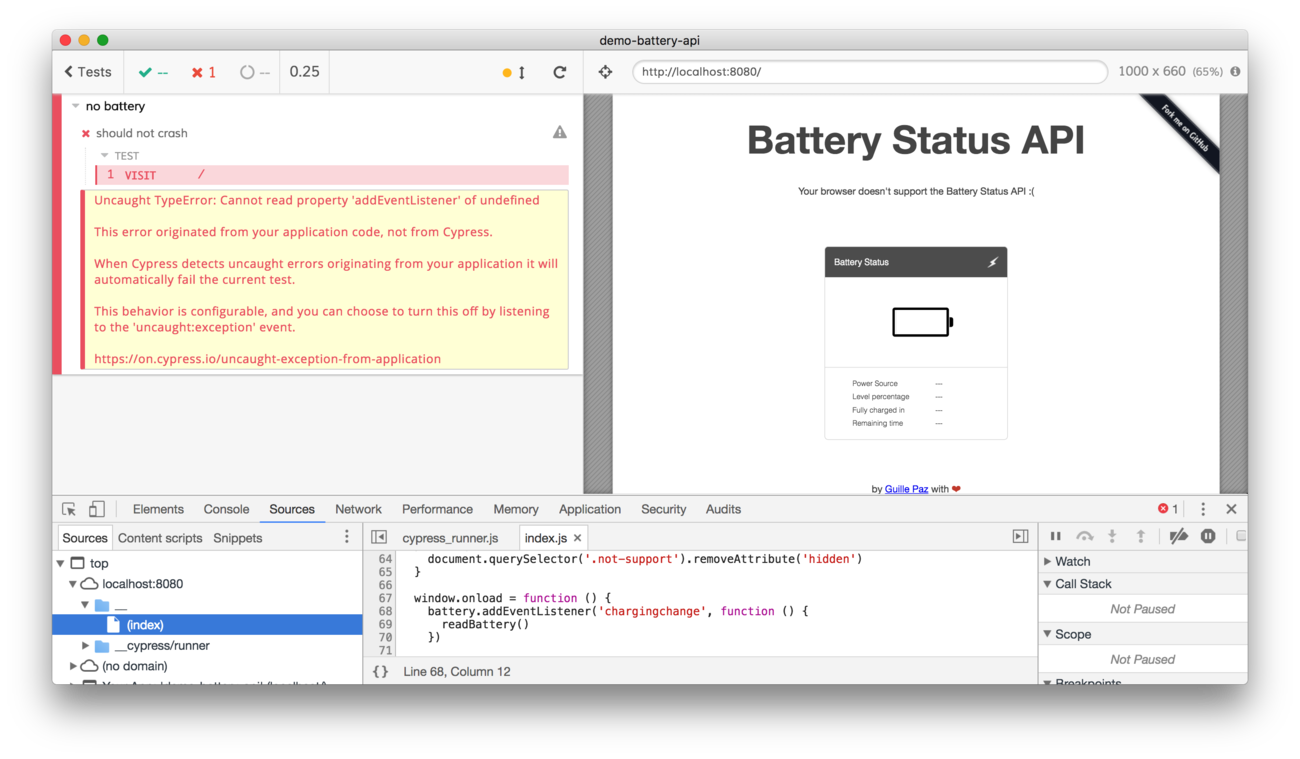
The crash was caused by the failure of the program src/index.js to account for the final - else code path when dealing with the browser capabilities.
1 | var battery |
Our end-to-end test in spec file no-battery.js removes both navigator.battery and navigator.getBattery properties and reaches the final - else path, causing the window.onload to crash - the variable battery remains undefined. If only we could see right away before writing no-battery.js that this code path is a problem!
Instrumenting the code as a pre-processor step
Cypress users who think collecting application code coverage during end-to-end tests proposed several solutions. All solutions instrument the web application code during the build step, then save the collected code coverage data after the tests. Finally, yet another step generates coverage report from the saved data. Let's see how it can be done for our battery API demo application.
You can find this code in branch coverage-step in the demo-battery-api repository.
First, we will instrument our application code as a pre-processing step using IstanbulJS library and its command line wrapper nyc. I will install the following two libraries
1 | npm install --save-dev nyc@14 istanbul-lib-coverage@2 |
I have added the command to instrument application code in src folder and place the instrumented code into build/src. The cp command copies the rest of the application files: HTML and styles.
1 | { |
If we execute npm run build we will get the instrumented application in the build folder. For demo purposes I pass --compact false during instrument step to avoid minification. The output code looks like this (this is only a small part of the instrumented code):
1 | if (navigator.battery) { |
The instrumentation just inserts counters into the code, incrementing them for each statement (the cov_w7e0b4vcv.s[31]++ line) and if - else branch (the cov_w7e0b4vcv.b[11][0]++ line). After the code finishes running, we can map the numbers from the object window.cov_w7e0b4vcv back to the original source code to see which lines were covered.
During the tests
The application code has been instrumented, and we serve the build folder during end-to-end tests, rather than the original src folder. Here is what we need to do in the browser during each test:
- reset the collected coverage before tests begin
- merge the code coverage collected during each test with previously collected data
- generate a coverage report in desired format after all tests have finished
The above 3 things are controlled by the cypress/support/index.js file that gets bundled with each spec file automatically.
1 | /// <reference types="cypress" /> |
Each cy.task jumps from the browser context to the backend context in Cypress where we have the full access to the file system. Thus we can save the code coverage JSON file and execute nyc to produce the report. Here is the cypress/plugins/index.js that keeps the code coverage object and generates the report:
1 | const istanbul = require('istanbul-lib-coverage') |
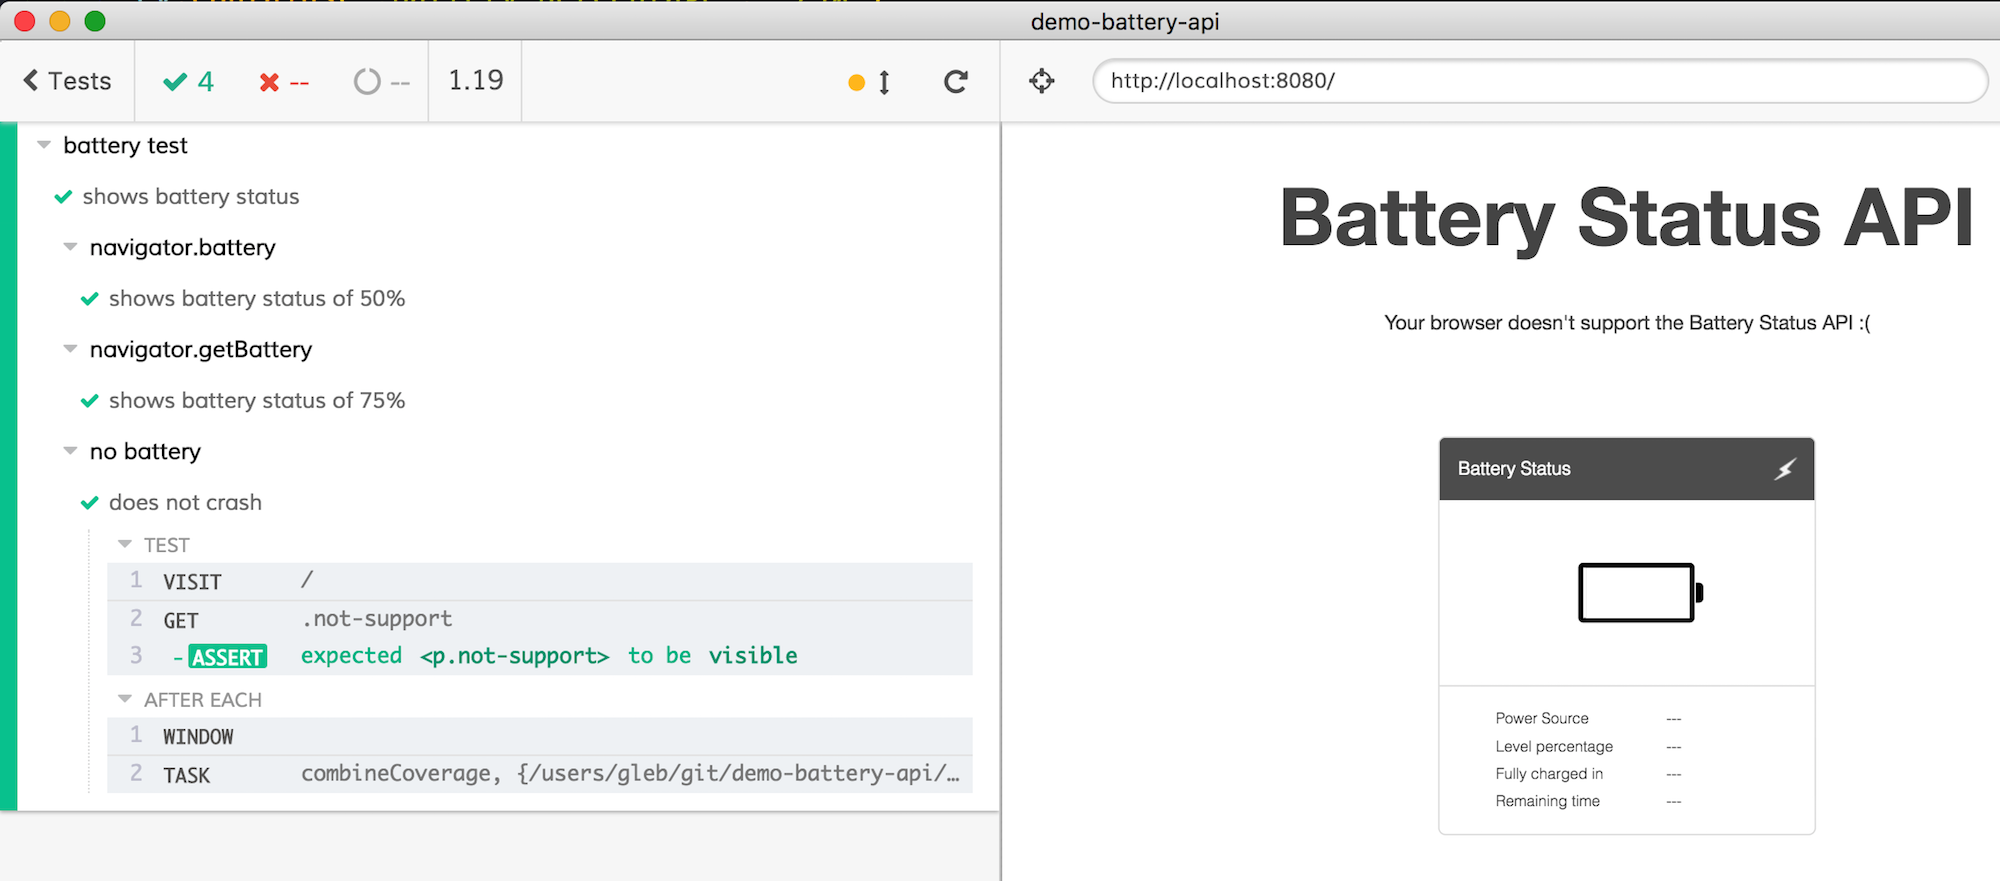
Let's run the instrumented tests. I will run just a single test that removes navigator.battery property.
1 | context('navigator.getBattery', () => { |
The Cypress Test Runner shows the code coverage related commands.
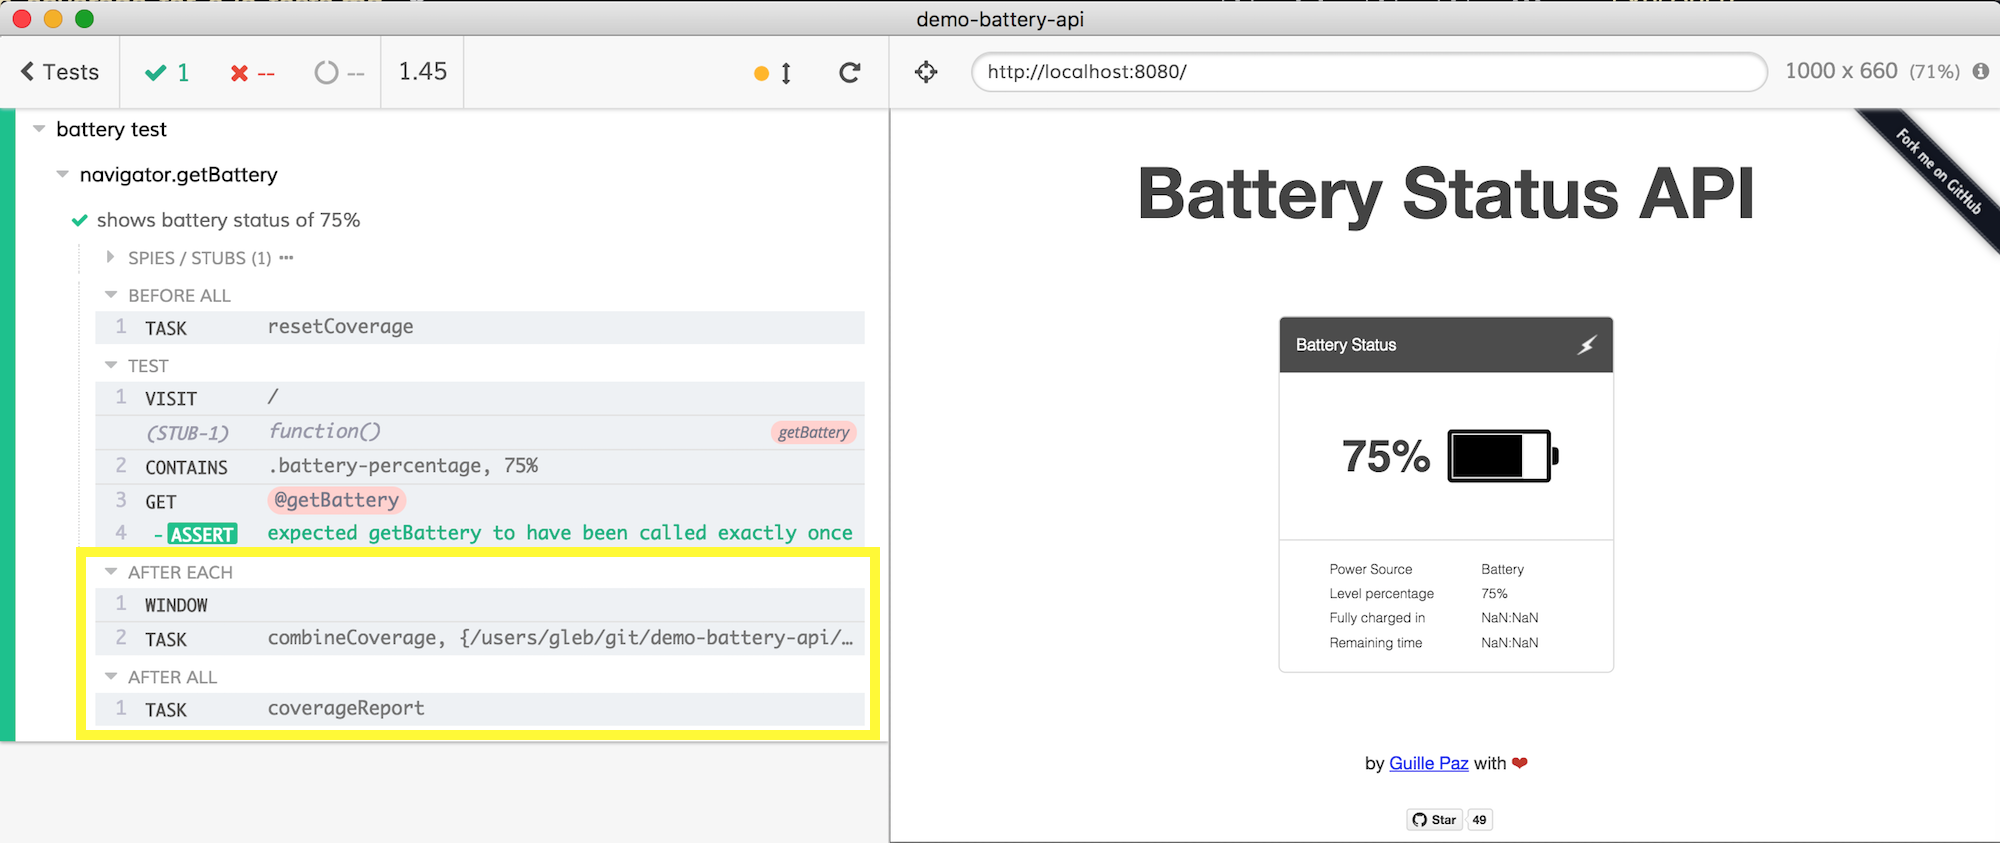
Great, let us see the covered lines.
The coverage report
The saved code coverage object is just a large JSON file .nyc_output/out.json like this
1 | { |
The object contains location of all statements, functions and branches in the original code, and the counters for how many times each item has been executed (for example the s counters are for statements). The human coverage report is generated from the .nyc_output/out.json file using npm script "report:coverage": "nyc report --reporter=html" is placed in coverage folder. It is a folder with a static site.
1 | coverage/ |
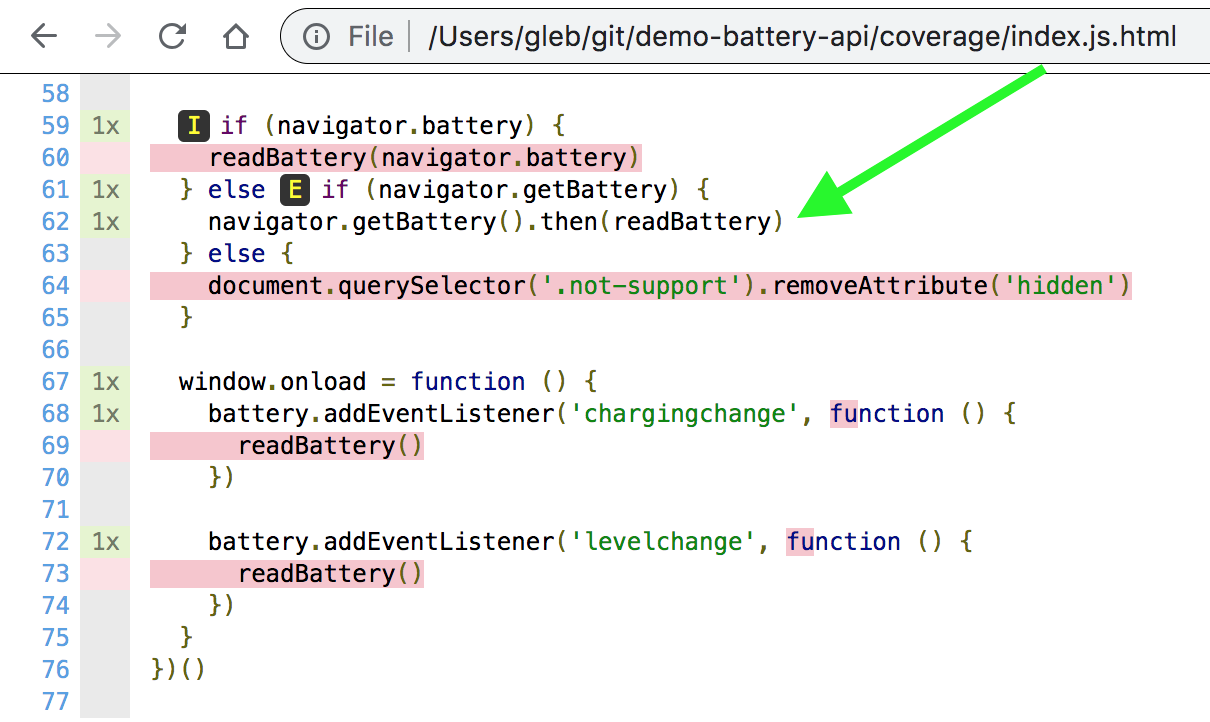
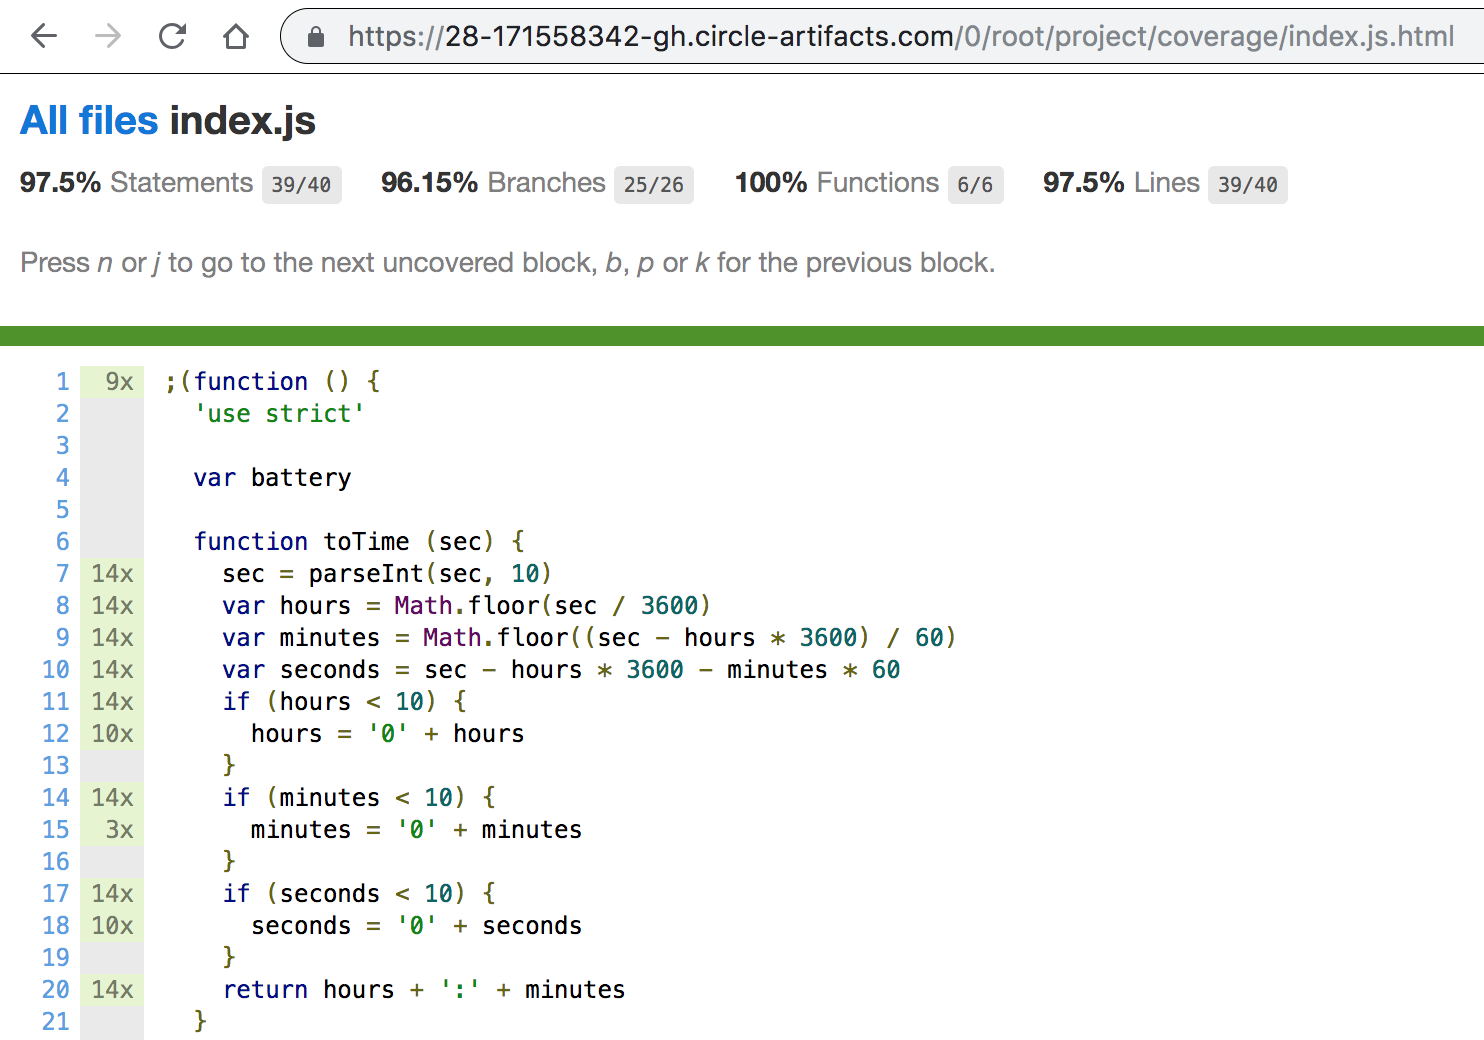
We can open the coverage/index.html file and see that our test really has hit just a single if - else line. Lines in red show the code NOT covered by the tests.
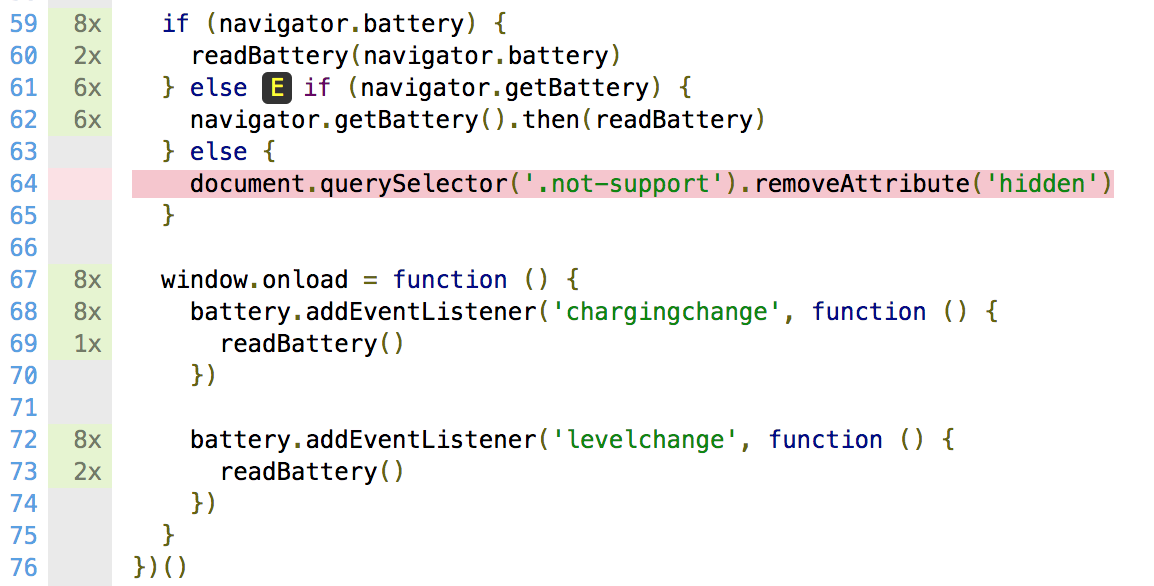
We can enable all tests and see more lines covered - and the only uncovered line is the third code path - else when there is neither navigator.battery nor navigator.getBattery methods.
Tip: I prefer having a separate npm script to generate the code coverage report, because we may want to generate reports in different formats. For example we can generate a summary report and show it in the terminal: "report:coverage": "nyc report --compact"
1 | $ npm run report:coverage |
We can even fail the build if the code coverage (lines, statements, branches or per file) is below given threshold:
1 | $ npx nyc report --check-coverage --statements 100 |
Better write more tests.
Code coverage from multiple spec files
If we have more than a single test (spec) file, we need to be careful when we reset the coverage information. There are two different cases, depending on how the test runner is running:
- if the test runner is in the interactive mode using
cypress openthen we can reset the coverage before the tests. This works for a single spec file, or when running all specs using "Run all specs" button. - if the test runner is in the headless mode using
cypress run, then each spec is processed separately. It is almost like executing a series of separate commands:cypress run --spec test1.js,cypress run --spec test2.js, etc. We cannot reset the coverage in that case - we risk destroying the information collected from the previous spec file. We need to reset the coverage before running Cypress. Luckily this is simple to do, here I am using npmprecy:runscript that automatically runs beforecy:runscript.
1 | { |
From the tests, we can pass isInteractive flag to the task, and only reset the coverage file when isInteractive is true.
1 | before(() => { |
1 | module.exports = (on, config) => { |
Perfect.
Code coverage on CI
The generated HTML code coverage report can be stored on continuous integration server as a static artifact. I am running these builds on CircleCI at https://circleci.com/gh/bahmutov/demo-battery-api/tree/coverage-step using Cypress Circle Orb. After the test run, I store the coverage folder as a test artifact. Here is the entire CI config file circle.yml
1 | # see https://github.com/cypress-io/circleci-orb |
Note that on CI we do not need to remove the code coverage folder .nyc_output before starting cypress run - because CI server automatically gets a fresh workspace folder.
You can see the artifact with each build. For example you can browse to the artifacts in the build #28
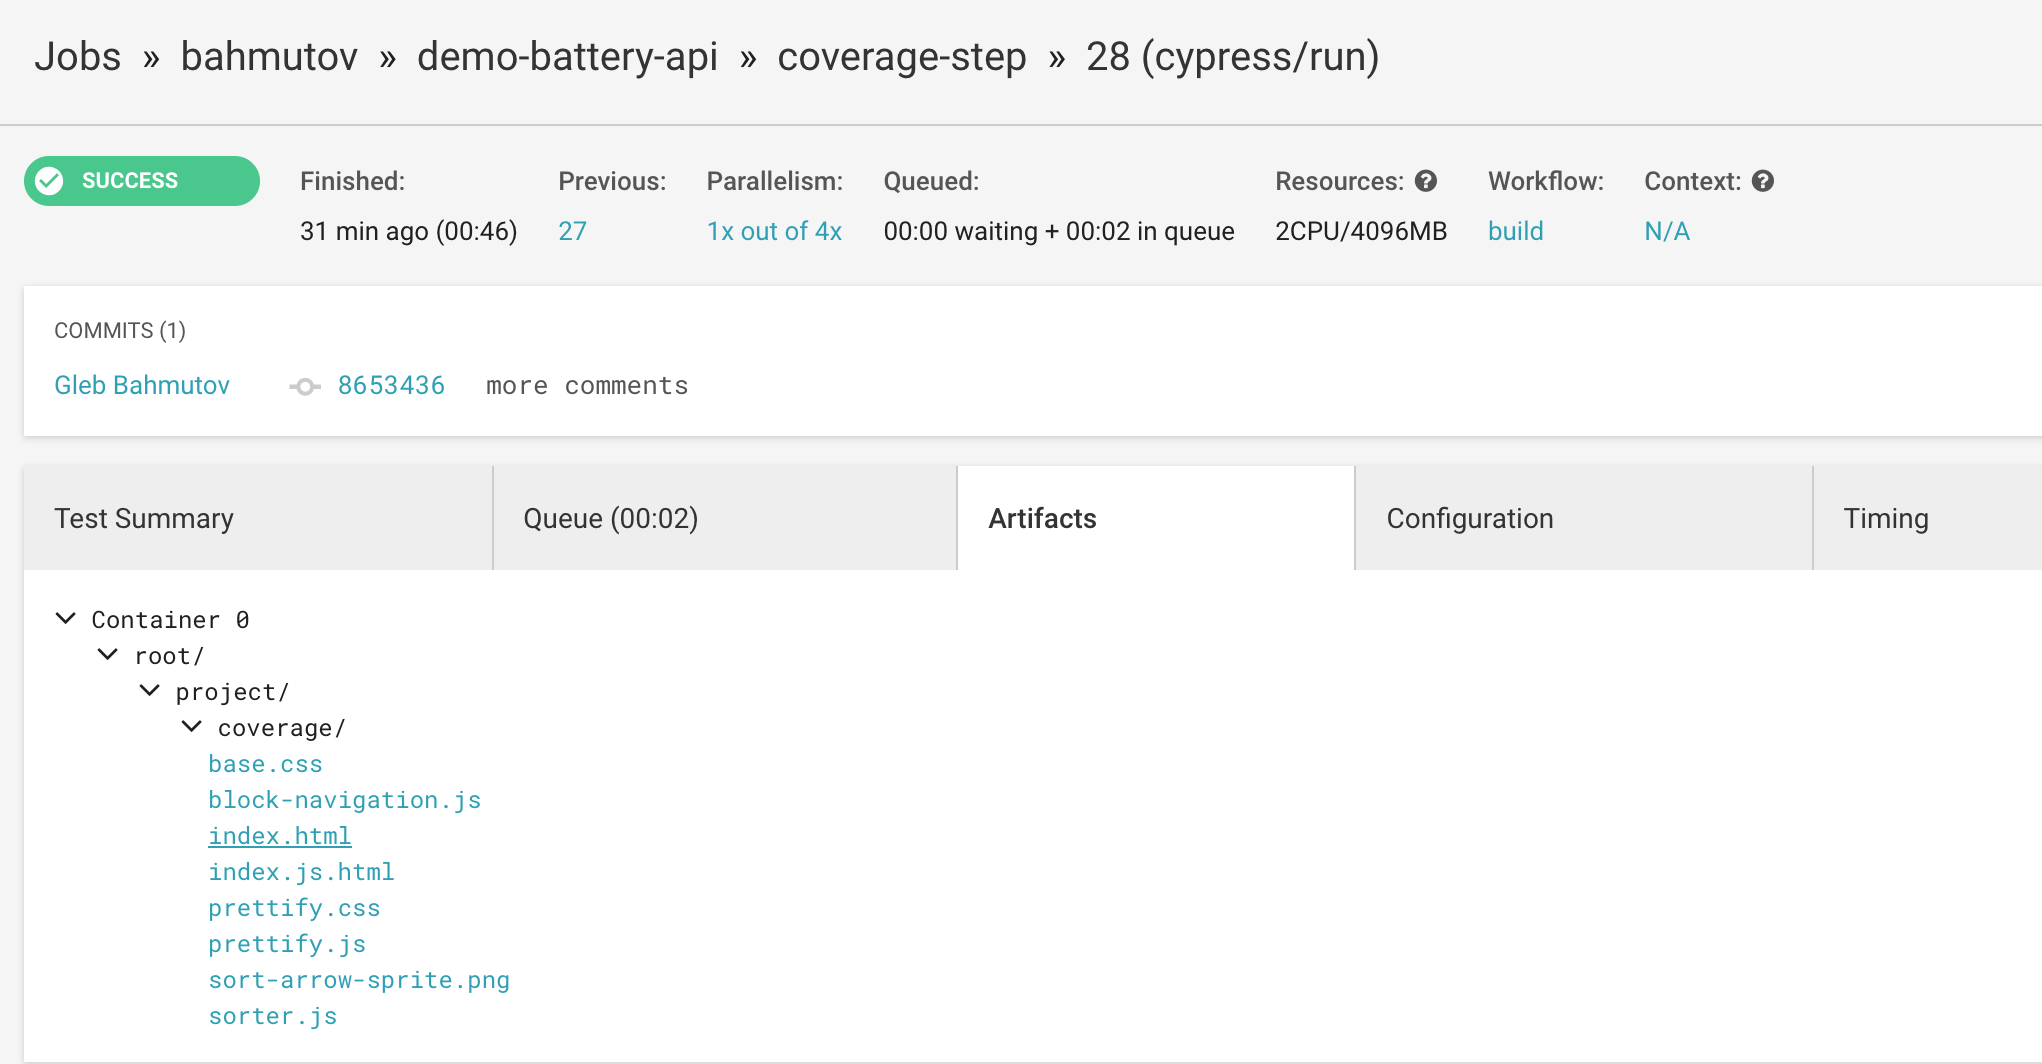
Click on index.html to see the JavaScript coverage report
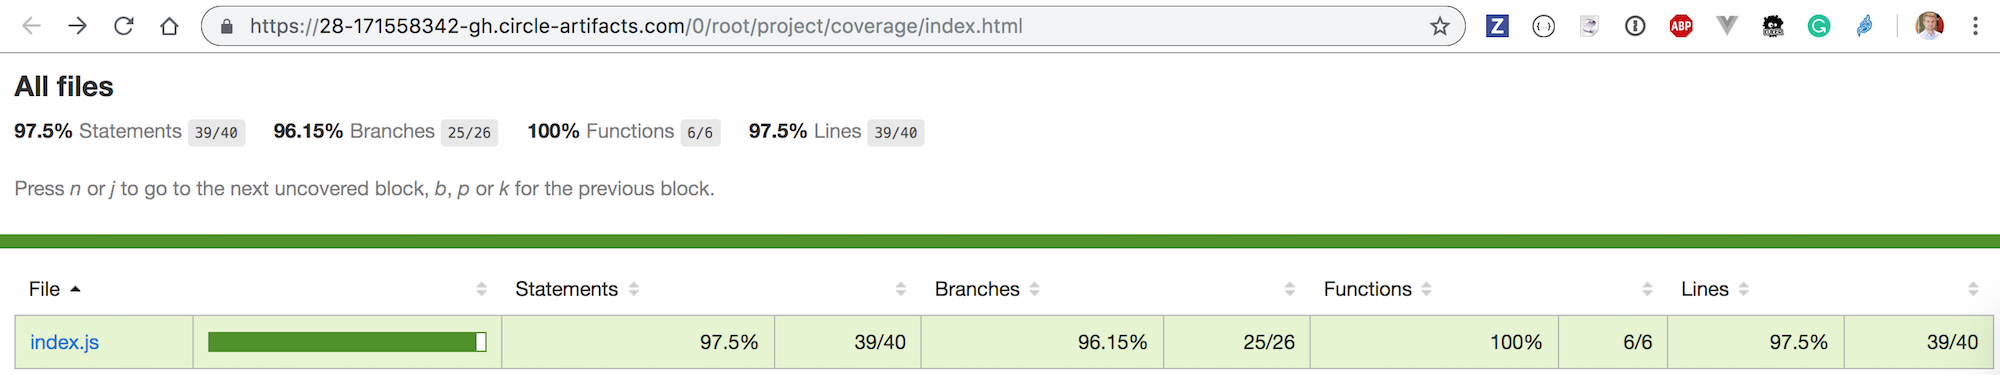
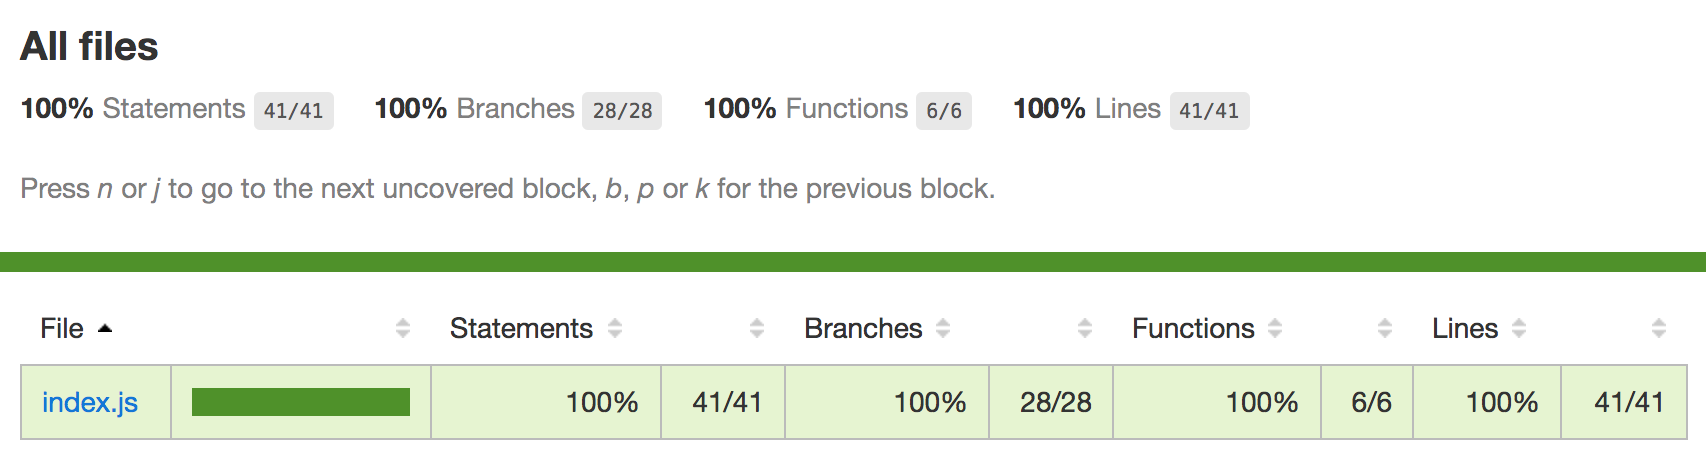
We have only a single JavaScript application file, open the report for index.js by clicking on it.
100% code coverage
Hitting a 100% code coverage is a hard and thankless task. Code coverage is not the goal in itself, rather the gap in the code coverage helps me identify a missing test and an overlooked edge condition. In our case, the uncovered logical branch shows that we did not test what happens when the browser navigator object does not have the battery API. Let's fix the issue and enable the previously crashing test.
1 | window.onload = function () { |
You need to rerun the instrumentation step again (npm run build in my case). Enable the previously crashing test - and it is passing now!
Run all tests again - interactively using "Run all tests" button, or using npm run cy:run and get the 100% code covered.
See also
- The example source code is in the branch coverage-step in the demo-battery-api repository
- "Stub navigator API in end-to-end tests" is the previous blog post explaining the end-to-end tests for this web application
- Code coverage Cypress repo issue #346
- Cypress.io code coverage guide