Automating front end testing is often difficult and labor-intensive task. The user interface is fluid and often changed by designers. We have to do manual exploration testing in order to cover all code paths. If we test the web application manually, can we tell what code have been executed?
We could instrument the code on the server, but that means we are running different code base in different environments. I strongly believe we should be running the same code in the development, staging and production environments. Instead of modifying the code on the server, I wrote a Node proxy was-tested that instruments application's JavaScript on the fly, while letting the rest of the data be passed back and forth between the user and the actual server.
To install the proxy, use npm install -g was-tested.
Start was-tested by specifying target url and which urls to instrument.
was-tested --target <server url> --reset --instrument "app*.js"
Open the proxy url in the browser, the website should be fully functioning (except for web sockets).
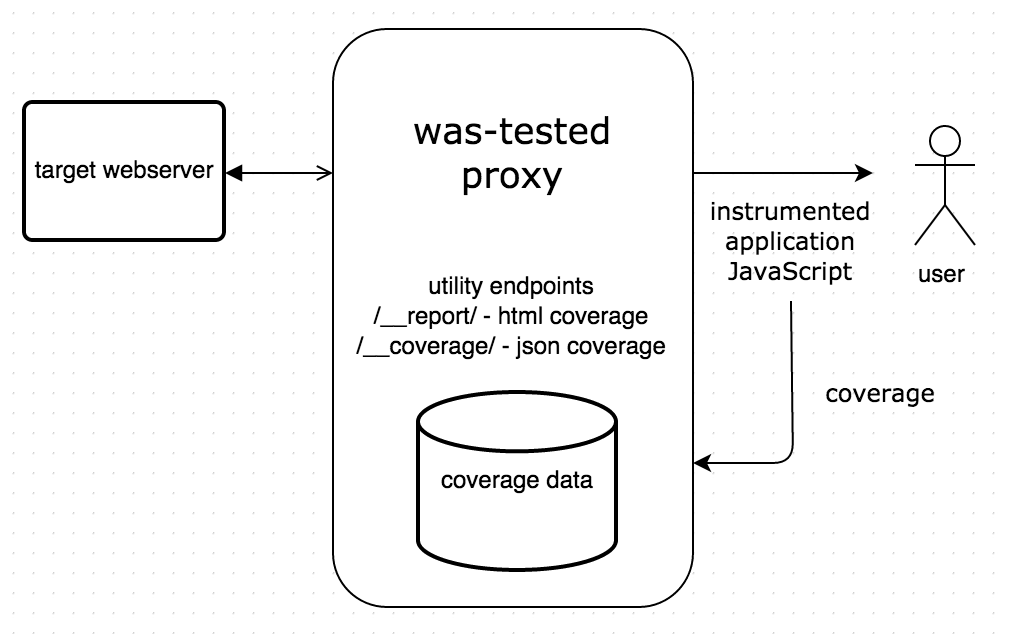
The updated code coverage is sent back to the proxy, where is accumulates. You can see HTML report
by browsing to <proxy url>/__report/. The complete coverage collected so far can be downloaded as a json
from <proxy url>/__coverage/. The coverage file is generated using istanbul.
Example
You can see the code coverage in action using an example included in the was-tested repo. Run the example using a static webserver, I recommend http-server.
npm install -g http-server
git clone https://github.com/bahmutov/was-tested.git
cd was-tested/test/button-click
http-server -p 3003
You should see the original application by browsing to localhost:3003. Now start the proxy
was-tested --target http://localhost:3003 --reset --instrument "app.js"
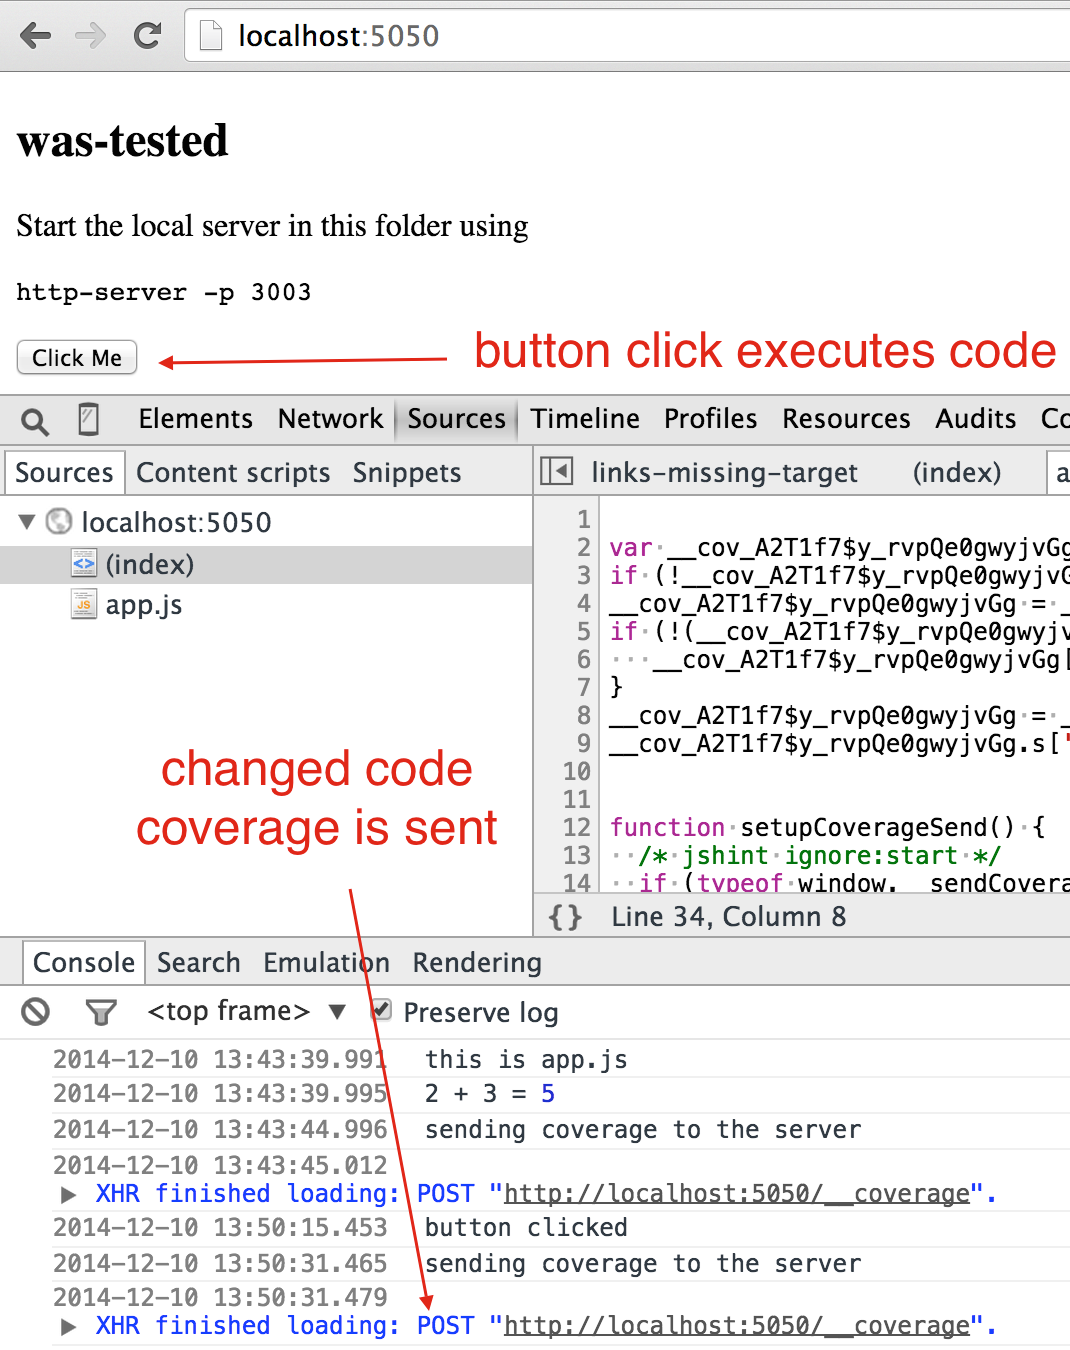
Browse to localhost:5050 and you should see the same example. If you open the DevTools and look at app.js
you should see instrumented code.
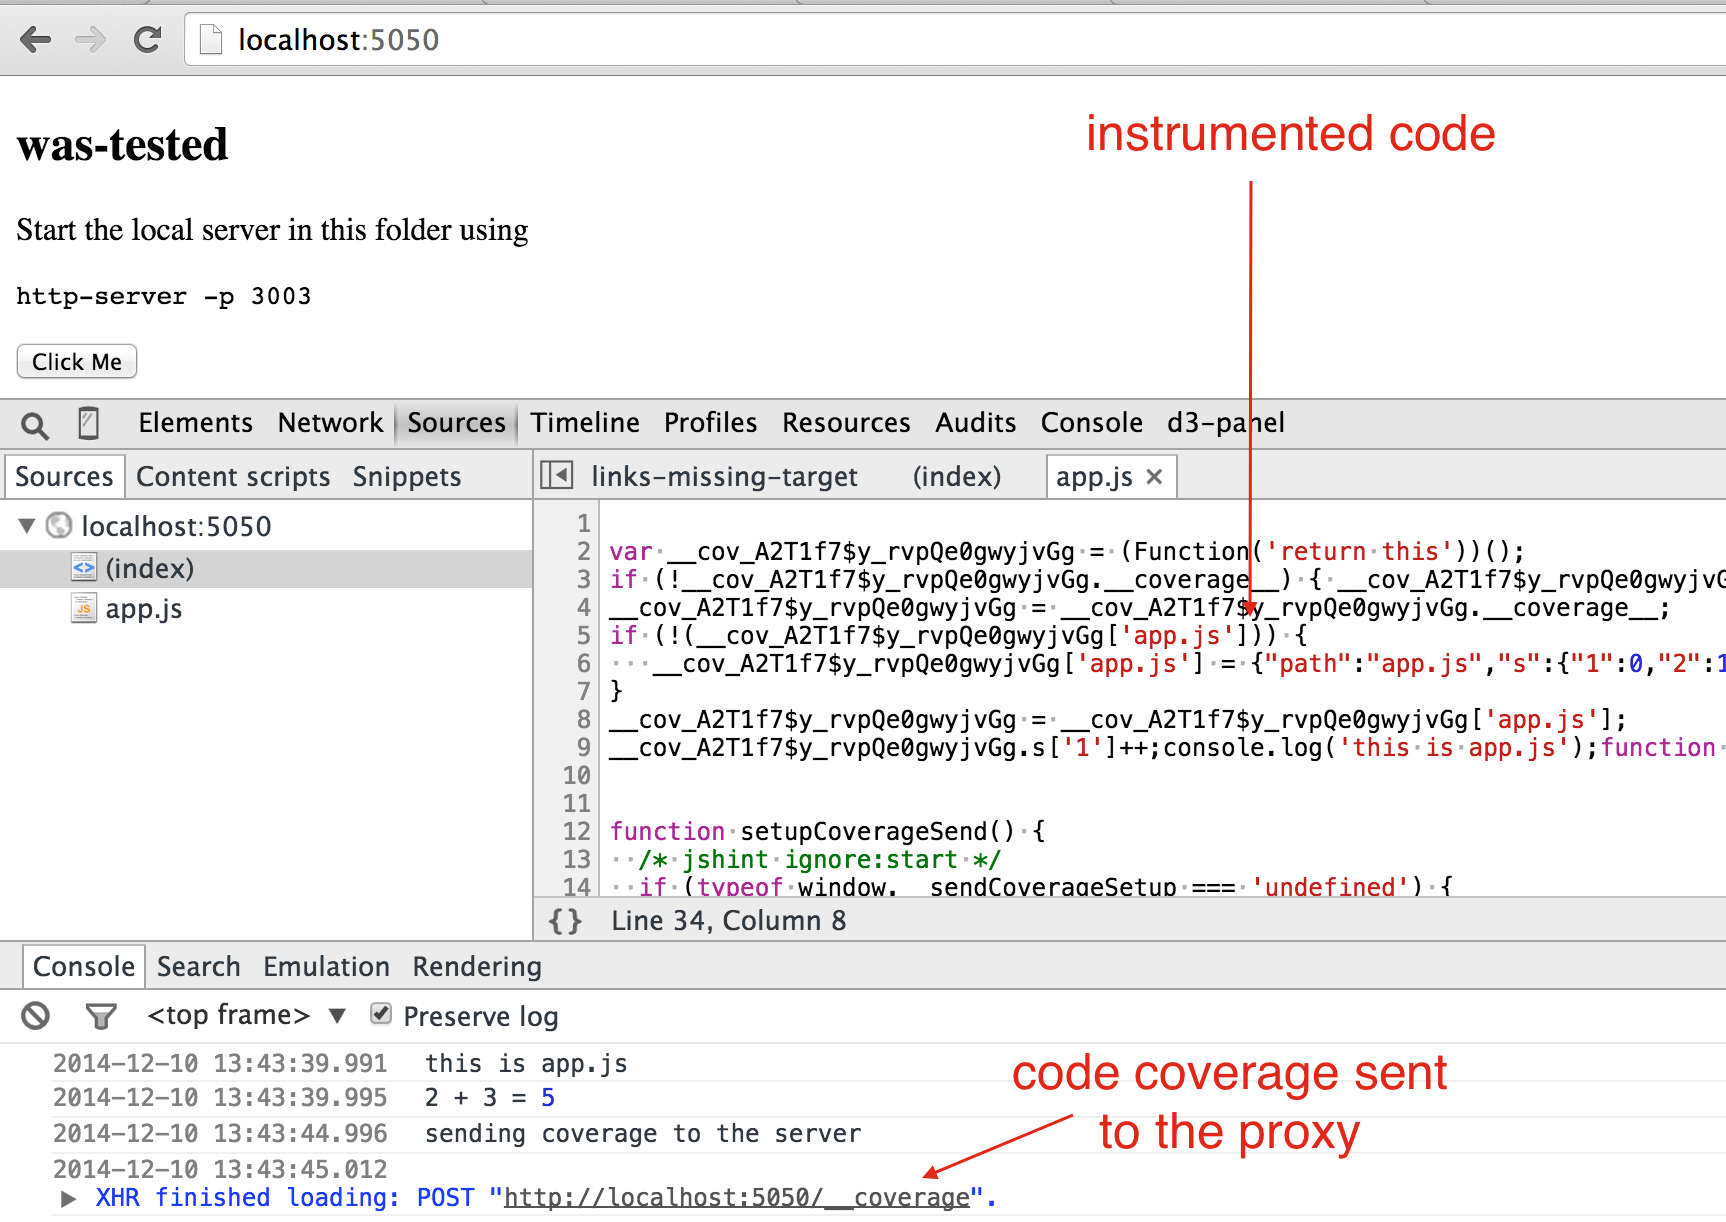
The network log shows the coverage information sent back to the proxy.
Every 5 seconds the script injected by the proxy into the app.js checks if the coverage has changed.
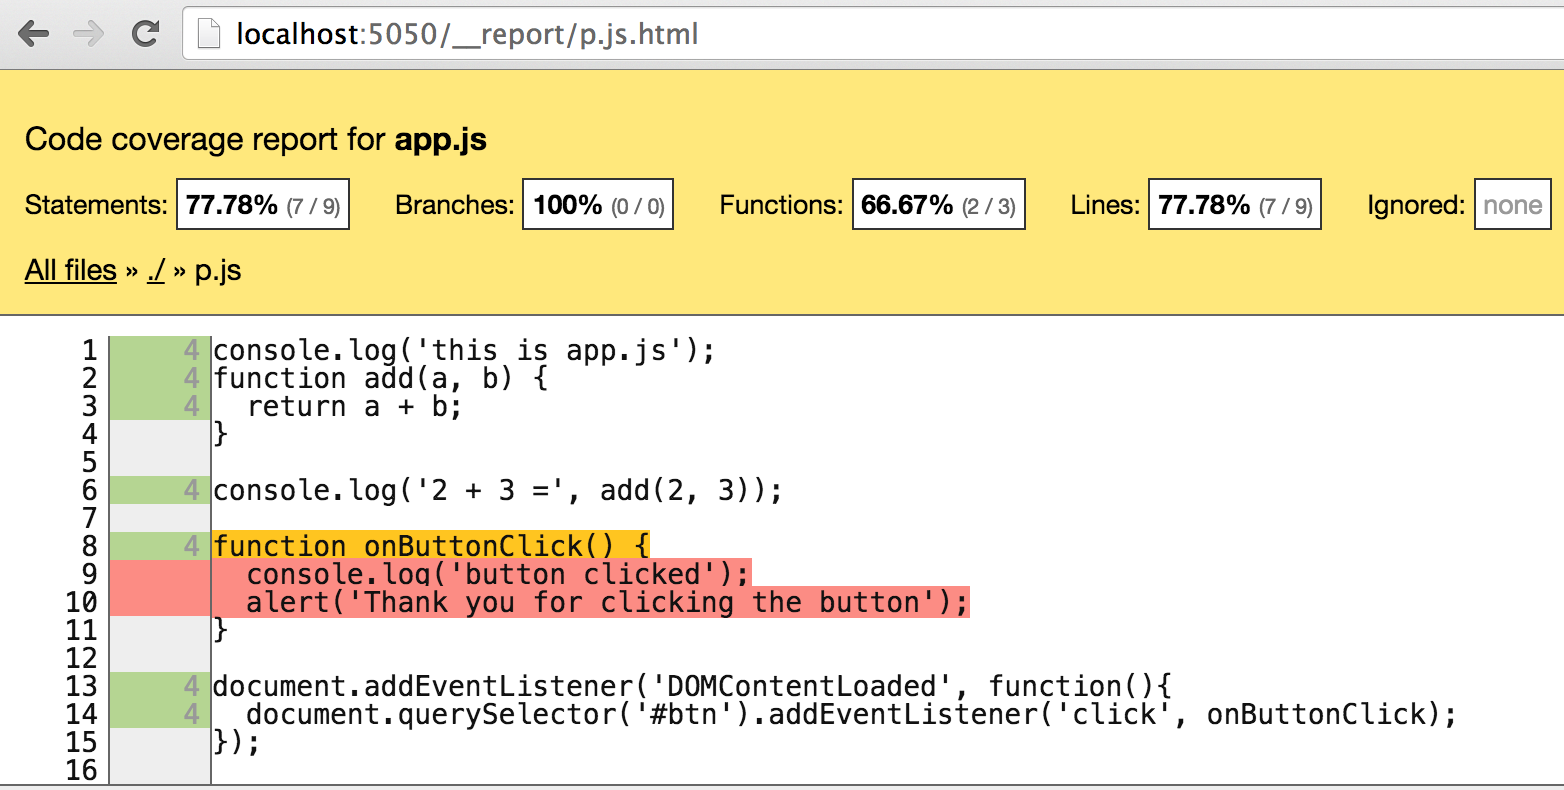
If code coverage object has changed, it is sent back to the proxy. You can see the initial code coverage
as a report by opening localhost:5050/__report/ page.
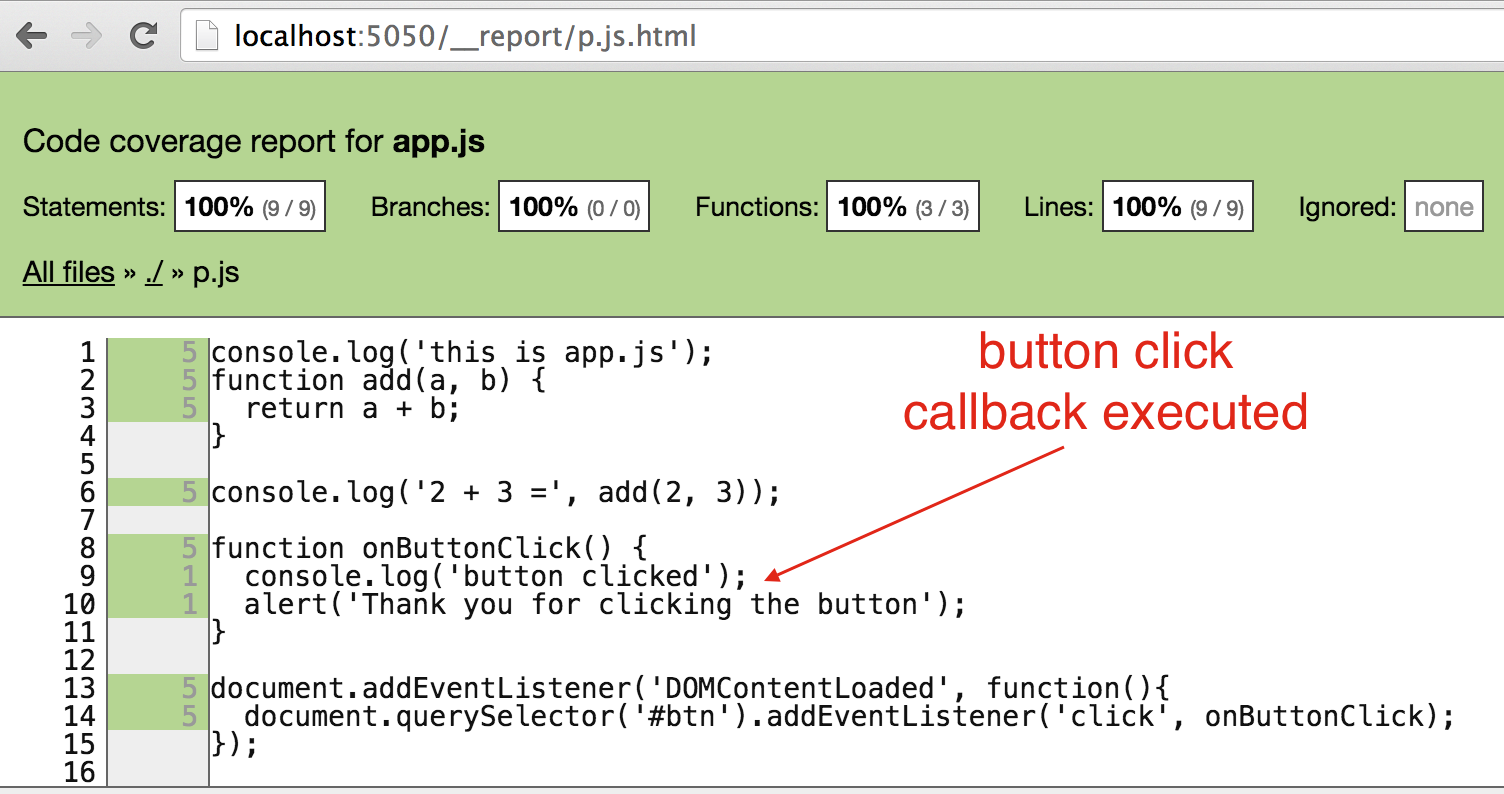
Now click the button "Click Me" on the page. It should pop an alert. Click "Ok" and then see the updated code coverage information sent to the proxy.
If you reload the HTML code coverage report, you should see that all code lines are covered now.